 Explore
 Validate
 Learn
Learn Flow cytometry
 Other assay
Antibody data
- Antibody Data
- Antigen structure
- References [15]
- Comments [0]
- Validations
- Other assay [10]
Submit
Validation data
Reference
Comment
Report error
- Product number
- 17-7029-41 - Provider product page

- Provider
- Invitrogen Antibodies
- Product name
- IL-2 Monoclonal Antibody (MQ1-17H12), APC, eBioscience™
- Antibody type
- Monoclonal
- Antigen
- Other
- Description
- Description: The MQ1-17H12 antibody reacts with human interleukin-2 (IL-2), a 17 kDa T cell growth factor and a major immunoregulatory cytokine. The MQ1-17H12 antibody is a non-neutralizing antibody. Applications Reported: MQ1-17H12 has been reported for use in staining of intracellular IL-2. Applications Tested: This MQ1-17H12 antibody is tested by intracellular staining and flow cytometric analysis of activated human normal human peripheral blood cells.This product has been pre-titrated and tested intracellular staining and flow cytometric analysis of activated human normal human peripheral blood cells. This can be used at 5 µL (0.125 µg) per test. A test is defined as the amount (µg) of antibody that will stain a cell sample in a final volume of 100 µL. Cell number should be determined empirically but can range from 10^5 to 10^8 cells/test. Excitation: 633-647 nm; Emission: 660 nm; Laser: Red Laser. Filtration: 0.2 µm post-manufacturing filtered.
- Reactivity
- Human
- Host
- Rat
- Isotype
- IgG
- Antibody clone number
- MQ1-17H12
- Vial size
- 25 Tests
- Concentration
- 5 µL/Test
- Storage
- 4° C, store in dark, DO NOT FREEZE!
Submitted references Dynamics of spike-and nucleocapsid specific immunity during long-term follow-up and vaccination of SARS-CoV-2 convalescents.
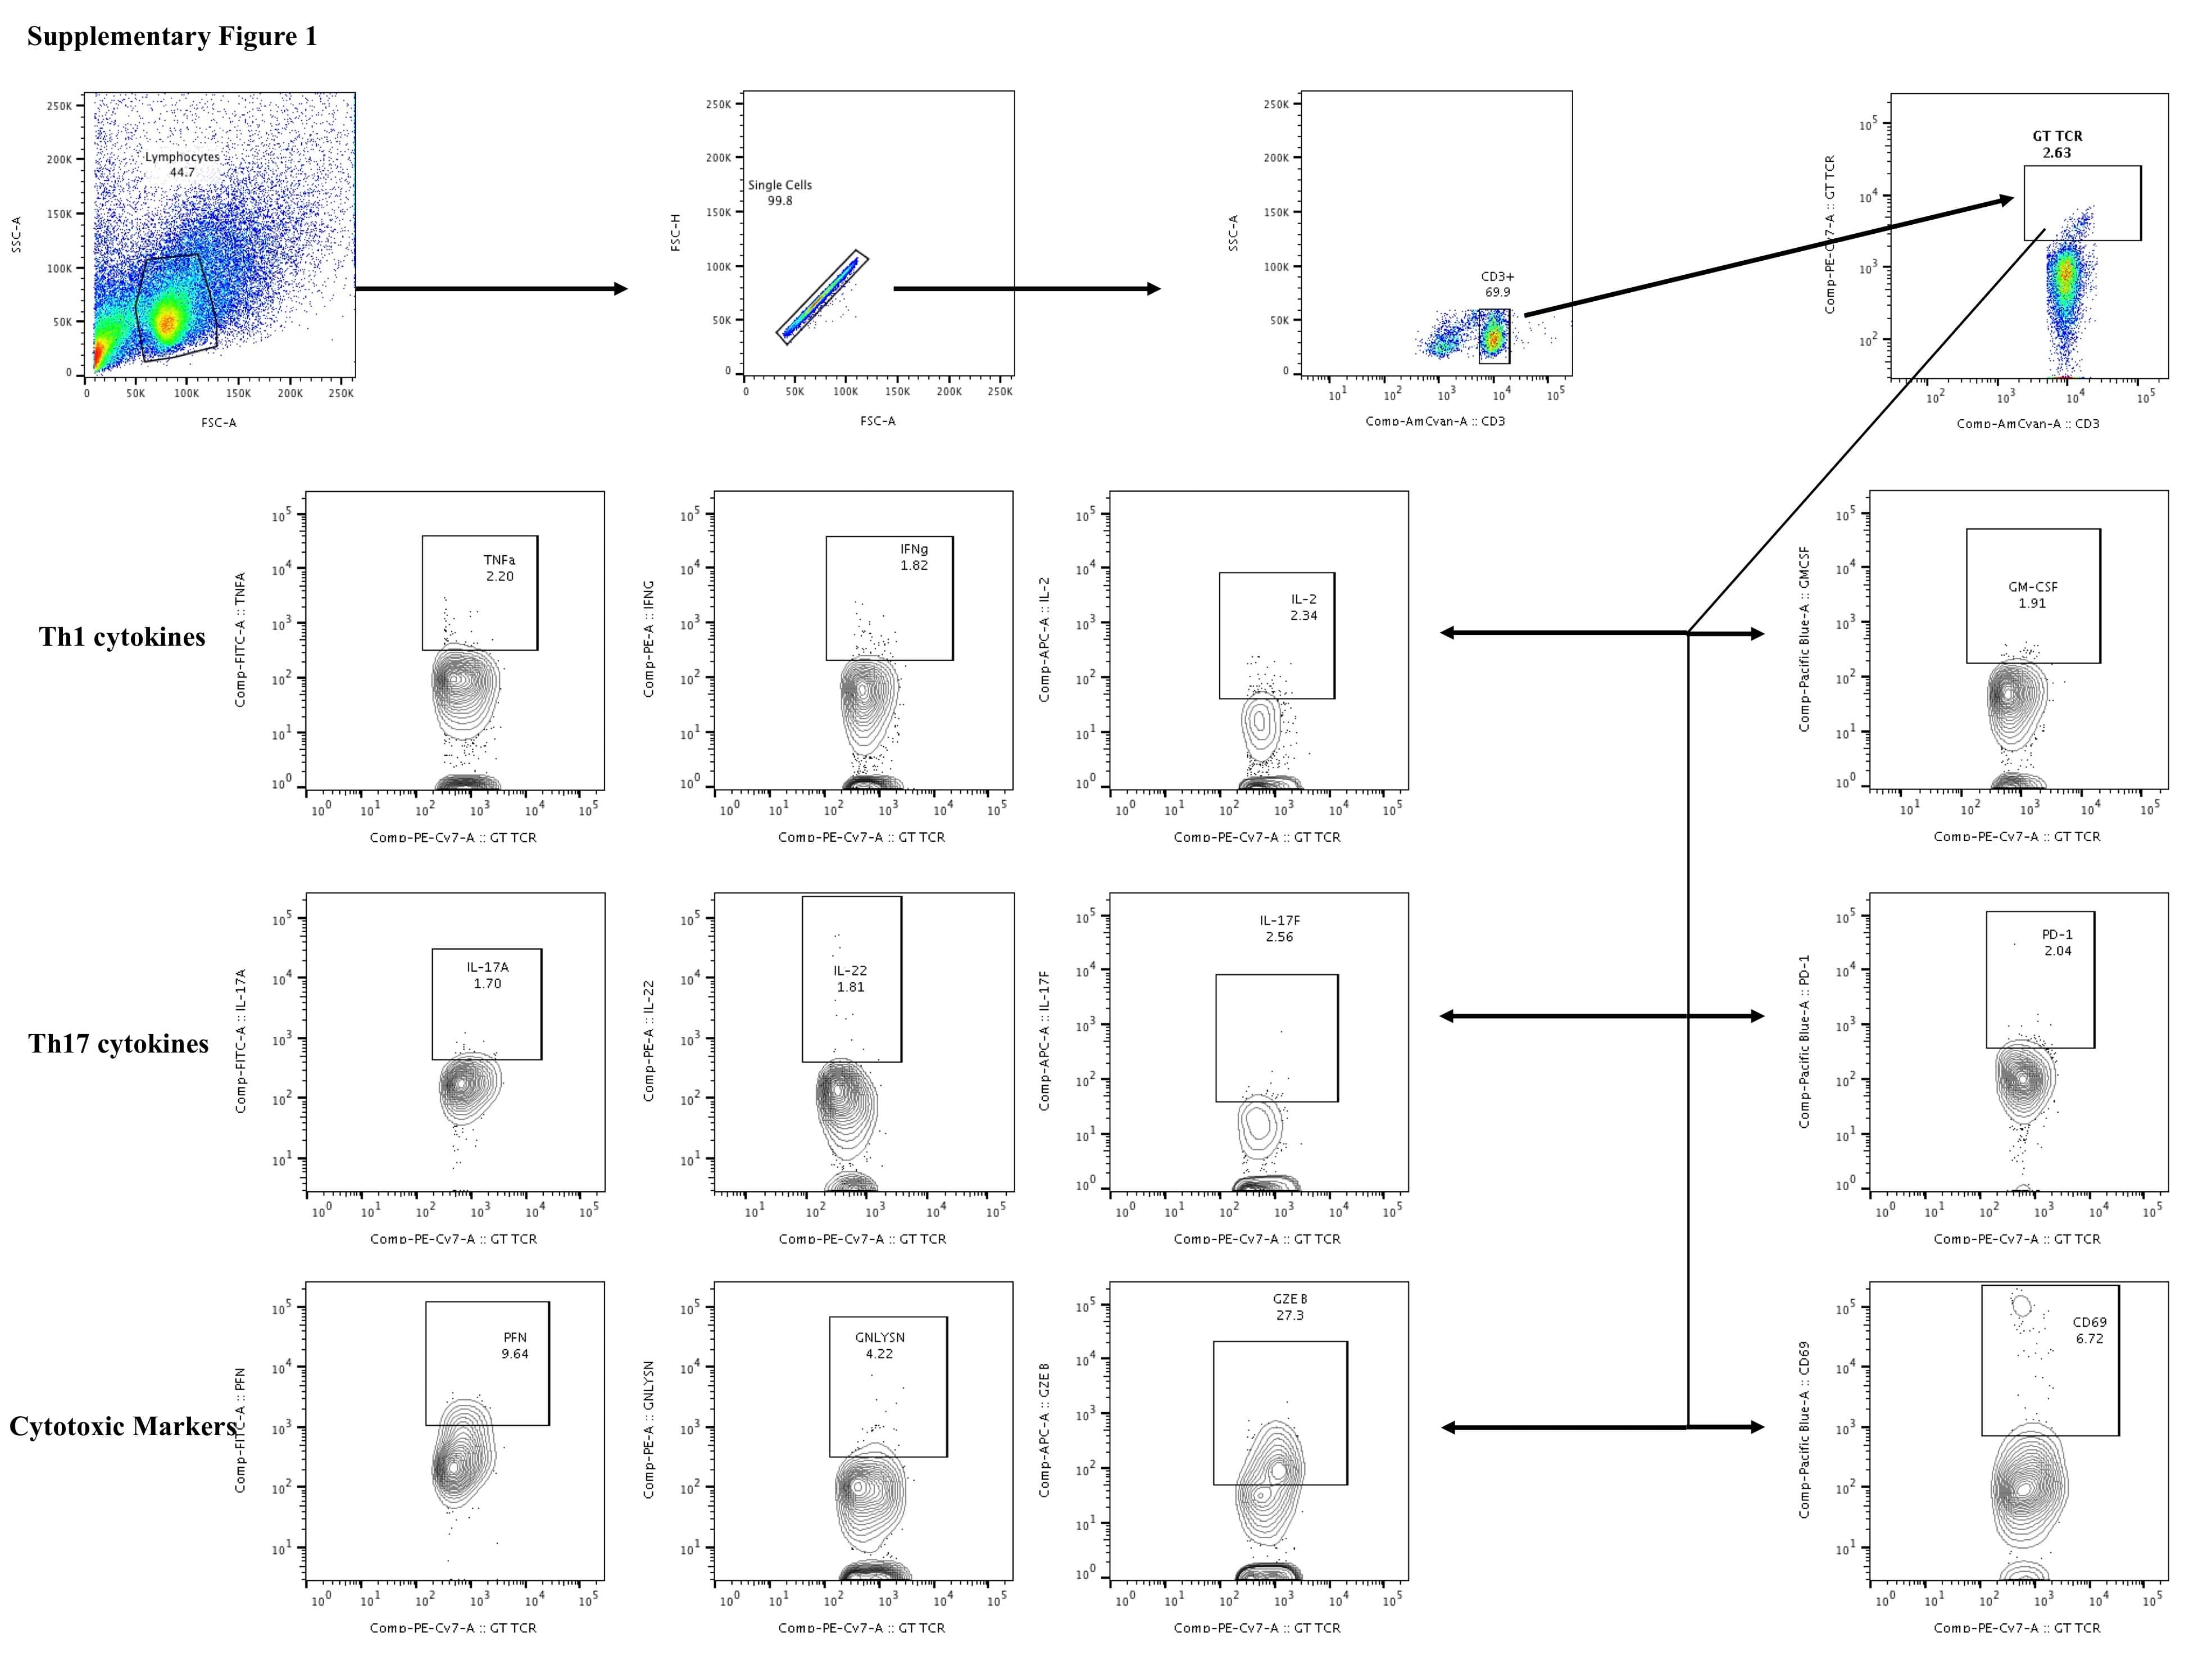
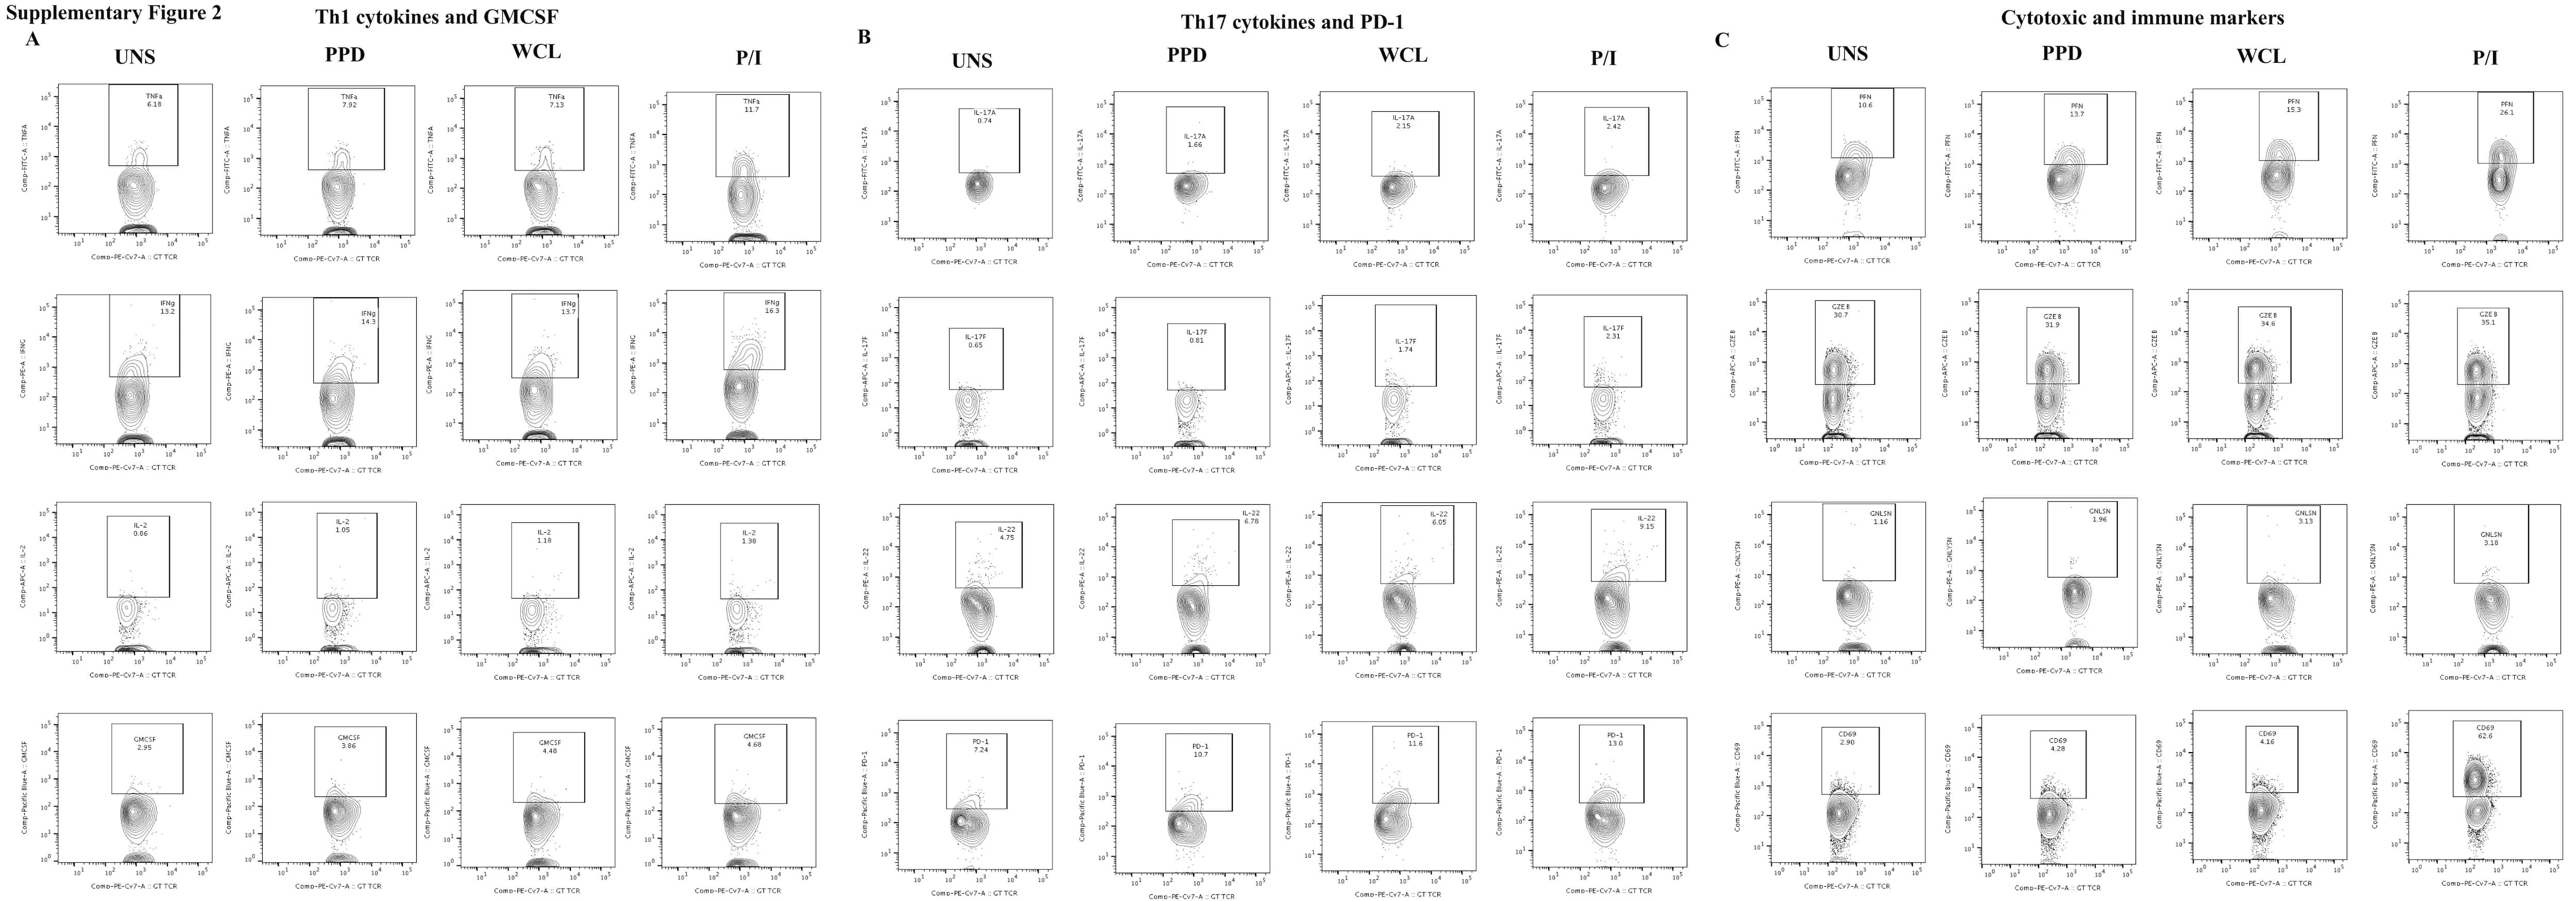
Decreased Frequencies of Gamma/Delta T Cells Expressing Th1/Th17 Cytokine, Cytotoxic, and Immune Markers in Latent Tuberculosis-Diabetes/Pre-Diabetes Comorbidity.
Characterization of humoral and SARS-CoV-2 specific T cell responses in people living with HIV.
Platelets stimulate programmed death-ligand 1 expression by cancer cells: Inhibition by anti-platelet drugs.
NKD2 mediates stimulation-dependent ORAI1 trafficking to augment Ca(2+) entry in T cells.
Highly efficient multiplex human T cell engineering without double-strand breaks using Cas9 base editors.
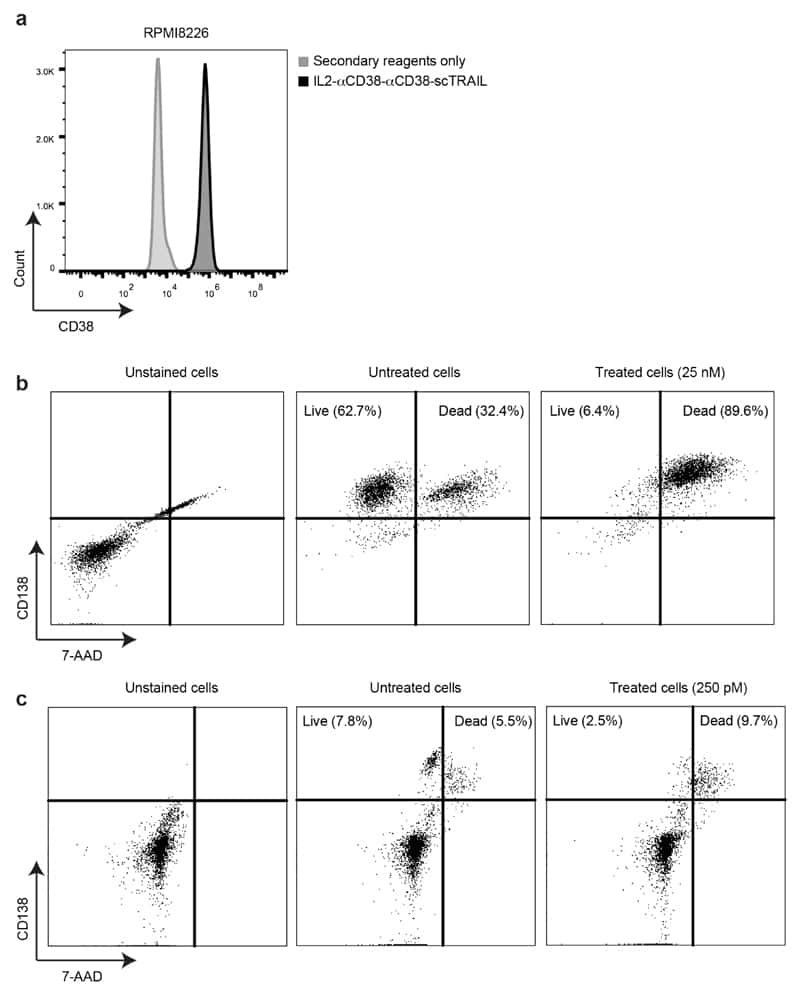
A novel dual-cytokine-antibody fusion protein for the treatment of CD38-positive malignancies.
PD-1(+) CD8(+) T cells are exhausted in tumours and functional in draining lymph nodes of colorectal cancer patients.
Expansion of polyfunctional HIV-specific T cells upon stimulation with mRNA electroporated dendritic cells in the presence of immunomodulatory drugs.
Human TCR transgenic Bet v 1-specific Th1 cells suppress the effector function of Bet v 1-specific Th2 cells.
Differential expression of CD300a/c on human TH1 and TH17 cells.
Bet v 1-specific T-cell receptor/forkhead box protein 3 transgenic T cells suppress Bet v 1-specific T-cell effector function in an activation-dependent manner.
Longevity and composition of cellular immune responses following experimental Plasmodium falciparum malaria infection in humans.
Human Th1 cells that express CD300a are polyfunctional and after stimulation up-regulate the T-box transcription factor eomesodermin.
Shared MHC class II-dependent melanoma ribosomal protein L8 identified by phage display.
Koerber N, Priller A, Yazici S, Bauer T, Cheng CC, Mijočević H, Wintersteller H, Jeske S, Vogel E, Feuerherd M, Tinnefeld K, Winter C, Ruland J, Gerhard M, Haller B, Christa C, Zelger O, Roggendorf H, Halle M, Erber J, Lingor P, Keppler O, Zehn D, Protzer U, Knolle PA
Nature communications 2022 Jan 10;13(1):153
Nature communications 2022 Jan 10;13(1):153
Decreased Frequencies of Gamma/Delta T Cells Expressing Th1/Th17 Cytokine, Cytotoxic, and Immune Markers in Latent Tuberculosis-Diabetes/Pre-Diabetes Comorbidity.
Kathamuthu GR, Kumar NP, Moideen K, Menon PA, Babu S
Frontiers in cellular and infection microbiology 2021;11:756854
Frontiers in cellular and infection microbiology 2021;11:756854
Characterization of humoral and SARS-CoV-2 specific T cell responses in people living with HIV.
Alrubayyi A, Gea-Mallorquí E, Touizer E, Hameiri-Bowen D, Kopycinski J, Charlton B, Fisher-Pearson N, Muir L, Rosa A, Roustan C, Earl C, Cherepanov P, Pellegrino P, Waters L, Burns F, Kinloch S, Dong T, Dorrell L, Rowland-Jones S, McCoy LE, Peppa D
Nature communications 2021 Oct 5;12(1):5839
Nature communications 2021 Oct 5;12(1):5839
Platelets stimulate programmed death-ligand 1 expression by cancer cells: Inhibition by anti-platelet drugs.
Asgari A, Lesyk G, Poitras E, Govindasamy N, Terry K, To R, Back V, Rudzinski JK, Lewis JD, Jurasz P
Journal of thrombosis and haemostasis : JTH 2021 Nov;19(11):2862-2872
Journal of thrombosis and haemostasis : JTH 2021 Nov;19(11):2862-2872
NKD2 mediates stimulation-dependent ORAI1 trafficking to augment Ca(2+) entry in T cells.
Wu B, Woo JS, Vila P, Jew M, Leung J, Sun Z, Srikanth S, Gwack Y
Cell reports 2021 Aug 24;36(8):109603
Cell reports 2021 Aug 24;36(8):109603
Highly efficient multiplex human T cell engineering without double-strand breaks using Cas9 base editors.
Webber BR, Lonetree CL, Kluesner MG, Johnson MJ, Pomeroy EJ, Diers MD, Lahr WS, Draper GM, Slipek NJ, Smeester BA, Lovendahl KN, McElroy AN, Gordon WR, Osborn MJ, Moriarity BS
Nature communications 2019 Nov 19;10(1):5222
Nature communications 2019 Nov 19;10(1):5222
A novel dual-cytokine-antibody fusion protein for the treatment of CD38-positive malignancies.
De Luca R, Kachel P, Kropivsek K, Snijder B, Manz MG, Neri D
Protein engineering, design & selection : PEDS 2018 May 1;31(5):173-179
Protein engineering, design & selection : PEDS 2018 May 1;31(5):173-179
PD-1(+) CD8(+) T cells are exhausted in tumours and functional in draining lymph nodes of colorectal cancer patients.
Wu X, Zhang H, Xing Q, Cui J, Li J, Li Y, Tan Y, Wang S
British journal of cancer 2014 Sep 23;111(7):1391-9
British journal of cancer 2014 Sep 23;111(7):1391-9
Expansion of polyfunctional HIV-specific T cells upon stimulation with mRNA electroporated dendritic cells in the presence of immunomodulatory drugs.
De Keersmaecker B, Allard SD, Lacor P, Schots R, Thielemans K, Aerts JL
Journal of virology 2012 Sep;86(17):9351-60
Journal of virology 2012 Sep;86(17):9351-60
Human TCR transgenic Bet v 1-specific Th1 cells suppress the effector function of Bet v 1-specific Th2 cells.
Neunkirchner A, Leb-Reichl VM, Schmetterer KG, Mutschlechner S, Kueng HJ, Haiderer D, Schuch K, Wallner M, Jahn-Schmid B, Bohle B, Pickl WF
Journal of immunology (Baltimore, Md. : 1950) 2011 Oct 15;187(8):4077-87
Journal of immunology (Baltimore, Md. : 1950) 2011 Oct 15;187(8):4077-87
Differential expression of CD300a/c on human TH1 and TH17 cells.
Simhadri VR, Mariano JL, Zhou Q, DeBell KE, Borrego F
BMC immunology 2011 Nov 2;12:62
BMC immunology 2011 Nov 2;12:62
Bet v 1-specific T-cell receptor/forkhead box protein 3 transgenic T cells suppress Bet v 1-specific T-cell effector function in an activation-dependent manner.
Schmetterer KG, Haiderer D, Leb-Reichl VM, Neunkirchner A, Jahn-Schmid B, Küng HJ, Schuch K, Steinberger P, Bohle B, Pickl WF
The Journal of allergy and clinical immunology 2011 Jan;127(1):238-45, 245.e1-3
The Journal of allergy and clinical immunology 2011 Jan;127(1):238-45, 245.e1-3
Longevity and composition of cellular immune responses following experimental Plasmodium falciparum malaria infection in humans.
Teirlinck AC, McCall MB, Roestenberg M, Scholzen A, Woestenenk R, de Mast Q, van der Ven AJ, Hermsen CC, Luty AJ, Sauerwein RW
PLoS pathogens 2011 Dec;7(12):e1002389
PLoS pathogens 2011 Dec;7(12):e1002389
Human Th1 cells that express CD300a are polyfunctional and after stimulation up-regulate the T-box transcription factor eomesodermin.
Narayanan S, Silva R, Peruzzi G, Alvarez Y, Simhadri VR, Debell K, Coligan JE, Borrego F
PloS one 2010 May 13;5(5):e10636
PloS one 2010 May 13;5(5):e10636
Shared MHC class II-dependent melanoma ribosomal protein L8 identified by phage display.
Swoboda RK, Somasundaram R, Caputo L, Ochoa EM, Gimotty PA, Marincola FM, Van Belle P, Barth S, Elder D, Guerry D, Czerniecki B, Schuchter L, Vonderheide RH, Herlyn D
Cancer research 2007 Apr 15;67(8):3555-9
Cancer research 2007 Apr 15;67(8):3555-9
No comments: Submit comment
Supportive validation
- Submitted by
- Invitrogen Antibodies (provider)
- Main image

- Experimental details
- NULL
- Submitted by
- Invitrogen Antibodies (provider)
- Main image
- Experimental details
- NULL
- Submitted by
- Invitrogen Antibodies (provider)
- Main image
- Experimental details
- NULL
- Submitted by
- Invitrogen Antibodies (provider)
- Main image
- Experimental details
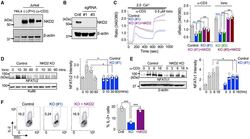
- Figure 1. NKD2 is involved in regulation of the Ca 2+ -NFAT signaling pathway in T cells (A) Representative immunoblot showing expression of NKD2 in lysates from HeLa cells, unstimulated Jurkat T cells, or those stimulated with PMA + ionomycin or anti-CD3 antibody (Ab) for 6 h. beta-Actin, loading control. Data are representative of two independent experiments. (B) Representative immunoblot showing expression of NKD2 in lysates of control or NKD2 knockout (KO) Jurkat T cells generated using two independent sgRNAs (#1 and #3). beta-Actin, loading control. Data are representative of two independent experiments. (C) Representative traces showing averaged SOCE from control (69 cells), NKD2 KO (KO sgRNA #1, 70 cells) Jurkat T cells, or NKD2 KO Jurkat T cells reconstituted for expression of NKD2 (KO sgRNA #1 + NKD2, 68 cells) after TCR stimulation using anti-CD3 antibodies, followed by ionomycin treatment in the presence of external solution containing 2 mM Ca 2+ . Bar graph (right) shows averaged baseline-subtracted SOCE (+-SEM) from three independent experiments with NKD2 KO cells generated using two independent sgRNAs (#1 and #3). (D) Representative immunoblot of NFATc2 levels in nuclear extracts from wild-type (WT) and NKD2 KO (sgRNA #1) Jurkat T cells stimulated with 1 muM ionomycin for indicated times. A nuclear protein, Ku86, was used as a loading control. Bar graph shows the densitometric analysis of relative band intensities of nuclear NFATc2. Data show means +- SEM of poo
- Submitted by
- Invitrogen Antibodies (provider)
- Main image

- Experimental details
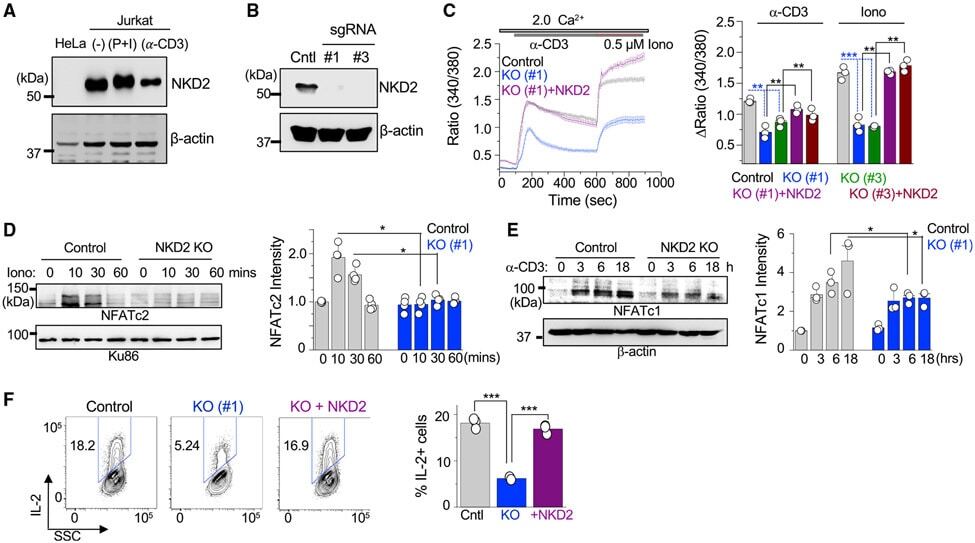
- Figure 6. NKD2-mediated ORAI1 + vesicle trafficking is crucial for the effector function of primary T cells (A) Representative histograms showing levels of NKD2 protein in primary T cells transduced with lentiviral vectors encoding scrambled sgRNA (control), NKD2 sgRNA #1, and NKD2 sgRNA #3, together with those encoding Cas9. Cells were permeabilized and stained with anti-NKD2 Ab. The bar graph (right) shows average (+-SEM) from four independent experiments. (B) Representative traces showing averaged SOCE from primary control (73 cells) and NKD2 KO (KO sgRNA #1, 82 cells; KO sgRNA #3, 71 cells) T cells after TCR stimulation using anti-CD3 Abs, followed by ionomycin treatment in the presence of external solution containing 2 mM Ca 2+ . Bar graph (right) shows averaged baseline-subtracted SOCE (+-SEM) from three independent experiments. (C) Representative histograms showing levels of newly inserted PM-resident ORAI1 protein in primary control and NKD2 KO effector T cells after TCR stimulation. Cells were transduced as described above to induce deletion of NKD2 and stimulated and stained as described in Figure 3B for detection of newly inserted PM-resident ORAI1. Bar graph (right) shows average (+-SEM) of pooled technical replicates from three independent donors. (D) Representative flow plots showing expression of IFN-gamma, IL-2, and TNF in control, NKD2 KO (sgRNA #1), and NKD2 KO (sgRNA #3) cells after re-stimulation with anti-CD3 and anti-CD28 Abs. Bar graph shows means +- SE
- Submitted by
- Invitrogen Antibodies (provider)
- Main image
- Experimental details
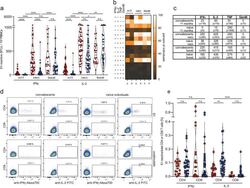
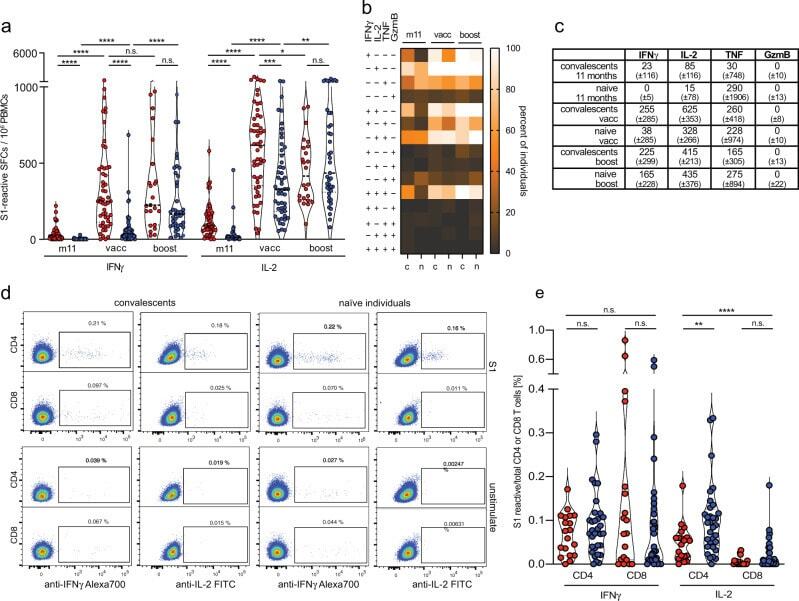
- Fig. 5 Rapid induction of polyfunctional IL-2-secreting T cells in convalescents and naive individuals after BNT162b2 mRNA vaccination. ( a ) frequencies of spike-reactive cytokine-secreting cells in convalescents (red, n = 50 (m11), n = 54 (vacc), n = 23 (boost)), and naive individuals (blue, n = 39 (m11), n = 49 (vacc), n = 40 (boost)) at month 11 after SARS-CoV-2 infection, two weeks after BNT162b2 mRNA prime vaccination (vacc) and 2 weeks after boost vaccination (boost). b Heatmap revealing frequencies of individuals bearing S1-reactive mono- or polyfunctional cytokine-secreting cells; convalescents (c), naive individuals (n). c Median and standard deviation for S1-reactive cytokine-secreting cells. d , e S1-reactive IL-2 and IFNgamma-producing CD4 and CD8 T cells in convalescents (red, n = 19) and naive individuals (blue, n = 31) determined directly ex vivo by flow cytometry using intracellular cytokine staining. Statistical analyses by ANOVA, two-sided Mann-Whitney and two-sided Wilcoxon signed-rank tests ( a , e ). n.s. denotes not significant; * p < 0.05; ** p < 0.01; **** p < 0.0001.
- Submitted by
- Invitrogen Antibodies (provider)
- Main image
- Experimental details
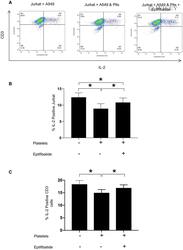
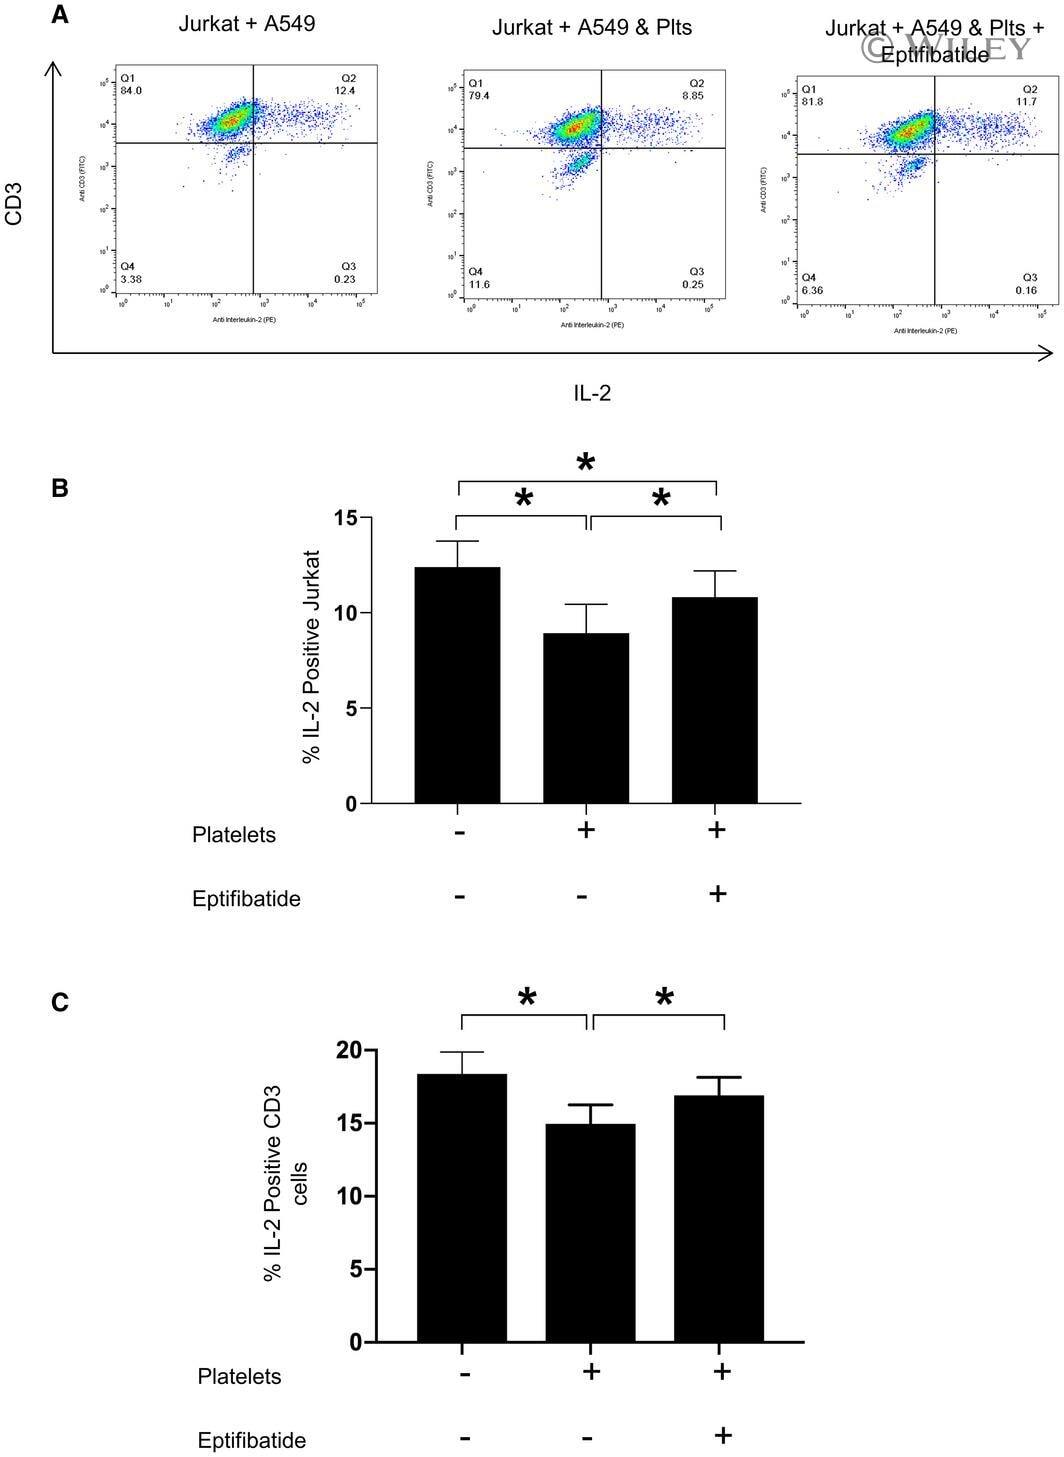
- 5 FIGURE Platelets suppress T-cell activation by A549 cell an effect reversed by eptifibatide. (A) Representative flow cytometry dot plots and (B) summary data demonstrating IL-2 expression in Jurkat cells after 6 h of co-culture with A549 cells that were pre-treated with/without platelets and eptifibitide (10 muM). N = 7. *, p -value
- Submitted by
- Invitrogen Antibodies (provider)
- Main image
- Experimental details
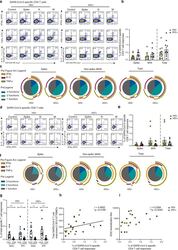
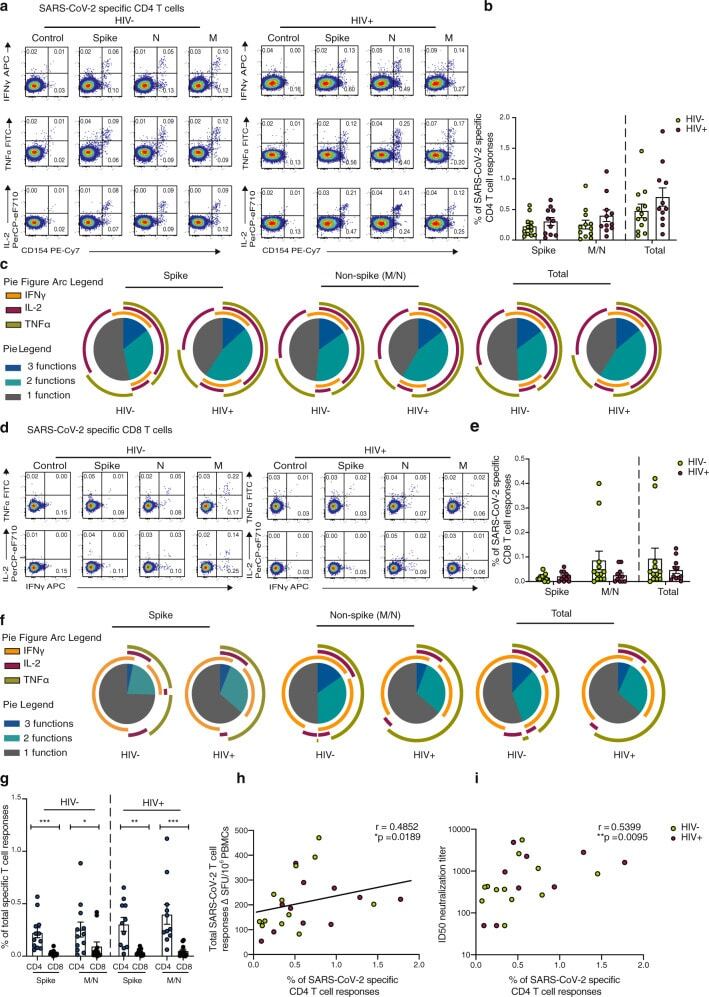
- Fig. 4 Composition of SARS-CoV-2-specific T cells in convalescent HIV-negative and HIV-positive individuals. Intracellular cytokine staining (ICS) was performed to detect cytokine-producing T cells to the indicated peptide pools in HIV-negative (HIV-, n = 12) and HIV-positive individuals (HIV+, n = 11). a Representative flow cytometric plots for the identification of antigen-specific CD4 T cells based on double expression (CD154 + IFN-gamma + , CD154 + IL-2 + , and CD154 + TNF-alpha + ) following 6-h stimulation with media alone (control) or overlapping SARS-CoV-2 peptides against Spike pool 1 and 2 (Spike), Nucleoprotein (N), and Membrane protein (M) directly ex vivo. b Frequency of aggregated CD4 T-cell responses (CD154 + IFN-gamma + , CD154 + IL-2 + , and CD154 + TNF-alpha + ) against Spike, M/N or combined (Spike and M/N) peptide pools (HIV-, n = 12; HIV+, n = 11). Error bars represent SEM. c Pie charts representing the relative proportions of Spike, M/N, or total (combined Spike and M/N) CD4 T-cell responses for one (gray), two (green) or three (dark blue) cytokines, and pie arcs denoting IFN-gamma, TNF-alpha and IL-2. d Representative flow cytometric plots for the identification of antigen-specific CD8 T cells based on the expression of (IFN-gamma + , TNF-alpha + , and IL-2 + ) against the specified peptide pools or media alone (control). e Proportion of aggregated CD8 T-cell responses against Spike, M/N or combined (Spike and M/N) responses in HIV- ( n = 12) and HIV+ (
- Submitted by
- Invitrogen Antibodies (provider)
- Main image

- Experimental details
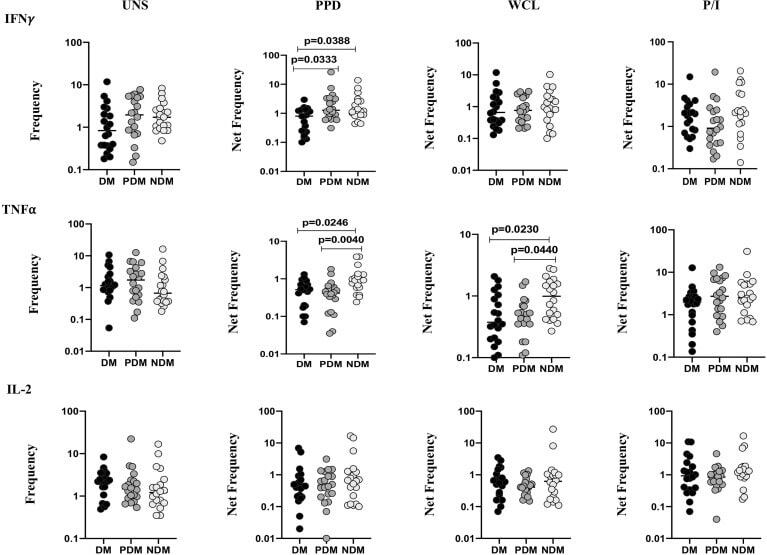
- Figure 1 Decreased frequencies of gammadelta T cells expressing Th1 cytokines in LTB comorbidities. Peripheral blood mononuclear cells (PBMCs) were either untreated or treated with Mtb or positive control antigens for 18 h. The absolute (unstimulated, UNS) and antigen-stimulated (PPD, WCL, P/I) net frequencies of Th1 (IFNgamma, IL-2, TNFalpha) cytokines were shown in LTB DM (n = 20), LTB PDM (n = 20), and LTB NDM (n = 20) groups. Geometric mean values were represented using bars, and every circle denotes a single individual. Kruskal-Wallis test with multiple Dunn's comparison was used to determine the p values.
- Submitted by
- Invitrogen Antibodies (provider)
- Main image

- Experimental details
- Fig. 4 Function of multiplex edited T cells. a Expression of the memory marker CD27 and CD45ro following editing and expansion. Production of cytokines individually ( b ) and in combination ( c ) by CD4 and CD8 T cells following activation. d Ability of T cells to kill CD19 neg K562, CD19 pos Raji cells, or CD19 pos/ PD-L1 pos Raji cells as measured by luciferase luminescence assay following co-culture with T cells. Graph titles indicate E:T ratio. Data represented as mean +- SD, with assays run in triplicate in n = 2 independent biological T-cell donors. P -values calculated by the Student's paired two-tailed t test (n.s. P > 0.05, * P
