Explore
 Validate
 Learn
Learn Western blot
Antibody data
- Antibody Data
- Antigen structure
- References [1]
- Comments [0]
- Validations
- Western blot [2]
- Chromatin Immunoprecipitation [1]
Submit
Validation data
Reference
Comment
Report error
- Product number
- 44-992G - Provider product page

- Provider
- Invitrogen Antibodies
- Product name
- Phospho-PKA beta (Ser338) Polyclonal Antibody
- Antibody type
- Polyclonal
- Antigen
- Synthetic peptide
- Description
- 44-992G has been used successfully in the ChIP analysis of PKA beta pS338.
- Reactivity
- Human, Mouse
- Host
- Rabbit
- Isotype
- IgG
- Vial size
- 100 µL
- Storage
- -20°C
Submitted references Molecular Basis for Ser/Thr Specificity in PKA Signaling.
Knape MJ, Wallbott M, Burghardt NCG, Bertinetti D, Hornung J, Schmidt SH, Lorenz R, Herberg FW
Cells 2020 Jun 25;9(6)
Cells 2020 Jun 25;9(6)
No comments: Submit comment
Supportive validation
- Submitted by
- Invitrogen Antibodies (provider)
- Main image
- Experimental details
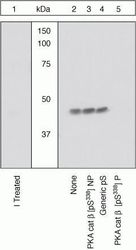
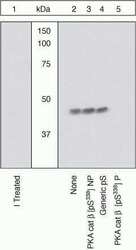
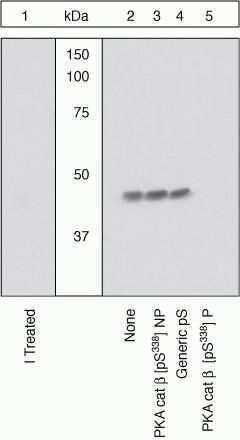
- Peptide Competition. Lysates prepared from 3T3-L1 cells were resolved by SDS-PAGE on a 10% polyacrylamide gel and transferred to PVDF. Membranes were either treated with lambda phosphatase (1) or left untreated (2-5), blocked with a 5% BSA-TBST buffer for two hours at room temperature, and incubated with PKA cat beta (pS338) antibody for two hours at room temperature in a 3% BSA-TBST buffer, following prior incubation with: no peptide (1, 2), the non-phosphopeptide corresponding to the immunogen (3), a generic phosphoserine-containing peptide (4), or, the phosphopeptide immunogen (5). After washing, membranes were incubated with goat F (ab’)2 anti-rabbit IgG HRP-conjugate (Product # ALI4404) and bands were detected using the Pierce SuperSignal™ method. The data show that the peptide corresponding to PKA cat beta (pS338) blocks the antibody signal, thereby verifying the specificity of the antibody. The data also show that phosphatase stripping eliminates the signal, verifying that the antibody is phospho-specific.
- Submitted by
- Invitrogen Antibodies (provider)
- Main image
- Experimental details
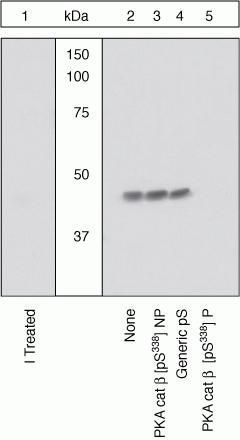
- Peptide Competition. Lysates prepared from 3T3-L1 cells were resolved by SDS-PAGE on a 10% polyacrylamide gel and transferred to PVDF. Membranes were either treated with lambda phosphatase (1) or left untreated (2-5), blocked with a 5% BSA-TBST buffer for two hours at room temperature, and incubated with PKA cat beta (pS338) antibody for two hours at room temperature in a 3% BSA-TBST buffer, following prior incubation with: no peptide (1, 2), the non-phosphopeptide corresponding to the immunogen (3), a generic phosphoserine-containing peptide (4), or, the phosphopeptide immunogen (5). After washing, membranes were incubated with goat F (ab’)2 anti-rabbit IgG HRP-conjugate (Product # ALI4404) and bands were detected using the Pierce SuperSignal™ method. The data show that the peptide corresponding to PKA cat beta (pS338) blocks the antibody signal, thereby verifying the specificity of the antibody. The data also show that phosphatase stripping eliminates the signal, verifying that the antibody is phospho-specific.
Supportive validation
- Submitted by
- Invitrogen Antibodies (provider)
- Main image
- Experimental details
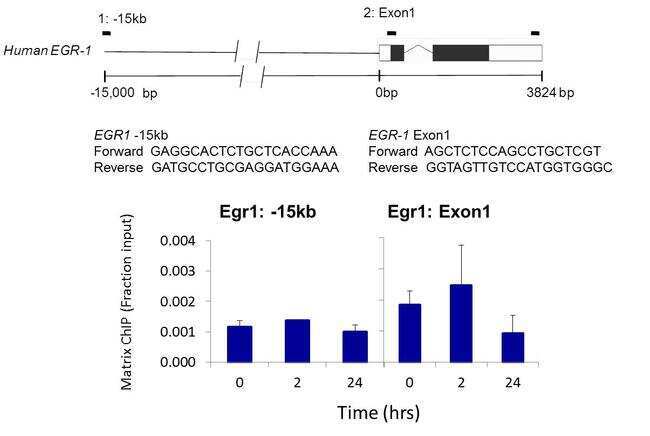
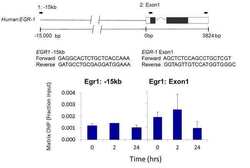
- Chromatin immunoprecipitation analysis was performed using cross-linked chromatin from Human 5A8 J-lat T lymphocytes culture treated with 10 µg/mL PHA (phytohemaglutin) for 0, 2, and 24 hours. Immunoprecipitation was performed using a multiplex microplate Matrix ChIP assay (see reference for Matrix ChIP protocol: http://www.ncbi.nlm.nih.gov/pubmed/22098709) with 1.0 µL/100 µL well volume of a phosph-PKA beta pSer338 rabbit polyclonal antibody (Product # 44-992G). Chromatin aliquots from ~10,000 cells were used per ChIP pull-down. Quantitative PCR data were done in quadruplicate using 1 µL of eluted DNA in 2 µL SYBR real-time PCR reactions containing primers shown to amplify -15kb and exon-1 of the EGR1 gene. PCR calibration curves were generated for each primer pair from a dilution series of sheared total genomic DNA. Quantitation of immunoprecipitated chromatin is presented as signal relative to the total amount of input chromatin. Results represent the mean +/- SEM for three experiments. Schematic representations of the EGR-1 locus are shown above the data where boxes represent exons (black boxes = translated regions, white boxes = untranslated regions), the zigzag line represents an intron, and the straight line represents upstream sequence. Regions amplified by the primers are represented by black bars. Data courtesy of Dr. Karol Bomsztyk at the University of Washington, Seattle, WA.