 Explore
 Validate
 Learn
Learn Western blot
 Immunohistochemistry
Antibody data
- Antibody Data
- Antigen structure
- References [2]
- Comments [0]
- Validations
- Immunohistochemistry [1]
- Flow cytometry [2]
- Other assay [4]
Submit
Validation data
Reference
Comment
Report error
- Product number
- PA5-24602 - Provider product page

- Provider
- Invitrogen Antibodies
- Product name
- CYP26A1 Polyclonal Antibody
- Antibody type
- Polyclonal
- Antigen
- Synthetic peptide
- Reactivity
- Human, Mouse
- Host
- Rabbit
- Isotype
- IgG
- Vial size
- 400 μL
- Concentration
- 2 mg/mL
- Storage
- Store at 4°C short term. For long term storage, store at -20°C, avoiding freeze/thaw cycles.
Submitted references Cytochrome P450 26A1 Modulates the Polarization of Uterine Macrophages During the Peri-Implantation Period.
A novel Cytochrome P450 26A1 expressing NK cell subset at the mouse maternal-foetal interface.
Ji WH, Li DD, Wei DP, Gu AQ, Yang Y, Peng JP
Frontiers in immunology 2021;12:763067
Frontiers in immunology 2021;12:763067
A novel Cytochrome P450 26A1 expressing NK cell subset at the mouse maternal-foetal interface.
Wei DP, Li DD, Gu AQ, Ji WH, Yang Y, Peng JP
Journal of cellular and molecular medicine 2021 Feb;25(3):1771-1782
Journal of cellular and molecular medicine 2021 Feb;25(3):1771-1782
No comments: Submit comment
Supportive validation
- Submitted by
- Invitrogen Antibodies (provider)
- Main image
- Experimental details
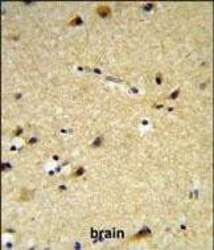
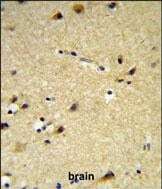
- Immunohistochemistry analysis of CYP26A1 in formalin fixed and paraffin embedded brain tissue. Samples were incubated with CYP26A1 polyclonal antibody (Product # PA5-24602) followed by peroxidase conjugation of the secondary antibody and DAB staining. This data demonstrates the use of this antibody for immunohistochemistry. Clinical relevance has not been evaluated.
Supportive validation
- Submitted by
- Invitrogen Antibodies (provider)
- Main image

- Experimental details
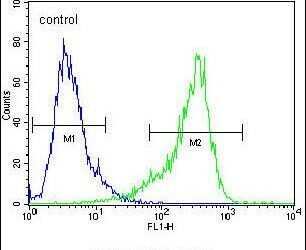
- Flow cytometry analysis of NIH-3T3 cells using a CYP26A1 polyclonal antibody (Product # PA5-24602) (right) compared to a negative control cell (left) at a dilution of 1:10-50, followed by a FITC-conjugated goat anti-rabbit antibody
- Submitted by
- Invitrogen Antibodies (provider)
- Main image
- Experimental details
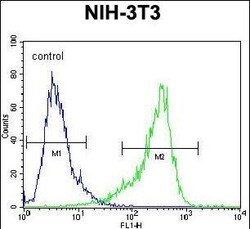
- Flow cytometry of CYP26A1 in NIH-3T3 cells (right histogram). Samples were incubated with CYP26A1 polyclonal antibody (Product # PA5-24602) followed by FITC-conjugated goat-anti-rabbit secondary antibody. Negative control cell (left histogram).

Supportive validation
- Submitted by
- Invitrogen Antibodies (provider)
- Main image
- Experimental details
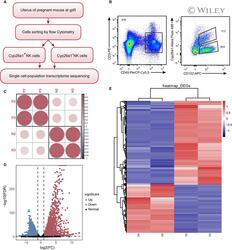
- 3 FIGURE Transcriptome sequencing and differentially expressed gene analysis (A) Flow chart of transcriptome sequencing. (B). Flow cytometric sorting diagram of transcriptome sequencing samples, Cyp26a1 + NK cells (CD45 + CD3 - CD122 + Cyp26a1 + ) and Cyp26a1 - NK cells (CD45 + CD3 - CD122 + Cyp26a1 - ) were isolated from the mouse uterus on gd5. (C) Sample consistency analysis graph, 'P2 and P3' represented Cyp26a1 + NK cells and 'N2 and N3' represented Cyp26a1 - NK cells in the C, D and E. (D) Volcano plot map. (E) Hierarchical clustering demonstrating a distinguishable gene expression pattern between Cyp26a1 + NK cells and Cyp26a1 - NK cells

- Submitted by
- Invitrogen Antibodies (provider)
- Main image
- Experimental details
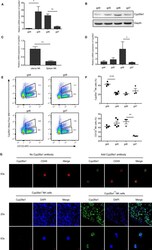
- FIGURE 1 Expression of Cyp26a1 in mouse uterine tissue and uterine NK cells during the peri-implantation period. (A) qPCR to detect the expression of Cyp26a1 on gd4-gd7 uterine tissue. (B) Western blotting to detect the expression of Cyp26a1 on gd4-gd7 uterine tissue. (C) qPCR to detect the expression of Cyp26a1 in CD45 + CD3 - CD122 + NK cells isolated from the uterus and spleen on gd5. (D) qPCR to detect the expression of Cyp26a1 in CD45 + CD3 - CD122 + NK cells isolated from the uterus on gd4-gd7. (E) Representative graph of flow cytometric assays to detect CD45 + CD3 - CD122 + Cyp26a1 + NK cells in the uterus on gd4-gd7, the marker molecules were as follows: CD3-PE, CD45-PerCP-Cy5.5, CD122-APC and Cyp26a1-Alexa Fluor 488, The cells under gate CD45 + CD3 - shown in the figure. (F) Percentages of Cyp26a1 + NK cells in gated CD45 + CD3 - CD122 + NK and CD122 + NK cells in gated CD45 + CD3 - cells in the uterus on gd4-gd7. (G) Upper picture: immunofluorescence detection of Cyp26a1 expression in CD45 + CD3 - CD122 + NK cells isolated from the uterus on gd5 (63 x objective); lower picture: confocal photography of Cyp26a1 + NK cells and Cyp26a1 - NK cells isolated from the uterus on gd5 (20 x and 63 x objective). Data were means +- SEM from three biological replicates, *represents P < .05, **represents P < .01 (two-tailed unpaired Student's t test) (A and C). Data were representative of two (A, B and C) or three (E, F and G) independent experiments

- Submitted by
- Invitrogen Antibodies (provider)
- Main image
- Experimental details
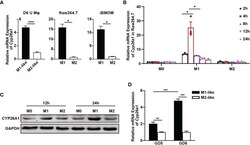
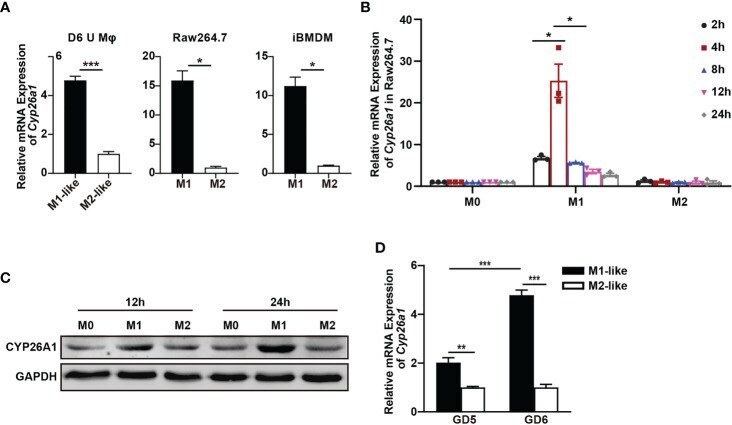
- Figure 2 Differential expression of Cyp26a1 in M1 and M2 macrophages. (A) qPCR analysis of Cyp26a1 in M1 and M2 of GD6 uterine macrophages (D6 U Mphi), Raw264.7 and iBMDM (n=3). (B) qPCR analysis of Cyp26a1 in M0, M1 and M2 macrophages of Raw264.7 at different induction time (LPS (100 ng/mL) + IFN-gamma(20 ng/mL); 2 h, 4 h, 8 h, 12 h and 24 h; n=3). (C) Protein expression of CYP26A1 in M0, M1, M2 macrophages of Raw264.7 at different induction time (12 h and 24 h) was analyzed by Western blot. GAPDH was used as loading control. (D) qPCR analysis of Cyp26a1 in M1-like and M2-like uterine macrophages of GD5 and GD6 (n=3). Error bars represent means +- SEM; two-tailed unpaired t-test, ns, not significant, *P < 0.05, **P < 0.01, or ***P < 0.001.
- Submitted by
- Invitrogen Antibodies (provider)
- Main image
- Experimental details
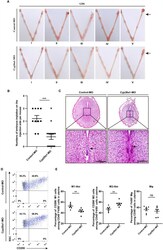
- Figure 3 Knockdown of CYP26A1 in uterus affects embryo implantation and the balance of uterine M1-like and M2-like macrophages. (A) Representative macroscopic views of the uterus injected with Control-MO or Cyp26a1-MO. Arrows indicates the injection site. (B) Statistics of embryo implantation sites on the MO-injection side (Control-MO, n=10; Cyp26a1-MO, n=17). (C) H&E staining of tissue sections at the implantation sites. Scale bar, 100 um. Arrows indicates the implantation sites. (D, E) FCM analysis of the ratio of uterine M1-like and M2-like macrophages on the MO-injection side (n=7). Error bars represent means +- SEM; two-tailed unpaired t-test, ns, not significant, **P < 0.01 or ***P < 0.001.
