 Explore
 Validate
 Learn
Learn Immunocytochemistry
Antibody data
- Antibody Data
- Antigen structure
- References [45]
- Comments [0]
- Validations
- Immunocytochemistry [4]
- Immunohistochemistry [1]
- Flow cytometry [2]
- Other assay [32]
Submit
Validation data
Reference
Comment
Report error
- Product number
- 14-0199-82 - Provider product page

- Provider
- Invitrogen Antibodies
- Product name
- CD19 Monoclonal Antibody (HIB19), eBioscience™
- Antibody type
- Monoclonal
- Antigen
- Other
- Description
- Description: The HIB19 monoclonal antibody reacts with human CD19, a 95 kDa transmembrane glycoprotein. CD19 is expressed by B cells during all stages of development excluding the terminally differentiated plasma cells. Follicular dendritic cells also express CD19. Together CD21, CD81, Leu13, MHC class II, and CD19 form a multimolecular complex that associates with BCR. Signaling through CD19 induces tyrosine phosphorylation, calcium flux and proliferation of B cells. The SJ25C1 antibody and the HIB19 monoclonal antibody recognize overlapping epitopes. Applications Reported: The HIB19 antibody has been reported for use in flow cytometric analysis, and immunohistochemical staining of frozen tissue sections. It has also been reported in in vitro functional studies. (Please use Functional Grade Purified HIB19, Product # 16-0199, in functional assays. Fluorochrome-conjugated HIB19 is recommended for use in flow cytometry). Applications Tested: This HIB19 antibody has been tested by flow cytometric analysis of normal human peripheral blood cells. This can be used at less than or equal to 1 µg per test. A test is defined as the amount (µg) of antibody that will stain a cell sample in a final volume of 100 µL. Cell number should be determined empirically but can range from 10^5 to 10^8 cells/test. It is recommended that the antibody be carefully titrated for optimal performance in the assay of interest. Purity: Greater than 90%, as determined by SDS-PAGE. Aggregation: Less than 10%, as determined by HPLC. Filtration: 0.2 µm post-manufacturing filtered.
- Reactivity
- Human, Mouse
- Host
- Mouse
- Isotype
- IgG
- Antibody clone number
- HIB19
- Vial size
- 100 μg
- Concentration
- 0.5 mg/mL
- Storage
- 4°C
Submitted references Decoding the pathogenesis of Diamond-Blackfan anemia using single-cell RNA-seq.
Exosomes derived from stem cells of human deciduous exfoliated teeth inhibit angiogenesis in vivo and in vitro via the transfer of miR-100-5p and miR-1246.
Increased TNF-α Initiates Cytoplasmic Vacuolization in Whole Blood Coculture with Dengue Virus.
SARS-CoV-2 infection paralyzes cytotoxic and metabolic functions of the immune cells.
Th2 Biased Immunity With Altered B Cell Profiles in Circulation of Patients With Sporotrichosis Caused by Sporothrix globosa.
Human T Cells Expressing a CD19 CAR-T Receptor Provide Insights into Mechanisms of Human CD19-Positive β Cell Destruction.
T cell-intrinsic role for Nod2 in protection against Th17-mediated uveitis.
The Act1 D10N missense variant impairs CD40 signaling in human B-cells.
Immune Checkpoint Inhibitor-induced Reinvigoration of Tumor-infiltrating CD8(+) T Cells is Determined by Their Differentiation Status in Glioblastoma.
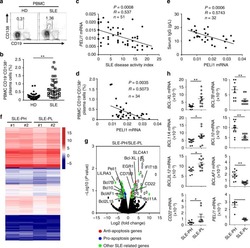
Peli1 negatively regulates noncanonical NF-κB signaling to restrain systemic lupus erythematosus.
A Human IPS Model Implicates Embryonic B-Myeloid Fate Restriction as Developmental Susceptibility to B Acute Lymphoblastic Leukemia-Associated ETV6-RUNX1.
Spontaneous development of Epstein-Barr Virus associated human lymphomas in a prostate cancer xenograft program.
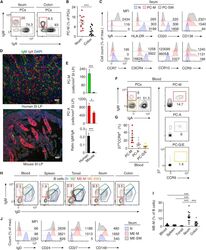
Human Secretory IgM Emerges from Plasma Cells Clonally Related to Gut Memory B Cells and Targets Highly Diverse Commensals.
A Member of the Nuclear Receptor Superfamily, Designated as NR2F2, Supports the Self-Renewal Capacity and Pluripotency of Human Bone Marrow-Derived Mesenchymal Stem Cells.
The Effect of Chronic Hepatitis B Virus Infection on BDCA3+ Dendritic Cell Frequency and Function.
Chimeric antigen receptor-engineered cytokine-induced killer cells overcome treatment resistance of pre-B-cell acute lymphoblastic leukemia and enhance survival.
Efficient generation of antigen-specific CTLs by the BAFF-activated human B Lymphocytes as APCs: a novel approach for immunotherapy.
IL-10+ Innate-like B Cells Are Part of the Skin Immune System and Require α4β1 Integrin To Migrate between the Peritoneum and Inflamed Skin.
Medial HOXA genes demarcate haematopoietic stem cell fate during human development.
CD19 CAR immune pressure induces B-precursor acute lymphoblastic leukaemia lineage switch exposing inherent leukaemic plasticity.
Tissue factor expression by myeloid cells contributes to protective immune response against Mycobacterium tuberculosis infection.
MIF Plays a Key Role in Regulating Tissue-Specific Chondro-Osteogenic Differentiation Fate of Human Cartilage Endplate Stem Cells under Hypoxia.
A cell-based systems biology assessment of human blood to monitor immune responses after influenza vaccination.
dNP2 is a blood-brain barrier-permeable peptide enabling ctCTLA-4 protein delivery to ameliorate experimental autoimmune encephalomyelitis.
Transcriptional repressor ZEB2 promotes terminal differentiation of CD8+ effector and memory T cell populations during infection.
Brief Report: IFIH1 Mutation Causes Systemic Lupus Erythematosus With Selective IgA Deficiency.
Thymic HIV-2 infection uncovers posttranscriptional control of viral replication in human thymocytes.
Induction of type I and type III interferons by Borrelia burgdorferi correlates with pathogenesis and requires linear plasmid 36.
Regulatory B cells are numerically but not functionally deficient in anti-neutrophil cytoplasm antibody-associated vasculitis.
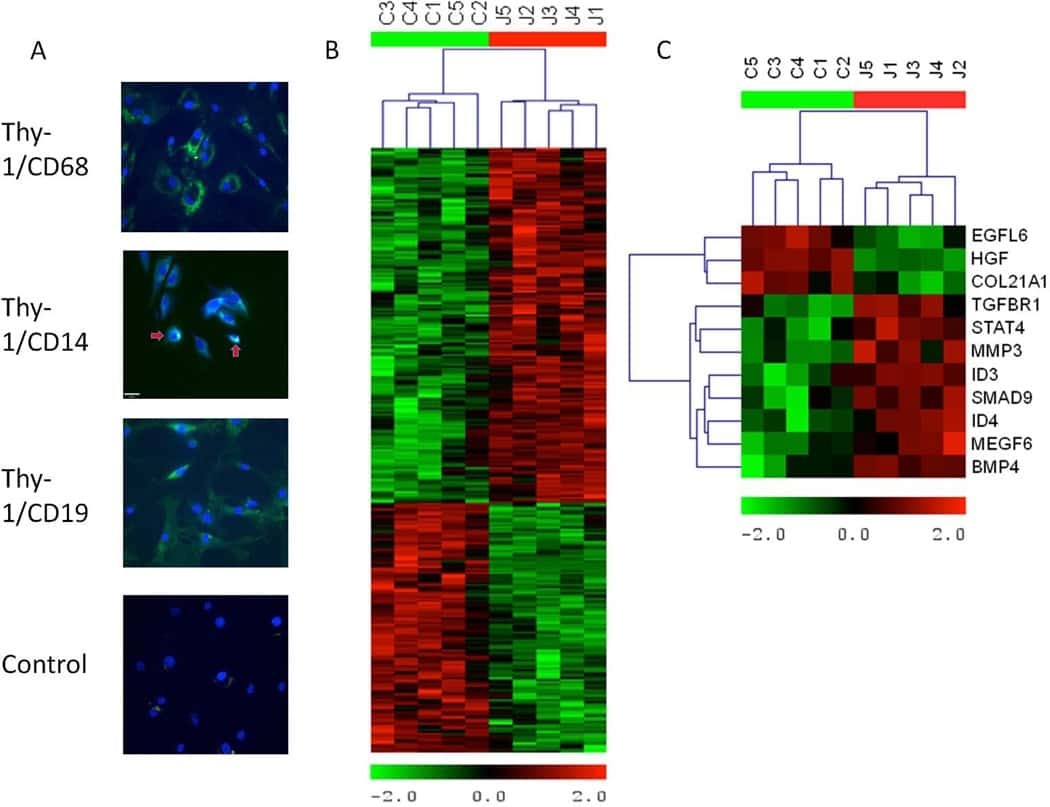
The role of transforming growth factor β signaling in fibroblast-like synoviocytes from patients with oligoarticular juvenile idiopathic arthritis: dysregulation of transforming growth factor β signaling, including overexpression of bone morphogenetic protein 4, may lead to a chondrocyte phenotype and may contribute to bony hypertrophy.
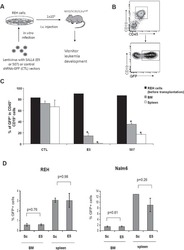
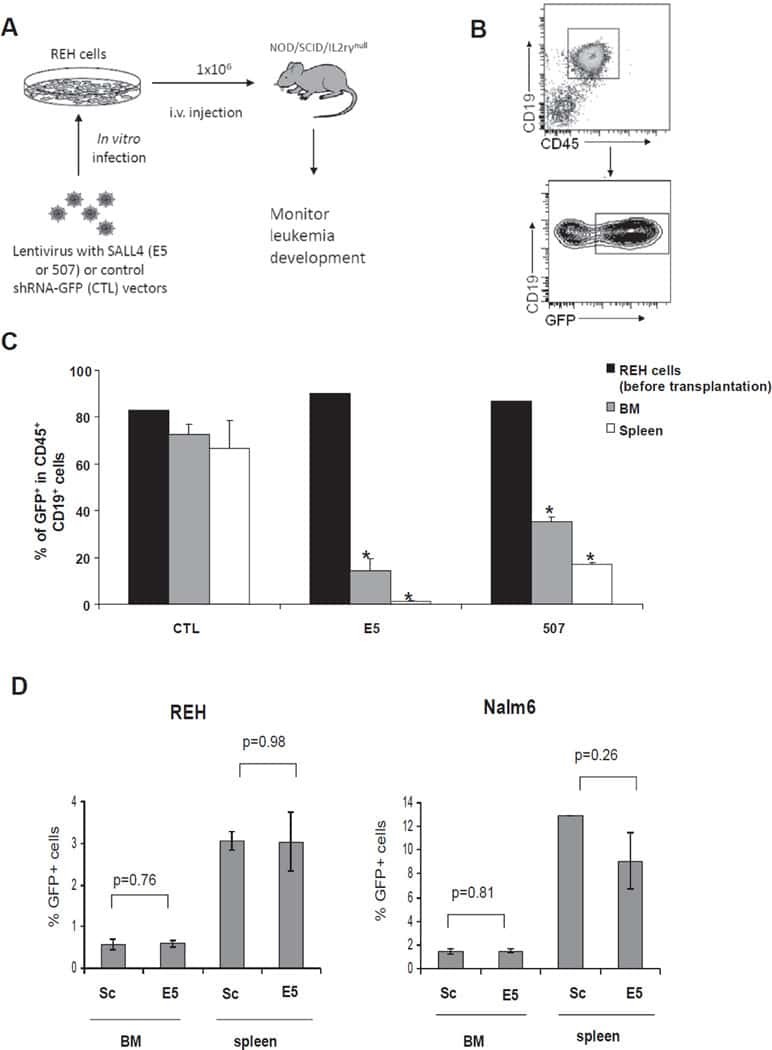
Aberrant expression of SALL4 in acute B cell lymphoblastic leukemia: mechanism, function, and implication for a potential novel therapeutic target.
Novel immunomodulators from hard ticks selectively reprogramme human dendritic cell responses.
Replication and meta-analysis of GWAS identified susceptibility loci in Kawasaki disease confirm the importance of B lymphoid tyrosine kinase (BLK) in disease susceptibility.
Comparative study of the cytokine/chemokine response in children with differing disease severity in enterovirus 71-induced hand, foot, and mouth disease.
Lipoxin A4 regulates natural killer cell and type 2 innate lymphoid cell activation in asthma.
Cytomegalovirus-specific T-cell reactivity in biliary atresia at the time of diagnosis is associated with deficits in regulatory T cells.
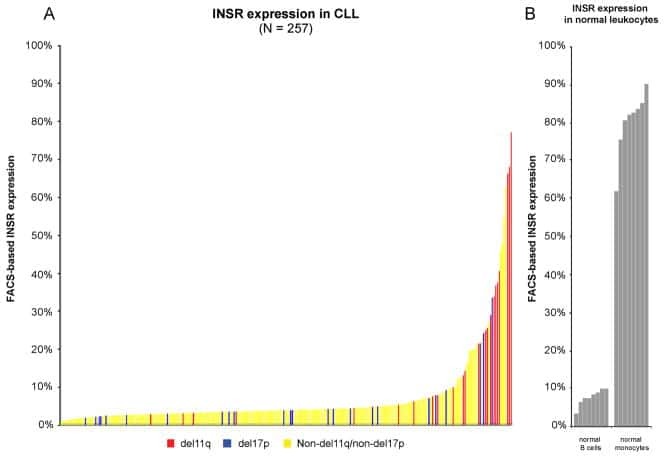
A pathobiological role of the insulin receptor in chronic lymphocytic leukemia.
Generation of bivalent chromatin domains during cell fate decisions.
Suppression of B-cell lymphomagenesis by the BH3-only proteins Bmf and Bad.
Role played by the programmed death-1-programmed death ligand pathway during innate immunity against Mycobacterium tuberculosis.
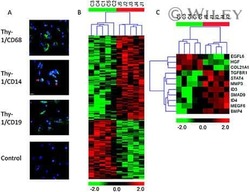
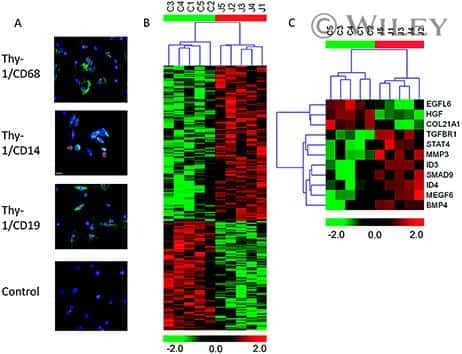
Identification of markers that distinguish monocyte-derived fibrocytes from monocytes, macrophages, and fibroblasts.
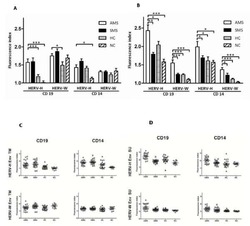
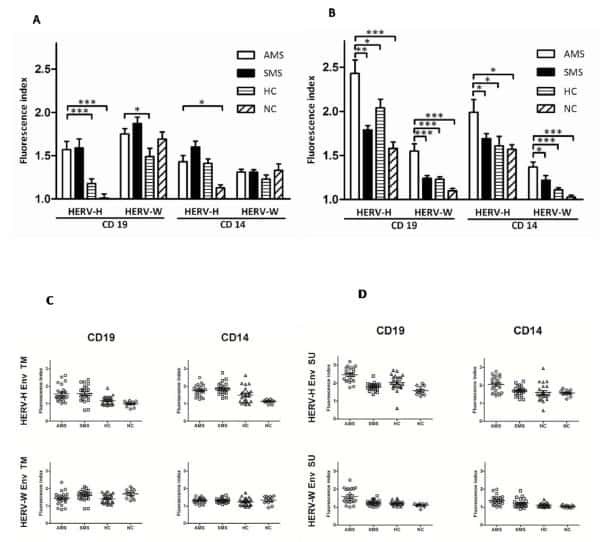
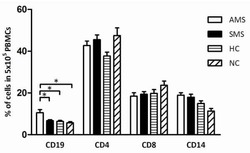
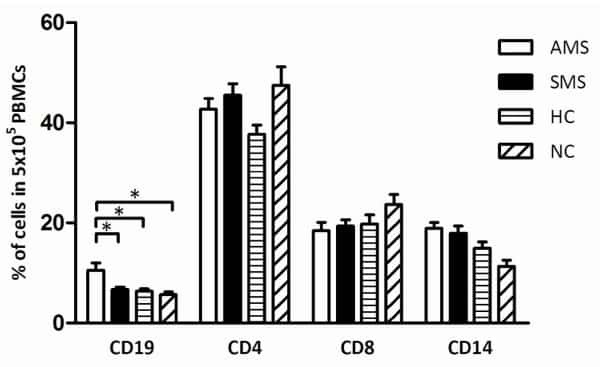
B cells and monocytes from patients with active multiple sclerosis exhibit increased surface expression of both HERV-H Env and HERV-W Env, accompanied by increased seroreactivity.
Improved serum-free culture conditions for the differentiation of human and murine fibrocytes.
Lung dendritic cell expression of maturation molecules increases with worsening chronic obstructive pulmonary disease.
Sepsis-induced human lymphocyte apoptosis and cytokine production in "humanized" mice.
Wang B, Wang C, Wan Y, Gao J, Ma Y, Zhang Y, Tong J, Zhang Y, Liu J, Chang L, Xu C, Shen B, Chen Y, Jiang E, Kurita R, Nakamura Y, Lim KC, Engel JD, Zhou J, Cheng T, Zhu X, Zhu P, Shi L
Cell discovery 2022 May 10;8(1):41
Cell discovery 2022 May 10;8(1):41
Exosomes derived from stem cells of human deciduous exfoliated teeth inhibit angiogenesis in vivo and in vitro via the transfer of miR-100-5p and miR-1246.
Liu P, Zhang Q, Mi J, Wang S, Xu Q, Zhuang D, Chen W, Liu C, Zhang L, Guo J, Wu X
Stem cell research & therapy 2022 Mar 3;13(1):89
Stem cell research & therapy 2022 Mar 3;13(1):89
Increased TNF-α Initiates Cytoplasmic Vacuolization in Whole Blood Coculture with Dengue Virus.
Satria RD, Huang TW, Jhan MK, Shen TJ, Tseng PC, Wang YT, Yang ZY, Hsing CH, Lin CF
Journal of immunology research 2021;2021:6654617
Journal of immunology research 2021;2021:6654617
SARS-CoV-2 infection paralyzes cytotoxic and metabolic functions of the immune cells.
Singh Y, Trautwein C, Fendel R, Krickeberg N, Berezhnoy G, Bissinger R, Ossowski S, Salker MS, Casadei N, Riess O, Deutsche COVID-19 OMICS Initiate (DeCOI)
Heliyon 2021 Jun;7(6):e07147
Heliyon 2021 Jun;7(6):e07147
Th2 Biased Immunity With Altered B Cell Profiles in Circulation of Patients With Sporotrichosis Caused by Sporothrix globosa.
Zu J, Yao L, Song Y, Cui Y, Guan M, Chen R, Zhen Y, Li S
Frontiers in immunology 2020;11:570888
Frontiers in immunology 2020;11:570888
Human T Cells Expressing a CD19 CAR-T Receptor Provide Insights into Mechanisms of Human CD19-Positive β Cell Destruction.
Ma H, Jeppesen JF, Jaenisch R
Cell reports. Medicine 2020 Sep 22;1(6):100097
Cell reports. Medicine 2020 Sep 22;1(6):100097
T cell-intrinsic role for Nod2 in protection against Th17-mediated uveitis.
Napier RJ, Lee EJ, Davey MP, Vance EE, Furtado JM, Snow PE, Samson KA, Lashley SJ, Brown BR, Horai R, Mattapallil MJ, Xu B, Callegan MC, Uebelhoer LS, Lancioni CL, Vehe RK, Binstadt BA, Smith JR, Caspi RR, Rosenzweig HL
Nature communications 2020 Oct 26;11(1):5406
Nature communications 2020 Oct 26;11(1):5406
The Act1 D10N missense variant impairs CD40 signaling in human B-cells.
Yu N, Lambert S, Bornstein J, Nair RP, Enerbäck C, Elder JT
Genes and immunity 2019 Jan;20(1):23-31
Genes and immunity 2019 Jan;20(1):23-31
Immune Checkpoint Inhibitor-induced Reinvigoration of Tumor-infiltrating CD8(+) T Cells is Determined by Their Differentiation Status in Glioblastoma.
Park J, Kwon M, Kim KH, Kim TS, Hong SH, Kim CG, Kang SG, Moon JH, Kim EH, Park SH, Chang JH, Shin EC
Clinical cancer research : an official journal of the American Association for Cancer Research 2019 Apr 15;25(8):2549-2559
Clinical cancer research : an official journal of the American Association for Cancer Research 2019 Apr 15;25(8):2549-2559
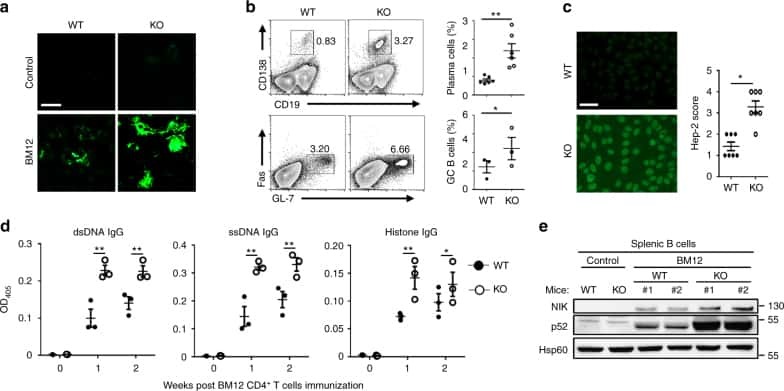
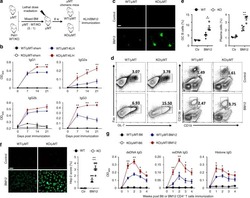
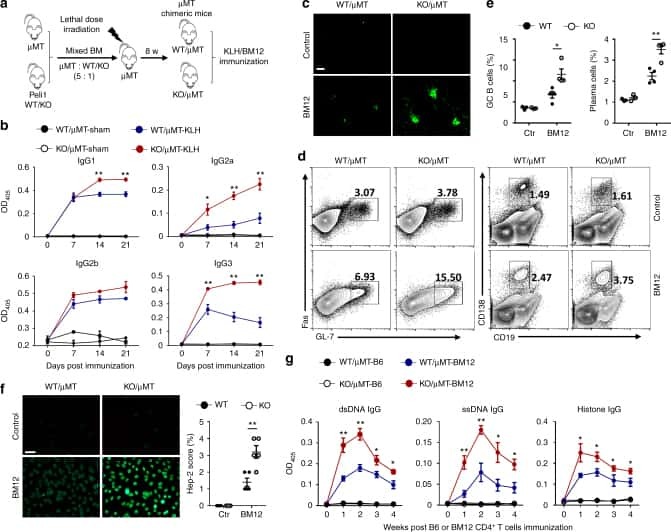
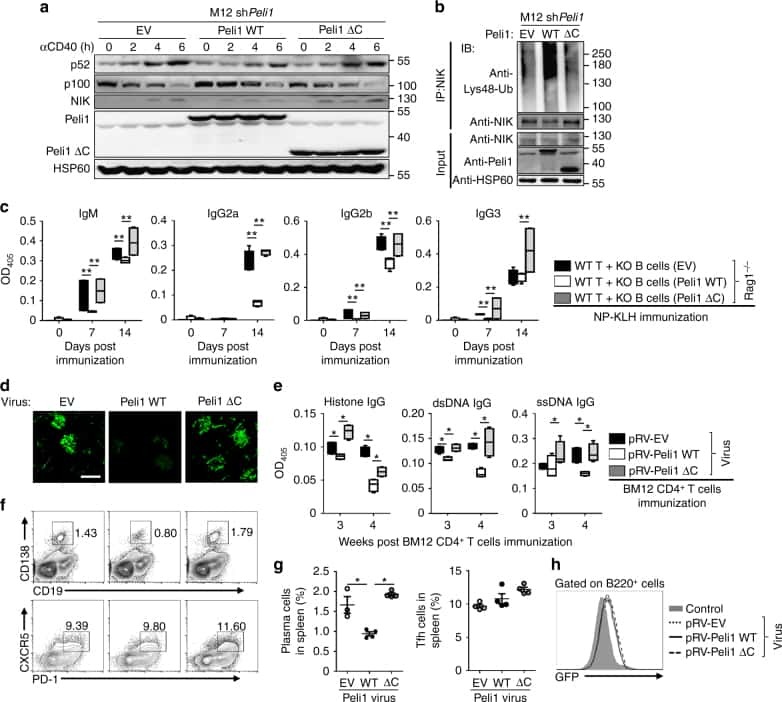
Peli1 negatively regulates noncanonical NF-κB signaling to restrain systemic lupus erythematosus.
Liu J, Huang X, Hao S, Wang Y, Liu M, Xu J, Zhang X, Yu T, Gan S, Dai D, Luo X, Lu Q, Mao C, Zhang Y, Shen N, Li B, Huang M, Zhu X, Jin J, Cheng X, Sun SC, Xiao Y
Nature communications 2018 Mar 19;9(1):1136
Nature communications 2018 Mar 19;9(1):1136
A Human IPS Model Implicates Embryonic B-Myeloid Fate Restriction as Developmental Susceptibility to B Acute Lymphoblastic Leukemia-Associated ETV6-RUNX1.
Böiers C, Richardson SE, Laycock E, Zriwil A, Turati VA, Brown J, Wray JP, Wang D, James C, Herrero J, Sitnicka E, Karlsson S, Smith AJH, Jacobsen SEW, Enver T
Developmental cell 2018 Feb 5;44(3):362-377.e7
Developmental cell 2018 Feb 5;44(3):362-377.e7
Spontaneous development of Epstein-Barr Virus associated human lymphomas in a prostate cancer xenograft program.
Taurozzi AJ, Beekharry R, Wantoch M, Labarthe MC, Walker HF, Seed RI, Simms M, Rodrigues G, Bradford J, van der Horst G, van der Pluijm G, Collins AT
PloS one 2017;12(11):e0188228
PloS one 2017;12(11):e0188228
Human Secretory IgM Emerges from Plasma Cells Clonally Related to Gut Memory B Cells and Targets Highly Diverse Commensals.
Magri G, Comerma L, Pybus M, Sintes J, Lligé D, Segura-Garzón D, Bascones S, Yeste A, Grasset EK, Gutzeit C, Uzzan M, Ramanujam M, van Zelm MC, Albero-González R, Vazquez I, Iglesias M, Serrano S, Márquez L, Mercade E, Mehandru S, Cerutti A
Immunity 2017 Jul 18;47(1):118-134.e8
Immunity 2017 Jul 18;47(1):118-134.e8
A Member of the Nuclear Receptor Superfamily, Designated as NR2F2, Supports the Self-Renewal Capacity and Pluripotency of Human Bone Marrow-Derived Mesenchymal Stem Cells.
Zhu N, Wang H, Wang B, Wei J, Shan W, Feng J, Huang H
Stem cells international 2016;2016:5687589
Stem cells international 2016;2016:5687589
The Effect of Chronic Hepatitis B Virus Infection on BDCA3+ Dendritic Cell Frequency and Function.
van der Aa E, Buschow SI, Biesta PJ, Janssen HL, Woltman AM
PloS one 2016;11(8):e0161235
PloS one 2016;11(8):e0161235
Chimeric antigen receptor-engineered cytokine-induced killer cells overcome treatment resistance of pre-B-cell acute lymphoblastic leukemia and enhance survival.
Oelsner S, Wagner J, Friede ME, Pfirrmann V, Genßler S, Rettinger E, Buchholz CJ, Pfeifer H, Schubert R, Ottmann OG, Ullrich E, Bader P, Wels WS
International journal of cancer 2016 Oct 15;139(8):1799-809
International journal of cancer 2016 Oct 15;139(8):1799-809
Efficient generation of antigen-specific CTLs by the BAFF-activated human B Lymphocytes as APCs: a novel approach for immunotherapy.
Yiwen Z, Shilin G, Yingshi C, Lishi S, Baohong L, Chao L, Linghua L, Ting P, Hui Z
Oncotarget 2016 Nov 22;7(47):77732-77748
Oncotarget 2016 Nov 22;7(47):77732-77748
IL-10+ Innate-like B Cells Are Part of the Skin Immune System and Require α4β1 Integrin To Migrate between the Peritoneum and Inflamed Skin.
Geherin SA, Gómez D, Glabman RA, Ruthel G, Hamann A, Debes GF
Journal of immunology (Baltimore, Md. : 1950) 2016 Mar 15;196(6):2514-2525
Journal of immunology (Baltimore, Md. : 1950) 2016 Mar 15;196(6):2514-2525
Medial HOXA genes demarcate haematopoietic stem cell fate during human development.
Dou DR, Calvanese V, Sierra MI, Nguyen AT, Minasian A, Saarikoski P, Sasidharan R, Ramirez CM, Zack JA, Crooks GM, Galic Z, Mikkola HK
Nature cell biology 2016 Jun;18(6):595-606
Nature cell biology 2016 Jun;18(6):595-606
CD19 CAR immune pressure induces B-precursor acute lymphoblastic leukaemia lineage switch exposing inherent leukaemic plasticity.
Jacoby E, Nguyen SM, Fountaine TJ, Welp K, Gryder B, Qin H, Yang Y, Chien CD, Seif AE, Lei H, Song YK, Khan J, Lee DW, Mackall CL, Gardner RA, Jensen MC, Shern JF, Fry TJ
Nature communications 2016 Jul 27;7:12320
Nature communications 2016 Jul 27;7:12320
Tissue factor expression by myeloid cells contributes to protective immune response against Mycobacterium tuberculosis infection.
Venkatasubramanian S, Tripathi D, Tucker T, Paidipally P, Cheekatla S, Welch E, Raghunath A, Jeffers A, Tvinnereim AR, Schechter ME, Andrade BB, Mackman N, Idell S, Vankayalapati R
European journal of immunology 2016 Feb;46(2):464-79
European journal of immunology 2016 Feb;46(2):464-79
MIF Plays a Key Role in Regulating Tissue-Specific Chondro-Osteogenic Differentiation Fate of Human Cartilage Endplate Stem Cells under Hypoxia.
Yao Y, Deng Q, Song W, Zhang H, Li Y, Yang Y, Fan X, Liu M, Shang J, Sun C, Tang Y, Jin X, Liu H, Huang B, Zhou Y
Stem cell reports 2016 Aug 9;7(2):249-62
Stem cell reports 2016 Aug 9;7(2):249-62
A cell-based systems biology assessment of human blood to monitor immune responses after influenza vaccination.
Hoek KL, Samir P, Howard LM, Niu X, Prasad N, Galassie A, Liu Q, Allos TM, Floyd KA, Guo Y, Shyr Y, Levy SE, Joyce S, Edwards KM, Link AJ
PloS one 2015;10(2):e0118528
PloS one 2015;10(2):e0118528
dNP2 is a blood-brain barrier-permeable peptide enabling ctCTLA-4 protein delivery to ameliorate experimental autoimmune encephalomyelitis.
Lim S, Kim WJ, Kim YH, Lee S, Koo JH, Lee JA, Yoon H, Kim DH, Park HJ, Kim HM, Lee HG, Yun Kim J, Lee JU, Hun Shin J, Kyun Kim L, Doh J, Kim H, Lee SK, Bothwell ALM, Suh M, Choi JM
Nature communications 2015 Sep 15;6:8244
Nature communications 2015 Sep 15;6:8244
Transcriptional repressor ZEB2 promotes terminal differentiation of CD8+ effector and memory T cell populations during infection.
Omilusik KD, Best JA, Yu B, Goossens S, Weidemann A, Nguyen JV, Seuntjens E, Stryjewska A, Zweier C, Roychoudhuri R, Gattinoni L, Bird LM, Higashi Y, Kondoh H, Huylebroeck D, Haigh J, Goldrath AW
The Journal of experimental medicine 2015 Nov 16;212(12):2027-39
The Journal of experimental medicine 2015 Nov 16;212(12):2027-39
Brief Report: IFIH1 Mutation Causes Systemic Lupus Erythematosus With Selective IgA Deficiency.
Van Eyck L, De Somer L, Pombal D, Bornschein S, Frans G, Humblet-Baron S, Moens L, de Zegher F, Bossuyt X, Wouters C, Liston A
Arthritis & rheumatology (Hoboken, N.J.) 2015 Jun;67(6):1592-7
Arthritis & rheumatology (Hoboken, N.J.) 2015 Jun;67(6):1592-7
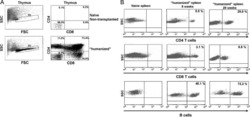
Thymic HIV-2 infection uncovers posttranscriptional control of viral replication in human thymocytes.
Nunes-Cabaço H, Matoso P, Foxall RB, Tendeiro R, Pires AR, Carvalho T, Pinheiro AI, Soares RS, Sousa AE
Journal of virology 2015 Feb;89(4):2201-8
Journal of virology 2015 Feb;89(4):2201-8
Induction of type I and type III interferons by Borrelia burgdorferi correlates with pathogenesis and requires linear plasmid 36.
Krupna-Gaylord MA, Liveris D, Love AC, Wormser GP, Schwartz I, Petzke MM
PloS one 2014;9(6):e100174
PloS one 2014;9(6):e100174
Regulatory B cells are numerically but not functionally deficient in anti-neutrophil cytoplasm antibody-associated vasculitis.
Todd SK, Pepper RJ, Draibe J, Tanna A, Pusey CD, Mauri C, Salama AD
Rheumatology (Oxford, England) 2014 Sep;53(9):1693-703
Rheumatology (Oxford, England) 2014 Sep;53(9):1693-703
The role of transforming growth factor β signaling in fibroblast-like synoviocytes from patients with oligoarticular juvenile idiopathic arthritis: dysregulation of transforming growth factor β signaling, including overexpression of bone morphogenetic protein 4, may lead to a chondrocyte phenotype and may contribute to bony hypertrophy.
Brescia AC, Simonds MM, McCahan SM, Fawcett PT, Rose CD
Arthritis & rheumatology (Hoboken, N.J.) 2014 May;66(5):1352-62
Arthritis & rheumatology (Hoboken, N.J.) 2014 May;66(5):1352-62
Aberrant expression of SALL4 in acute B cell lymphoblastic leukemia: mechanism, function, and implication for a potential novel therapeutic target.
Ueno S, Lu J, He J, Li A, Zhang X, Ritz J, Silberstein LE, Chai L
Experimental hematology 2014 Apr;42(4):307-316.e8
Experimental hematology 2014 Apr;42(4):307-316.e8
Novel immunomodulators from hard ticks selectively reprogramme human dendritic cell responses.
Preston SG, Majtán J, Kouremenou C, Rysnik O, Burger LF, Cabezas Cruz A, Chiong Guzman M, Nunn MA, Paesen GC, Nuttall PA, Austyn JM
PLoS pathogens 2013;9(6):e1003450
PLoS pathogens 2013;9(6):e1003450
Replication and meta-analysis of GWAS identified susceptibility loci in Kawasaki disease confirm the importance of B lymphoid tyrosine kinase (BLK) in disease susceptibility.
Chang CJ, Kuo HC, Chang JS, Lee JK, Tsai FJ, Khor CC, Chang LC, Chen SP, Ko TM, Liu YM, Chen YJ, Hong YM, Jang GY, Hibberd ML, Kuijpers T, Burgner D, Levin M, Burns JC, Davila S, International Kawasaki Disease Genetics Consortium, Korean Kawasaki Disease Genetics Consortium, Taiwan Kawasaki Disease Genetics Consortium, Chen YT, Chen CH, Wu JY, Lee YC
PloS one 2013;8(8):e72037
PloS one 2013;8(8):e72037
Comparative study of the cytokine/chemokine response in children with differing disease severity in enterovirus 71-induced hand, foot, and mouth disease.
Zhang Y, Liu H, Wang L, Yang F, Hu Y, Ren X, Li G, Yang Y, Sun S, Li Y, Chen X, Li X, Jin Q
PloS one 2013;8(6):e67430
PloS one 2013;8(6):e67430
Lipoxin A4 regulates natural killer cell and type 2 innate lymphoid cell activation in asthma.
Barnig C, Cernadas M, Dutile S, Liu X, Perrella MA, Kazani S, Wechsler ME, Israel E, Levy BD
Science translational medicine 2013 Feb 27;5(174):174ra26
Science translational medicine 2013 Feb 27;5(174):174ra26
Cytomegalovirus-specific T-cell reactivity in biliary atresia at the time of diagnosis is associated with deficits in regulatory T cells.
Brindley SM, Lanham AM, Karrer FM, Tucker RM, Fontenot AP, Mack CL
Hepatology (Baltimore, Md.) 2012 Apr;55(4):1130-8
Hepatology (Baltimore, Md.) 2012 Apr;55(4):1130-8
A pathobiological role of the insulin receptor in chronic lymphocytic leukemia.
Saiya-Cork K, Collins R, Parkin B, Ouillette P, Kuizon E, Kujawski L, Erba H, Campagnaro E, Shedden K, Kaminski M, Malek SN
Clinical cancer research : an official journal of the American Association for Cancer Research 2011 May 1;17(9):2679-92
Clinical cancer research : an official journal of the American Association for Cancer Research 2011 May 1;17(9):2679-92
Generation of bivalent chromatin domains during cell fate decisions.
De Gobbi M, Garrick D, Lynch M, Vernimmen D, Hughes JR, Goardon N, Luc S, Lower KM, Sloane-Stanley JA, Pina C, Soneji S, Renella R, Enver T, Taylor S, Jacobsen SE, Vyas P, Gibbons RJ, Higgs DR
Epigenetics & chromatin 2011 Jun 6;4(1):9
Epigenetics & chromatin 2011 Jun 6;4(1):9
Suppression of B-cell lymphomagenesis by the BH3-only proteins Bmf and Bad.
Frenzel A, Labi V, Chmelewskij W, Ploner C, Geley S, Fiegl H, Tzankov A, Villunger A
Blood 2010 Feb 4;115(5):995-1005
Blood 2010 Feb 4;115(5):995-1005
Role played by the programmed death-1-programmed death ligand pathway during innate immunity against Mycobacterium tuberculosis.
Alvarez IB, Pasquinelli V, Jurado JO, Abbate E, Musella RM, de la Barrera SS, García VE
The Journal of infectious diseases 2010 Aug 15;202(4):524-32
The Journal of infectious diseases 2010 Aug 15;202(4):524-32
Identification of markers that distinguish monocyte-derived fibrocytes from monocytes, macrophages, and fibroblasts.
Pilling D, Fan T, Huang D, Kaul B, Gomer RH
PloS one 2009 Oct 16;4(10):e7475
PloS one 2009 Oct 16;4(10):e7475
B cells and monocytes from patients with active multiple sclerosis exhibit increased surface expression of both HERV-H Env and HERV-W Env, accompanied by increased seroreactivity.
Brudek T, Christensen T, Aagaard L, Petersen T, Hansen HJ, Møller-Larsen A
Retrovirology 2009 Nov 16;6:104
Retrovirology 2009 Nov 16;6:104
Improved serum-free culture conditions for the differentiation of human and murine fibrocytes.
Pilling D, Vakil V, Gomer RH
Journal of immunological methods 2009 Dec 31;351(1-2):62-70
Journal of immunological methods 2009 Dec 31;351(1-2):62-70
Lung dendritic cell expression of maturation molecules increases with worsening chronic obstructive pulmonary disease.
Freeman CM, Martinez FJ, Han MK, Ames TM, Chensue SW, Todt JC, Arenberg DA, Meldrum CA, Getty C, McCloskey L, Curtis JL
American journal of respiratory and critical care medicine 2009 Dec 15;180(12):1179-88
American journal of respiratory and critical care medicine 2009 Dec 15;180(12):1179-88
Sepsis-induced human lymphocyte apoptosis and cytokine production in "humanized" mice.
Unsinger J, McDonough JS, Shultz LD, Ferguson TA, Hotchkiss RS
Journal of leukocyte biology 2009 Aug;86(2):219-27
Journal of leukocyte biology 2009 Aug;86(2):219-27
No comments: Submit comment
Supportive validation
- Submitted by
- Invitrogen Antibodies (provider)
- Main image

- Experimental details
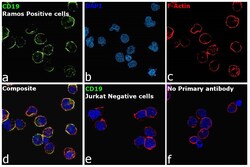
- Immunofluorescence analysis of B-lymphocyte antigen CD19 was performed using 70% confluent log phase Ramos cells. The cells were fixed with 4% paraformaldehyde for 10 minutes, permeabilized with 0.1% Triton™ X-100 for 15 minutes, and blocked with 2% BSA for 45 minutes at room temperature. The cells were labeled with CD19 Monoclonal Antibody (HIB19), eBioscience™ (Product # 14-0199-82, 14-0199-80) at 5 µg/mL in 0.1% BSA, incubated at 4 degree celsius overnight and then labeled with Donkey anti-Mouse IgG (H+L) Highly Cross-Adsorbed Secondary Antibody, Alexa Fluor Plus 488 (Product # A32766), (1:2000 dilution), for 45 minutes at room temperature (Panel a: Green). Nuclei (Panel b: Blue) were stained with ProLong™ Diamond Antifade Mountant with DAPI (Product # P36962). F-actin (Panel c: Red) was stained with Rhodamine Phalloidin (Product # R415, 1:300 dilution). Panel d represents the merged image showing membrane localization. Panel e represents no expression of CD19 in Jurkat cells. Panel f represents control cells with no primary antibody to assess background. The images were captured at 60X magnification.

- Submitted by
- Invitrogen Antibodies (provider)
- Main image

- Experimental details
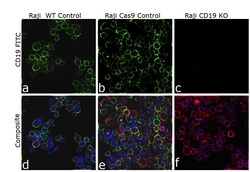
- Knockout of CD19 was achieved by CRISPR-Cas9 genome editing using LentiArray™ Lentiviral sgRNA (Product # A32042, AssayID CRISPR807388_LV) and LentiArray Cas9 Lentivirus (Product # A32064). Immunofluorescence analysis was performed on wild type Raji cells (panel a,d), Raji Cas9 control cells (panel b,e) and Raji CD19KO cells (panel c, f). Cells were fixed, permeabilized, and labeled with CD19 Monoclonal Antibody (HIB19), eBioscience™ (Product # 14-0199-82, 1:100 dilution), followed by Goat anti-Mouse IgG (H+L) Highly Cross-Adsorbed Secondary Antibody, Alexa Fluor™ Plus 488 (Product # A32723, 1:2000). Nuclei (blue) were stained using ProLong™ Diamond Antifade Mountant with DAPI (Product # P36962), and Rhodamine Phalloidin (Product # R415, 1:300) was used for cytoskeletal F-actin (red) staining. Loss of signal (panel c,f) upon CRISPR mediated knockout (KO) confirms that antibody is specific to CD19 (green). The images were captured at 60X magnification.

- Submitted by
- Invitrogen Antibodies (provider)
- Main image
- Experimental details
- Immunofluorescence analysis of B-lymphocyte antigen CD19 was performed using 70% confluent log phase Ramos cells. The cells were fixed with 4% paraformaldehyde for 10 minutes, permeabilized with 0.1% Triton™ X-100 for 15 minutes, and blocked with 2% BSA for 45 minutes at room temperature. The cells were labeled with CD19 Monoclonal Antibody (HIB19), eBioscience™ (Product # 14-0199-80) at 5 µg/mL in 0.1% BSA, incubated at 4 degree celsius overnight and then labeled with Donkey anti-Mouse IgG (H+L) Highly Cross-Adsorbed Secondary Antibody, Alexa Fluor Plus 488 (Product # A32766), (1:2000 dilution), for 45 minutes at room temperature (Panel a: Green). Nuclei (Panel b: Blue) were stained with ProLong™ Diamond Antifade Mountant with DAPI (Product # P36962). F-actin (Panel c: Red) was stained with Rhodamine Phalloidin (Product # R415, 1:300 dilution). Panel d represents the merged image showing membrane localization. Panel e represents no expression of CD19 in Jurkat cells. Panel f represents control cells with no primary antibody to assess background. The images were captured at 60X magnification.

Supportive validation
- Submitted by
- Invitrogen Antibodies (provider)
- Main image
- Experimental details
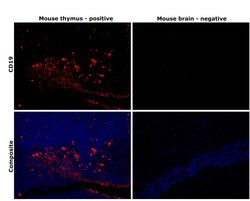
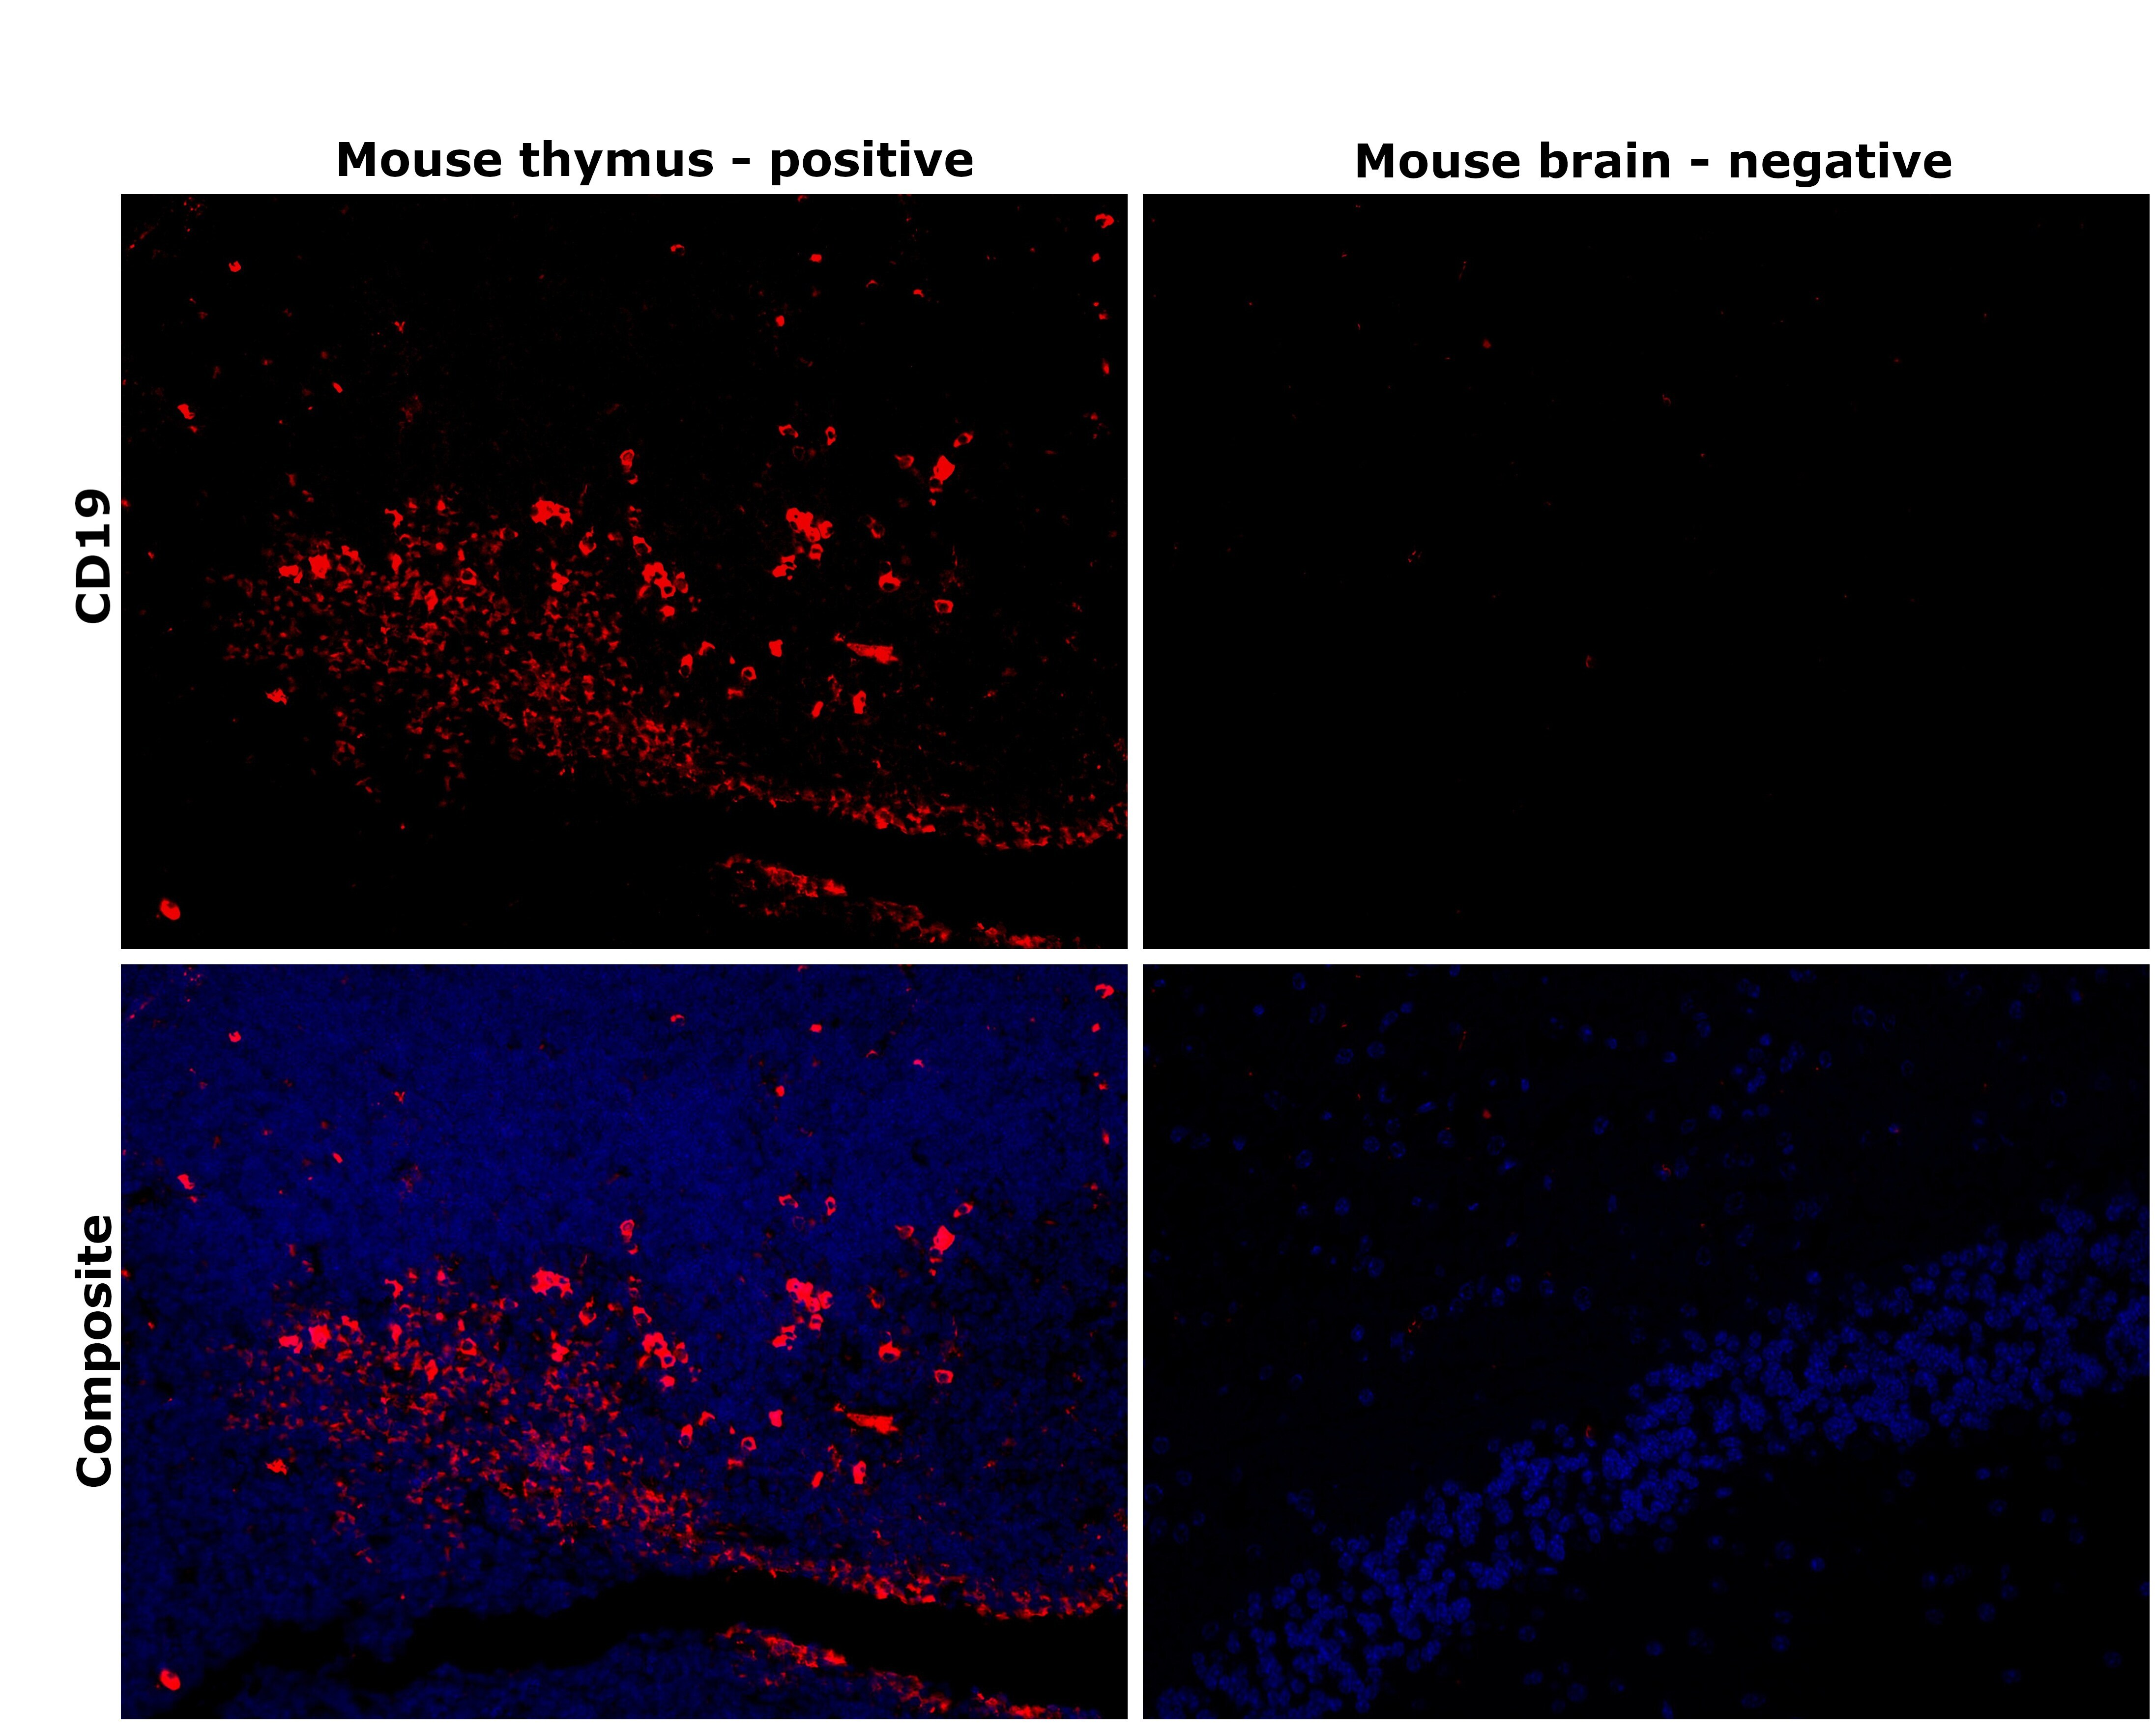
- Immunohistochemical analysis of CD19 was performed using formalin-fixed paraffin-embedded mouse thymus and mouse brain tissue sections. To expose the target protein, heat-induced epitope retrieval was performed on de-paraffinized sections using eBioscience™ IHC Antigen Retrieval Solution - Low pH (10X) (Product # 00-4955-58) diluted to 1X solution in water in a decloaking chamber at 110 degree Celsius for 15 minutes.Following antigen retrieval, the sections were blocked with 3% H2O2 for 1 hour at room temperature followed by 2% normal goat serum in 1X PBS for 45 minutes at room temperature and then probed with CD19 Monoclonal Antibody (HIB19), eBioscience™ (Product # 14-0199-82) at 1 µg/mL in 0.1% normal goat serum overnight at 4 degree Celsius in a humidified chamber. Detection was performed using Alexa Fluor™ 594 Tyramide SuperBoost™ Kit, goat anti-mouse IgG (Product # B40915). Nuclei were stained with DAPI (Product # D1306) and the sections were mounted using ProLong™ Glass Antifade Mountant (Product # P36984). The images were captured on EVOS™ M7000 Imaging System (Product # AMF7000) at 20X magnification and externally deconvoluted.
Supportive validation
- Submitted by
- Invitrogen Antibodies (provider)
- Main image
- Experimental details
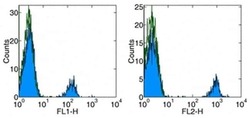
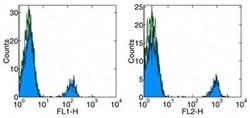
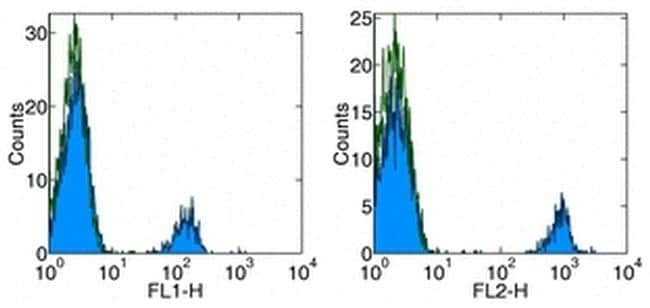
- Staining of normal human peripheral blood cells with Anti-Human CD19 FITC (left) and PE (right). Autofluorescence is indicated by open histogram. Cells in the lymphocyte gate were used for analysis.

- Submitted by
- Invitrogen Antibodies (provider)
- Main image
- Experimental details
- Staining of normal human peripheral blood cells with Anti-Human CD19 FITC (left) and PE (right). Autofluorescence is indicated by open histogram. Cells in the lymphocyte gate were used for analysis.
Supportive validation
- Submitted by
- Invitrogen Antibodies (provider)
- Main image

- Experimental details
- NULL
- Submitted by
- Invitrogen Antibodies (provider)
- Main image
- Experimental details
- NULL
- Submitted by
- Invitrogen Antibodies (provider)
- Main image
- Experimental details
- NULL

- Submitted by
- Invitrogen Antibodies (provider)
- Main image
- Experimental details
- NULL
- Submitted by
- Invitrogen Antibodies (provider)
- Main image
- Experimental details
- NULL
- Submitted by
- Invitrogen Antibodies (provider)
- Main image

- Experimental details
- NULL
- Submitted by
- Invitrogen Antibodies (provider)
- Main image
- Experimental details
- NULL
- Submitted by
- Invitrogen Antibodies (provider)
- Main image

- Experimental details
- NULL
- Submitted by
- Invitrogen Antibodies (provider)
- Main image
- Experimental details
- NULL
- Submitted by
- Invitrogen Antibodies (provider)
- Main image
- Experimental details
- NULL
- Submitted by
- Invitrogen Antibodies (provider)
- Main image

- Experimental details
- NULL
- Submitted by
- Invitrogen Antibodies (provider)
- Main image
- Experimental details
- NULL

- Submitted by
- Invitrogen Antibodies (provider)
- Main image
- Experimental details
- NULL
- Submitted by
- Invitrogen Antibodies (provider)
- Main image
- Experimental details
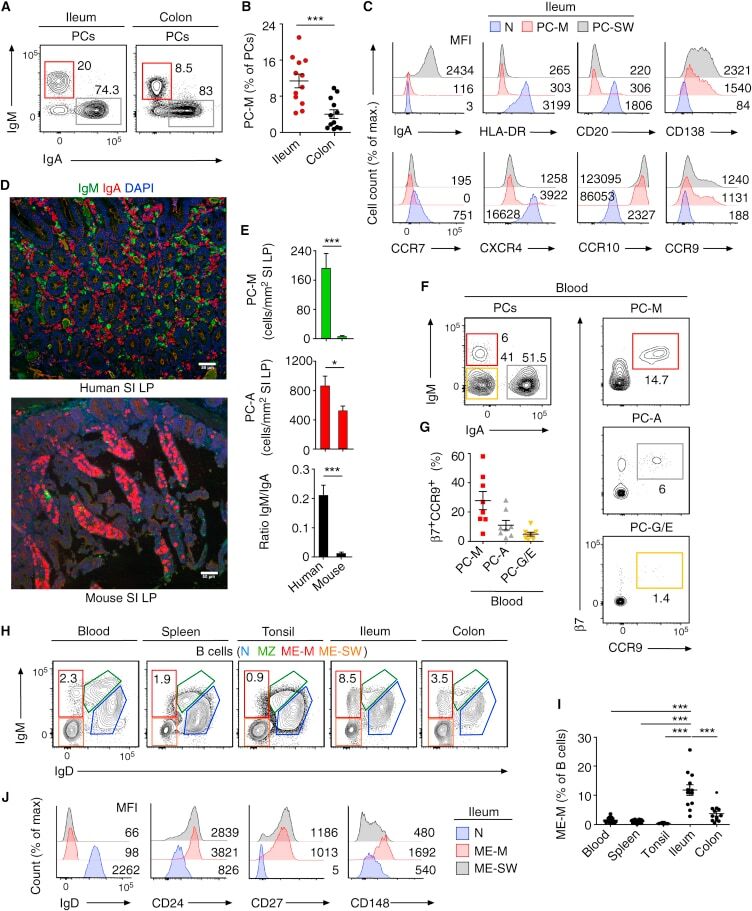
- Figure 1 Human PC-Ms Accumulate in the Gut together with ME-M B Cells and Include a Circulating Counterpart Expressing Gut-Homing Receptors (A) Flow cytometry (FCM) of IgM and IgA on CD19 + CD38 hi CD10 - PCs from human ileum and colon. (B) Frequency of PC-Ms among total PCs, assessed by FCM. (C) FCM of selected surface molecules on naive (N) B cells, PC-Ms, and switched PCs (PC-SW) from human ileum. Numbers indicate mean fluorescence intensity (MFI). (D) Immunofluorescence analysis (IFA) of IgM (green), IgA (red), and DNA (blue) in human ileum and mouse small intestine (SI) lamina propria (LP). Original magnification, 20x. Scale bars, 50 mum. (E) Number of PC-Ms (top), PC-As (center) per mm 2 of LP, and PC-M/PC-A ratio (bottom) from human or mouse SI assessed following tissue IFA. Data summarize six different tissue samples where at least four high-power microscopic fields were analyzed. (F and G) Representative FCM (F) and frequency (G) of beta7 + CCR9 + cells in human circulating PC-Ms, PC-As, and PC-G/Es. (H) Representative FCM showing IgM versus IgD staining on CD19 + CD38 - CD10 - B cells from different human tissues. (I) Frequency of ME-M B cells from tissues shown in (H). (J) FCM of IgD, CD24, CD27, and CD148 on naive, ME-M, and ME-SW B cells from ileum. Data show one representative result (A, F, H) of 12 (B), 8 (G), or 52 (I) experiments or are from one experiment of at least 3 with similar results (C, D, J). Results are presented as mean +- SEM; two-tailed unpaired
- Submitted by
- Invitrogen Antibodies (provider)
- Main image

- Experimental details
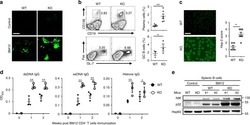
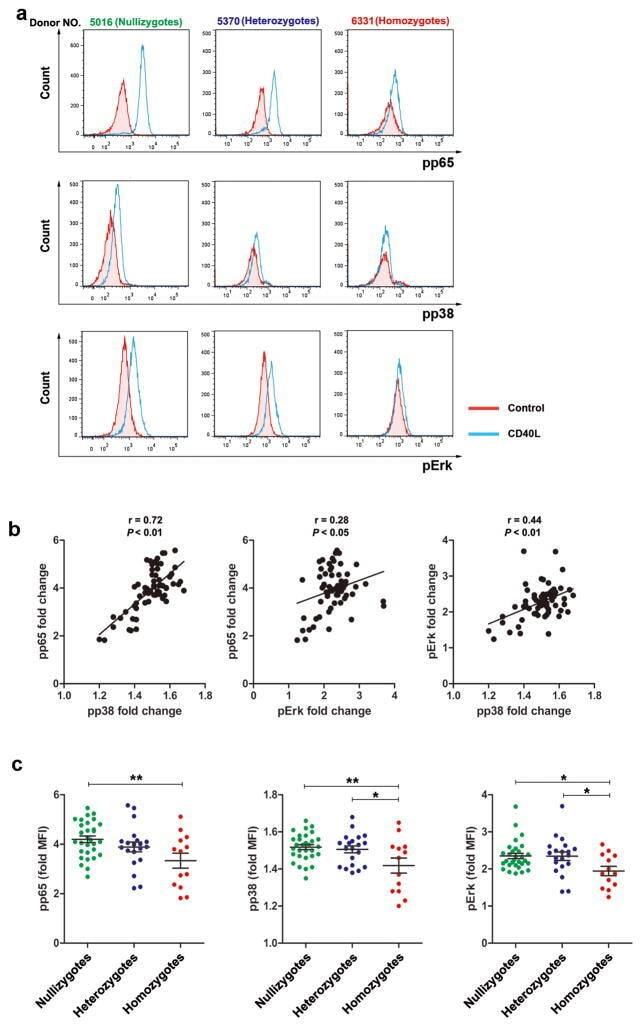
- Figure 4 D10N impairs CD40L-induced p65, p38 and Erk phosphorylation in PBMC-derived B-cells. PBMCs were cultured with (blue curves) or without (red shadow) 100 ng/ml CD40L for 15 minutes, followed by phospho-flow cytometric analysis of pp65, pp38 and pErk within the CD19 + gate. ( a ) Representative histograms (from one of two experiments performed for each genotype) are presented for PBMC-derived B-cells from Act1 D10N izygous (left panels), heterozygous (middle panels), and homozygous (right panels) individuals. ( b ) Correlations between MFI values for pp65, pp38 and pErk in stimulated CD19 + B-cells for all tested individuals (n = 63), Data are expressed as fold-change increases. Pearson correlations between pp65 and pp38, pp65 and pErk, pErk and pp38 were performed. Each symbol represents two experiments averaged for one donor ( c ) Phosphorylation of p65, p38 and Erk in B-cells from izygous, heterozygous, and homozygous groups in response to CD40L were expressed as fold MFI. Each symbol represents one individual donor. Summary data represented by horizontal lines represent mean +- SEM. * P < 0.05, ** P < 0.01, as assessed by one-way analysis of variance followed by Dunnett''s post hoc test.
- Submitted by
- Invitrogen Antibodies (provider)
- Main image
- Experimental details
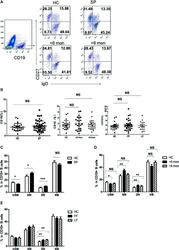
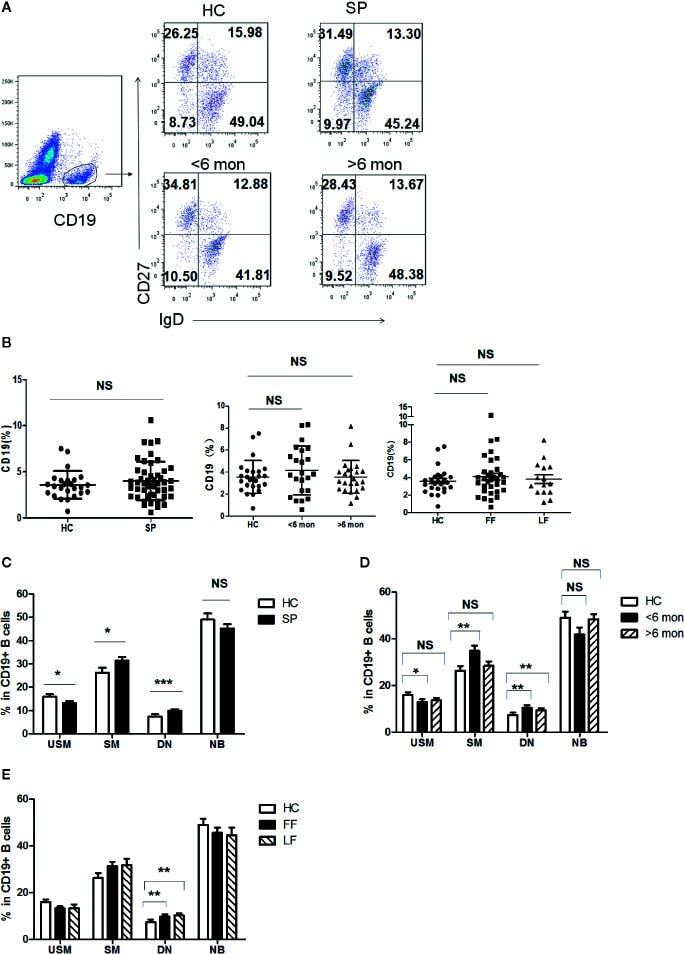
- Figure 3 Phenotypic characterization of circulating B cell subsets in patients and HC. (A) Gated by CD19 + B cells, IgD + CD27 - NB, IgD + CD27 + USM B cells, IgD - CD27 + SM B cells, and IgD - CD27 - DN B cells were identified. The graphs are representative for HC and patients with different duration. Mean value of each B cell subset's percentage is shown in the quadrants. (B) Statistical graphs for comparison of CD19 + B cells' percentages between patient groups and HC. (C-E) Statistical graphs for distinct CD19 + B cells subsets between patients (SP, n = 48; SD, n = 23; LD, n = 25; FF, n = 33; LF, n = 15.) and HC (n = 25). Error bars represent mean+-SD. * P < 0.05, ** P < 0.01, *** P < 0.001, and NS P >= 0.05.
- Submitted by
- Invitrogen Antibodies (provider)
- Main image
- Experimental details
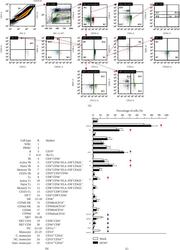
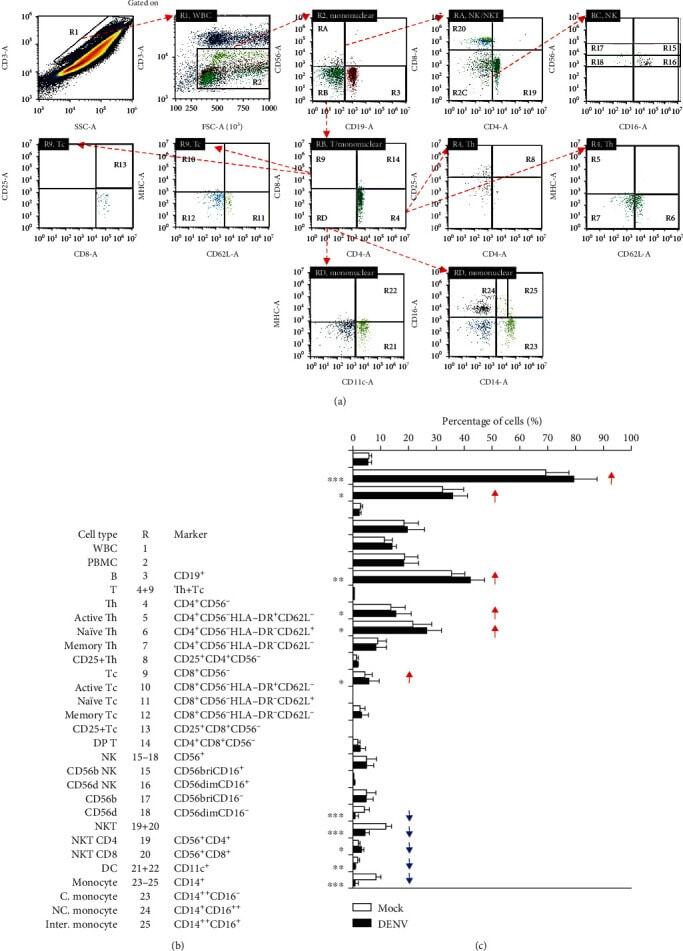
- Figure 4 Immune profiling in DENV-treated whole blood cells 24 h postincubation. Following DENV (MOI = 1) coculture in 100 mu l of WB ex vivo for 24 h, (a) representative flow cytometric analysis and gating of various cells obtained from five cases, performed by staining for specific cell surface markers (CD4, CD8, CD11c, CD14, CD16, CD19, CD25, CD56, CD62L, and HLA-DR), in the DENV-infected and mock groups showed (b) the changes in the expression of specific immune cell populations as noted. (c) The results are shown as a percentage of the mean +- SD obtained from five cases. * p < 0.05, ** p < 0.01, and *** p < 0.001, compared to the mock group. R: region; WBC: white blood cell; bri: bright.
- Submitted by
- Invitrogen Antibodies (provider)
- Main image
- Experimental details
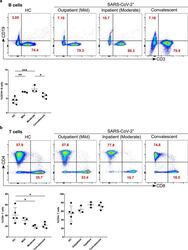
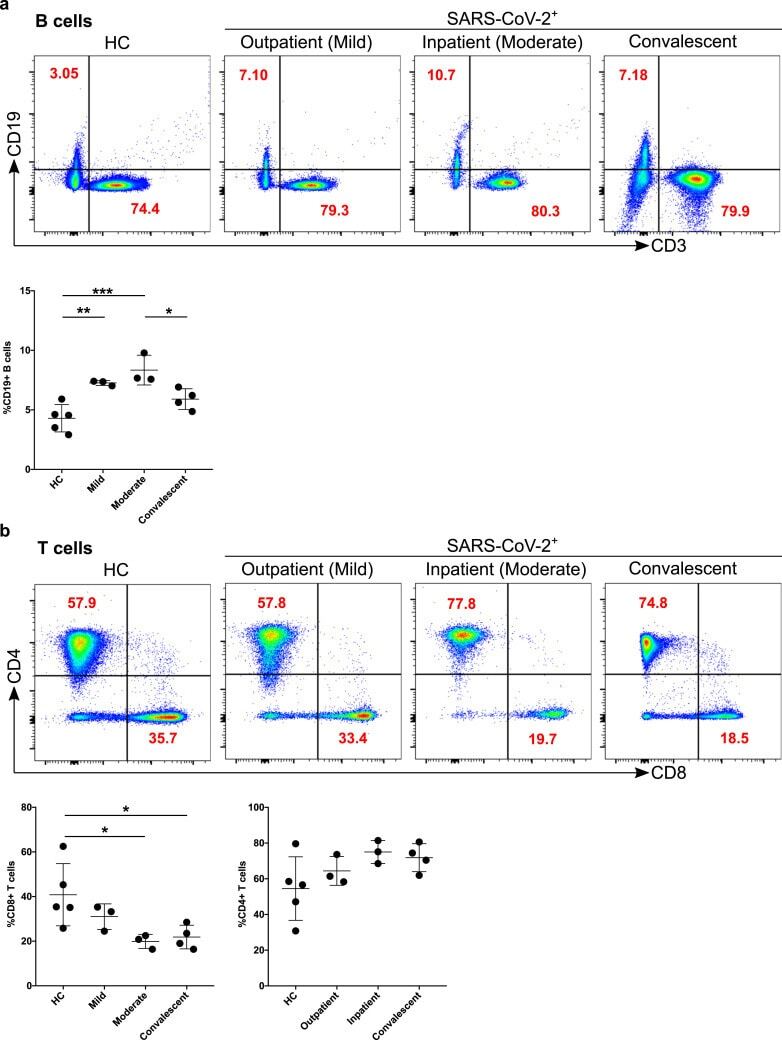
- Figure 4 Increased B cells in mild and moderate patients and reduced CD8 + cytotoxic T cells in mild and convalescent patients. A. The stained PBMCs were gated on lymphocyte population and examined for the CD19 and CD3 expression in HC, mild, moderate and convalescent (upper FACS panel). One exemplary dot plot is shown per study group. The bar diagram shows CD3 - CD19 + B cells. *P-value
- Submitted by
- Invitrogen Antibodies (provider)
- Main image
- Experimental details
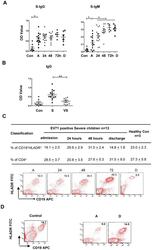
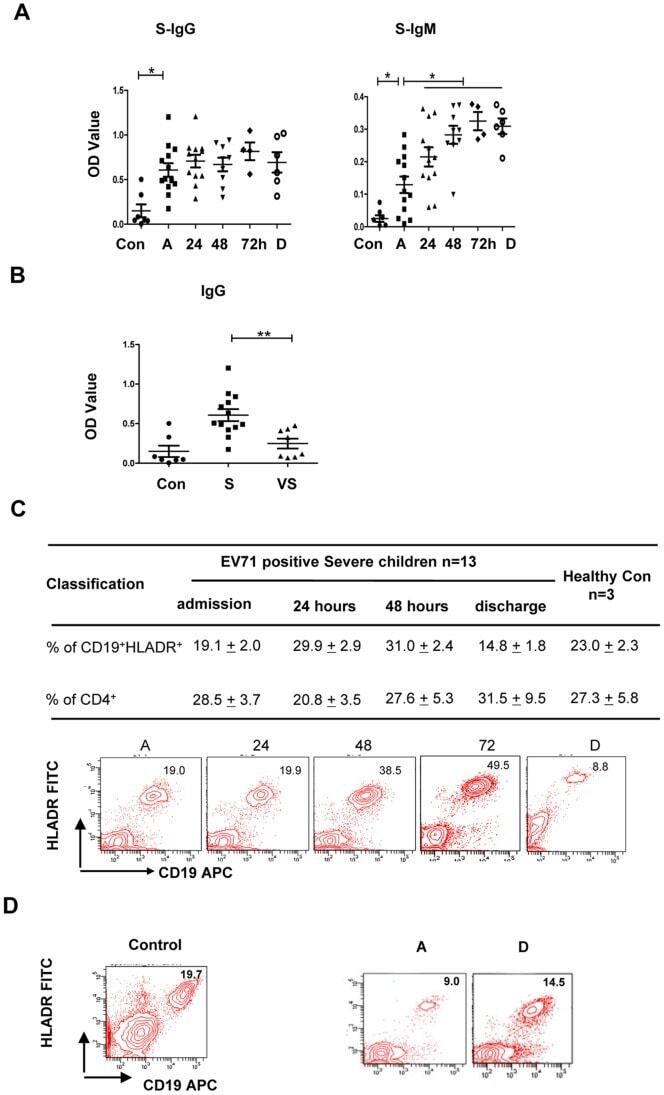
- 10.1371/journal.pone.0067430.g005 Figure 5 Production of EV71 VP-1-specific IgG and IgM antibodies in patients with increased frequency of CD19 + HLA-DR + cells. (A) IgG and IgM antibodies were rapidly increased and were markedly higher in plasma from severe patients (n = 13) compared with normal controls (n = 7). The differences between two time points of every individuals were determined by Wilcoxon's Sign Rank Test. * P
- Submitted by
- Invitrogen Antibodies (provider)
- Main image
- Experimental details
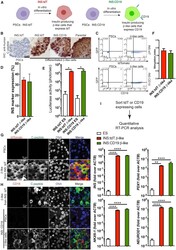
- Figure 1 Differentiation of Human PSC INS Reporter Cells (A) A diagram showing control (left panel) and experimental (right panel) INS reporter cells. (B) Immunohistochemistry (IHC) staining with an anti-human-C-peptide antibody in beta-like cells differentiated from INS:tdT, INS:CD19, and parental PSCs (right three panels) and undifferentiated PSCs (left panel). Scale bar, 50 mum. (C) Representative flow cytometry results of PSCs (left panels) and beta-like cells (right panels) differentiated from INS:tdT (top panel) and INS:CD19 (bottom panel), showing the GFP signal on the vertical axis and the tdTomato fluorescence signal (top panel) or anti-CD19 signal on the horizontal axis (bottom panel). (D) Quantifications of the proportion of INS reporter-expressing cells at the end of differentiation (n = 3). (E) Quantification of the luciferase signal in undifferentiated ESCs and beta-like cells differentiated from the INS reporter cells (n = 4). (F) In vitro glucose-stimulated insulin secretion (GSIS) assays of PSC-differentiated beta-like cells. The stimulation index shows the ratio of the amounts of secreted human insulin released when beta-like cells were treated with 20 mM glucose compared with 2.5 mM glucose (n = 4). (G) Confocal micrographs with an anti-tdTomato antibody (red) and an anti-C-peptide antibody (green) of beta-like cells differentiated from INS:tdT PSCs. Scale bar, 10 mum. (H) Confocal micrographs with an anti-CD19 antibody (red) and an anti-C-peptide antibody

- Submitted by
- Invitrogen Antibodies (provider)
- Main image
- Experimental details
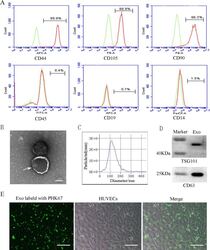
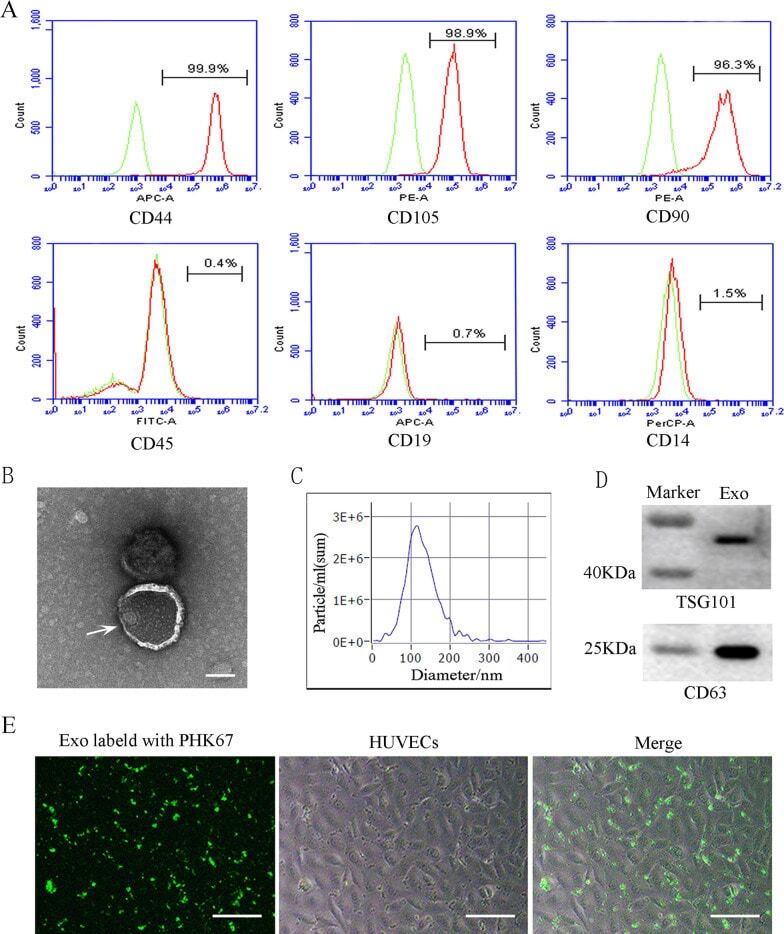
- Characterization and uptake of SHED-Exos. A Surface markers of SHED cells were analyzed by flow cytometry (FACS) and were positive for mesenchymal markers (CD44, CD105 and CD90) and negative for endothelial markers (CD45, CD19 and CD14). B The morphology of exosomes (indicated by arrows) was observed using a transmission electron microscope (TEM). Scale bar = 100 nm. C Particle size distribution of SHED-Exos assessed by nanoparticle tracking analysis (NTA). D Expression of exosome-specific CD63 and TSG101 validated using western blotting. E Efficient uptake of PKH67-labeled exosomes by HUVECs was detected at 24 h. Scale bars = 100 mum
- Submitted by
- Invitrogen Antibodies (provider)
- Main image
- Experimental details
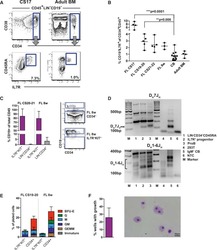
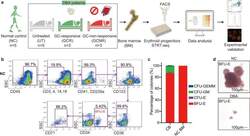
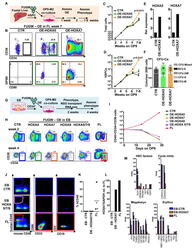
- Fig. 1 BM erythroid progenitors in DBA patients show compromised growth. a Schematic illustrating the experimental workflow. Bone marrow (BM) erythroid progenitors from healthy individuals (acting as normal controls, NC) and DBA patients, who were subcategorized into untreated (UT), glucocorticoid (GC)-responsive (GCR) and GC-non-responsive (GCNR) groups, were sorted using flow cytometry and processed for single-cell RNA-seq (scRNA-seq) using modified STRT-seq, followed by data analyses and experimental validation. b Representative FACS plots showing the gating strategies used for isolation of BFU-E cells from NCs, which were immunophenotypically defined as CD45 + CD3 - CD4 - CD14 - CD19 - CD41 - CD235a - CD123 - CD36 - CD34 + . c The percentage of colonies generated from FACS-sorted cells (BFU-E: CD45 + CD3 - CD4 - CD14 - CD19 - CD41 - CD235a - CD123 - CD36 - CD34 + ) from cord blood (CB) and BM mononuclear cells. We seeded the sorted cells from the CB of three individuals and BM of one individual due to the limited healthy BM sample. Results are represented as mean +- SEM. d Micrographs of representative BFU-E colonies differentiated from sorted BFU-E cells of NC and DBA UT patients on day 14 of the colony forming unit assay. Scale bars, 100 mum. See also Supplementary Fig. S1 , Tables S1 , 2 .

- Submitted by
- Invitrogen Antibodies (provider)
- Main image

- Experimental details
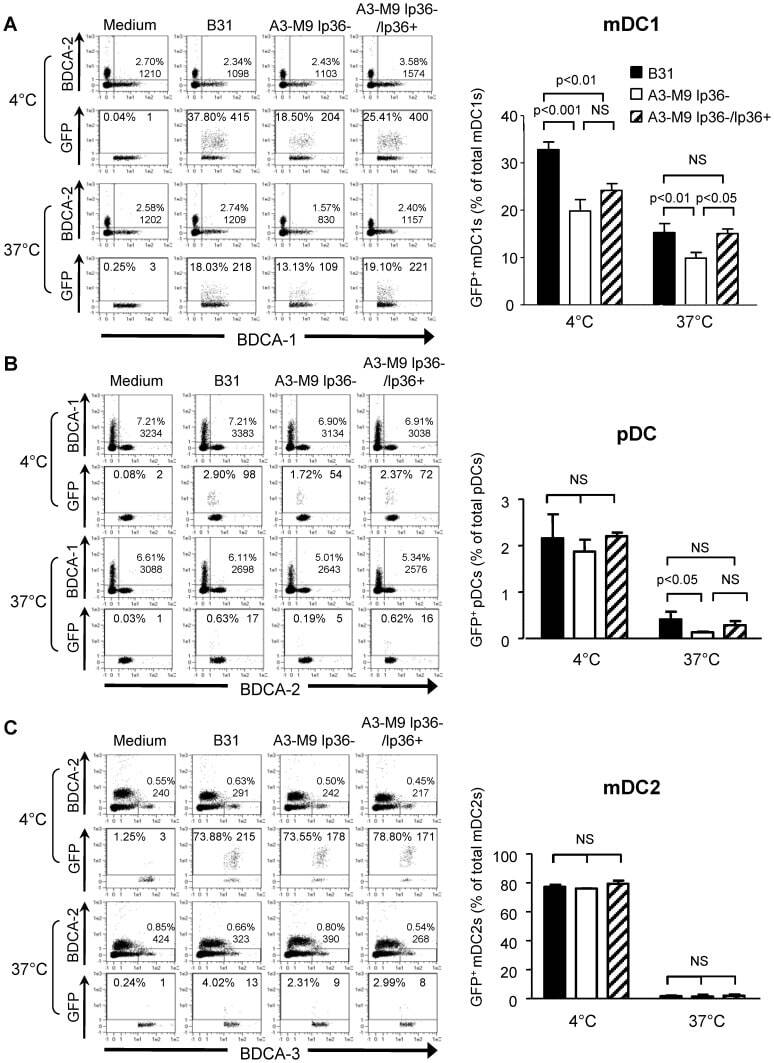
- Figure 5 lp36 contributes to the association of B. burgdorferi with specific populations of dendritic cells. Human PBMCs (4x10 6 ) were co-incubated with 4x10 7 GFP-tagged B31 (black bars), A3-M9 lp36- (white bars) or A3-M9 lp36-/lp36+ (cross-hatched bars) B. burgdorferi for 6 hours at 4degC or 37degC. The percentages of GFP + mDC1s (CD19 - CD3 - BDCA2 - BDCA1 + ) ( A ), pDCs (CD19 - CD3 - BDCA2 + BDCA1 - ) or ( B ) mDC2s (CD19 - CD3 - BDCA3 + BDCA2 - ) ( C ) were determined by multiparameter flow cytometry. Dot plots representing 500,000 collected events are provided to illustrate gating strategies (left). Column graphs represent the mean and standard deviation of three biological replicates (right). Statistical analysis was performed using a one-way ANOVA with a Tukey's post-test for multiple comparisons.
- Submitted by
- Invitrogen Antibodies (provider)
- Main image
- Experimental details
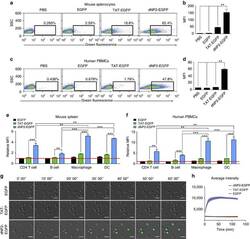
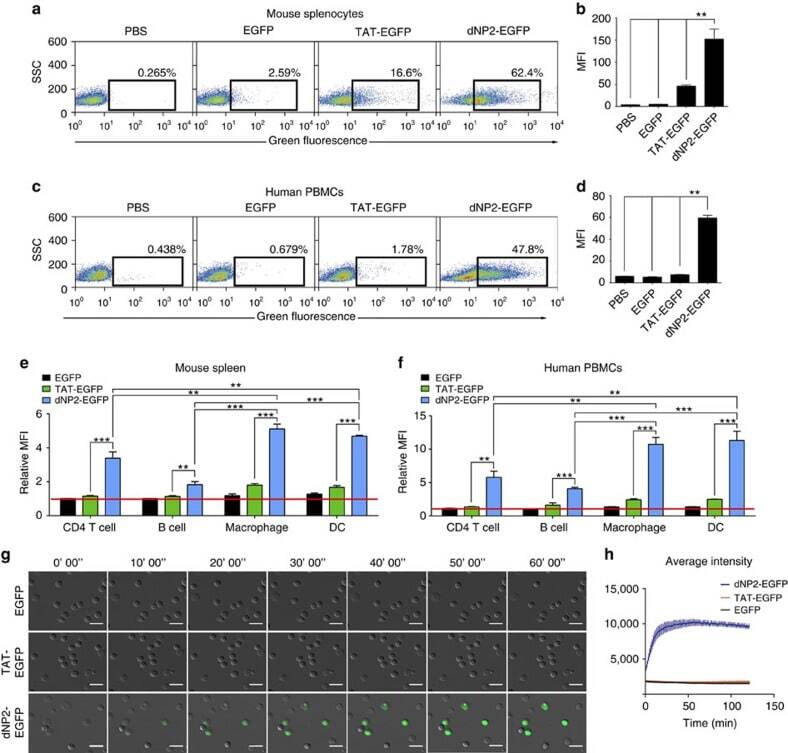
- Figure 2 Protein delivery efficiency of dNP2 in primary mouse and human immune cells. ( a , b ) Mouse primary splenocytes were isolated from 6-week-old female C57BL/6 mice and the cells were incubated with 5 muM EGFP, TAT- and dNP2-EGFP for 2 h. Intracellular fluorescence was analysed by flow cytometry and the data are represented as dot plots or mean fluorescence intensity (MFI) of the cells. ( c , d ) Human PBMCs were isolated from healthy donor blood and the cells were incubated with 5 muM EGFP, TAT-, dNP2-EGFP for 2 h. The data were analysed as described above. ( e ) Total splenocytes were incubated with 1 muM EGFP, TAT-, and dNP2-EGFP for 2 h. Cells were gated using markers specific for CD4 T cells (CD4 + ), B cells (CD19 + ), macrophages (CD11c lo CD11b hi F480 + ) and DCs (CD11c hi MHCII hi ). The EGFP signal in each cell population was then analysed by flow cytometric analysis. The relative MFI value was normalization to PBS treated cells. The red line indicates relative MFI of PBS-treated cells. ( f ) Total PBMCs were incubated with 1 muM EGFP, TAT-, and dNP2-EGFP for 2 h. Cells were gated with markers specific for CD4 T cells (CD4 + ), B cells (CD19 + ), macrophages (CD11b + ) and DCs (CD11c + ) and the data were then analysed as described above. ( g ) Time-lapse images of mouse CD4 T cells incubated with 1 muM EGFP, TAT- and dNP2-EGFP were acquired for 2 h (Scale bar, 15 mum) and ( h ) the average fluorescence intensities of 10 cells from each sample were calculate
- Submitted by
- Invitrogen Antibodies (provider)
- Main image
- Experimental details
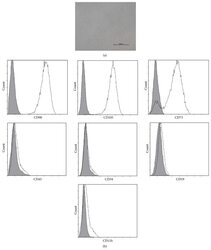
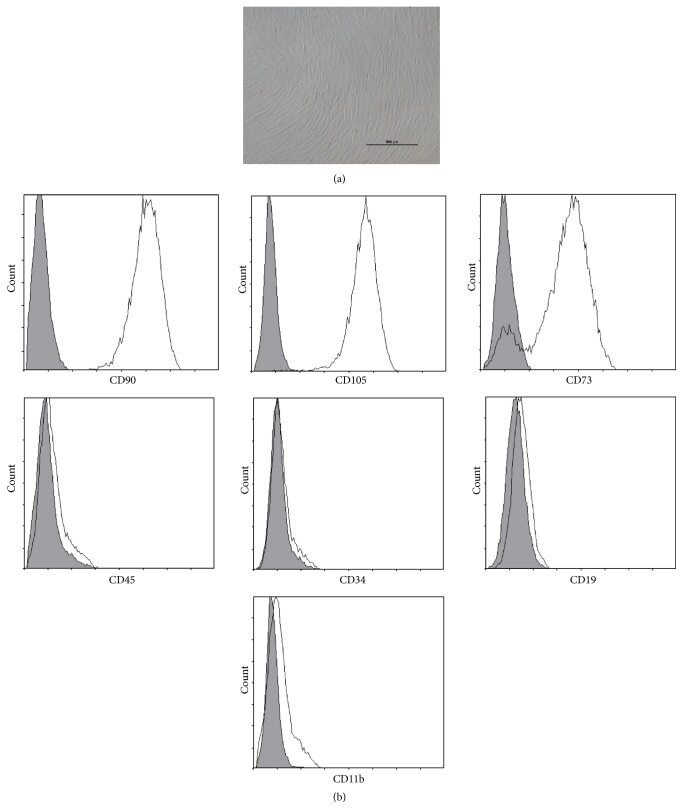
- Figure 1 Characteristics of BM-MSCs. (a) Representative morphology of BM-MSCs. Scale bar = 500 mu m. (b) Representative flow cytometric characterization of cell surface markers expressed on BM-MSCs. Isotypic controls were represented by the gray filled histograms.
- Submitted by
- Invitrogen Antibodies (provider)
- Main image

- Experimental details
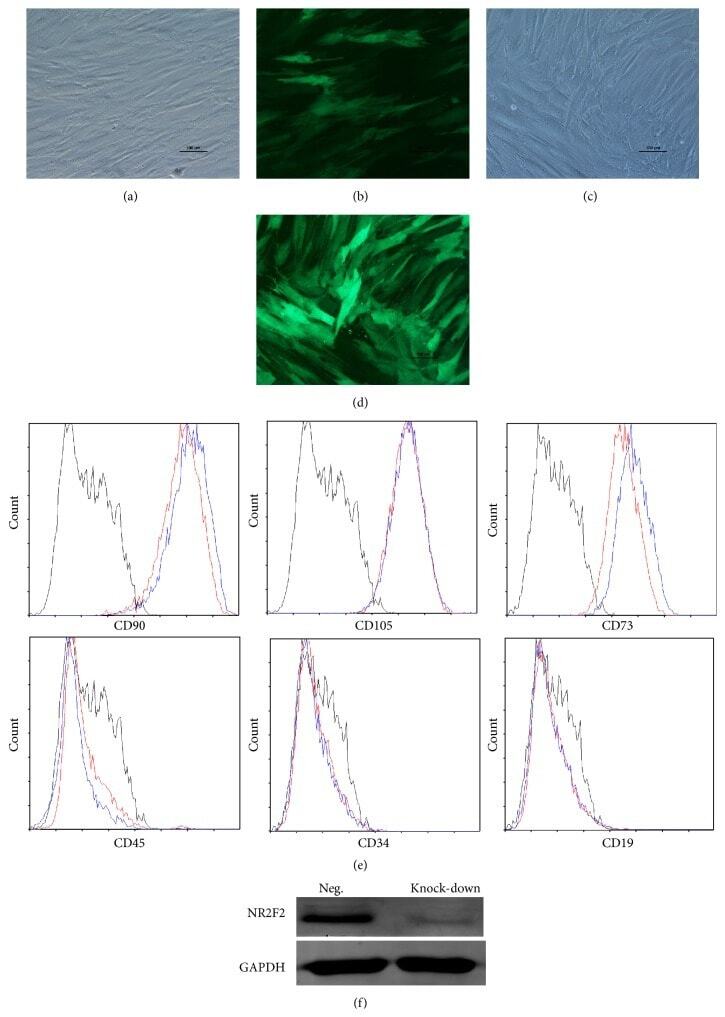
- Figure 2 Characteristics of transfected BM-MSCs. (a) Representative morphology of transfected BM-MSCs in negative control group. (b) More than 90% of BM-MSCs expressed GFP in negative control group. (c) Representative morphology of transfected BM-MSCs in knock-down group. (d) More than 90% of BM-MSCs expressed GFP in knock-down group. (e) Representative flow cytometric characterization of cell surface markers expressed on transfected BM-MSCs. Isotypic controls were represented by black line. The red line represented the negative control group and the blue line represented the knock-down group. (f) The knock-down of NR2F2 was confirmed by western blot analysis.
- Submitted by
- Invitrogen Antibodies (provider)
- Main image
- Experimental details
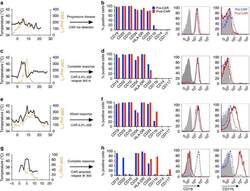
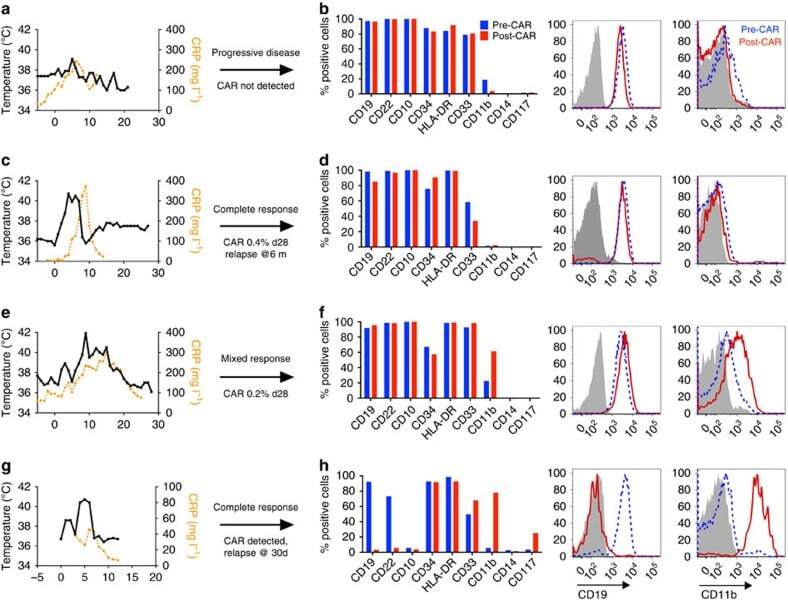
- Figure 1 Phenotypic alterations in clinical ALL samples following CD19 CAR. ( a , c , e , g ) Fever curves, CRP values and clinical response to CD19 CAR treatment. ( b , d , f , h ) Bar graph demonstrating percent of cells expressing cell surface markers by flow cytometry in the bone marrow, gated on leukaemic blasts, with representative flow cytometry histograms of CD19 and CD11b on the right (grey, control; blue, pre-CAR; red, post CAR). ( a , b ) Pre-CAR sample and day +30 post-CAR sample from a patient who did not experience CRS following CD19 CAR. ( c , d ) Pre-CAR and +180 days post-CAR samples from a patient with normal karyotype multiple relapsed ALL, who had a severe CRS followed by an MRD-negative complete response with CD19 CAR, with no CAR + cells persisting beyond 60 days. ( e , f ) Pre-CAR and day +30 post-CAR samples from a patient with normal karyotype ALL who experienced a mild CRS and CAR expansion, but had persistent disease. ( g , h ) Pre-CAR and post-CAR samples from an infant with MLL-rearranged ALL, treated with CD19-41BB-zeta CAR, who relapsed with myeloid blasts.
- Submitted by
- Invitrogen Antibodies (provider)
- Main image
- Experimental details
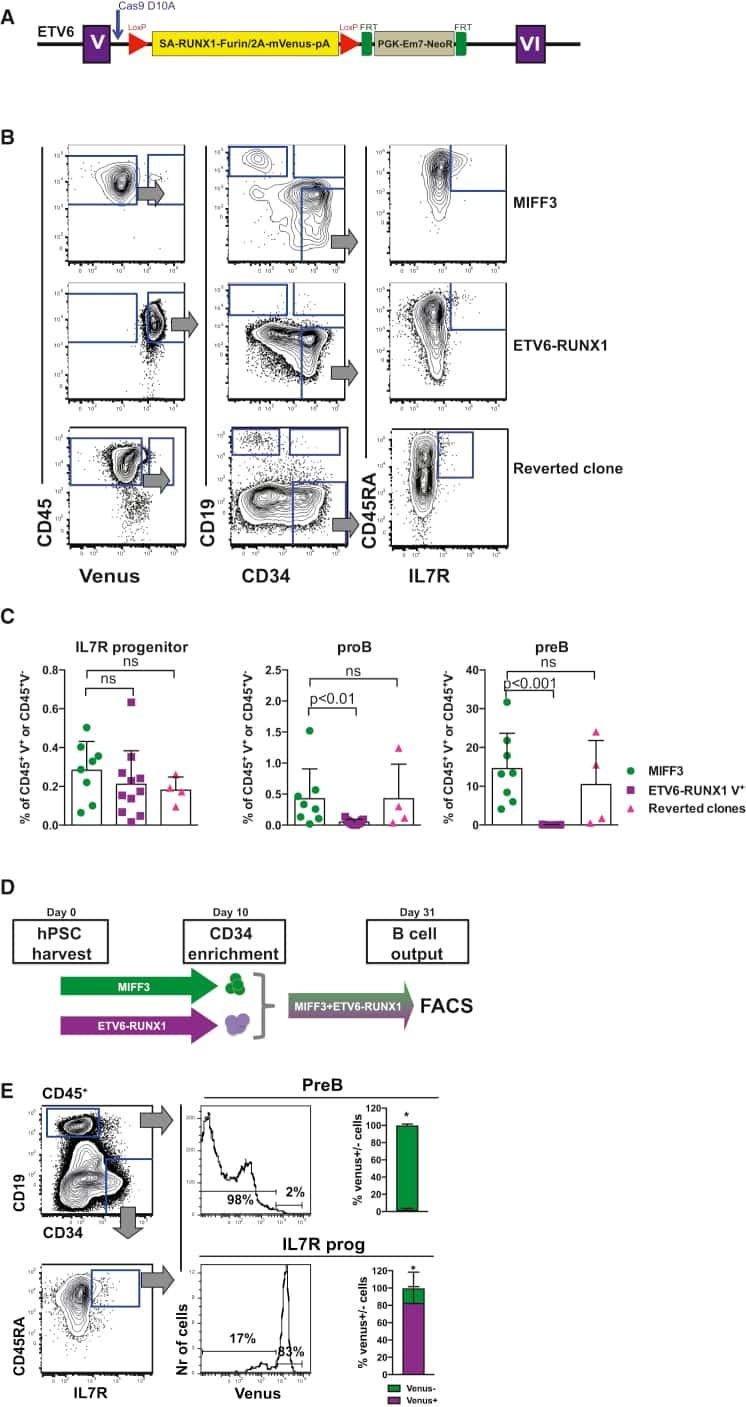
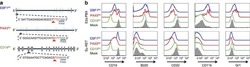
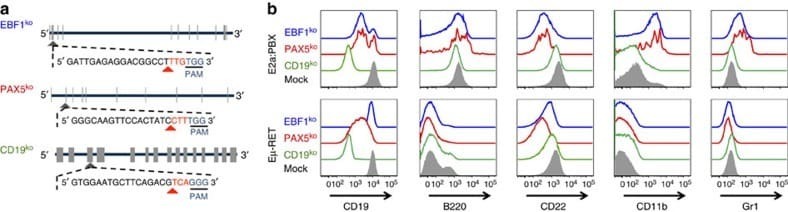
- Figure 5 Knockout of Pax5 or Ebf1 in E2a:PBX pre-B-cell ALL results in a phenotype mirroring relapse under CAR pressure. ( a ) Representative structure of Cd19 , Pax5 and Ebf1 , exons marked in tabs. Guide-RNA design for each knockout shown, with the CAS9 PAM site underlined, and cleavage site marked with a red arrowhead. ( b ) Flow cytometry plots for murine leukaemia cell lines E2a:PBX (upper panel) and Emu-RET 309 (bottom panel) following CRISPR/CAS9 knockout of CD19 (green), PAX5 (red), EBF1 (blue) or mock (grey shadow).
- Submitted by
- Invitrogen Antibodies (provider)
- Main image
- Experimental details
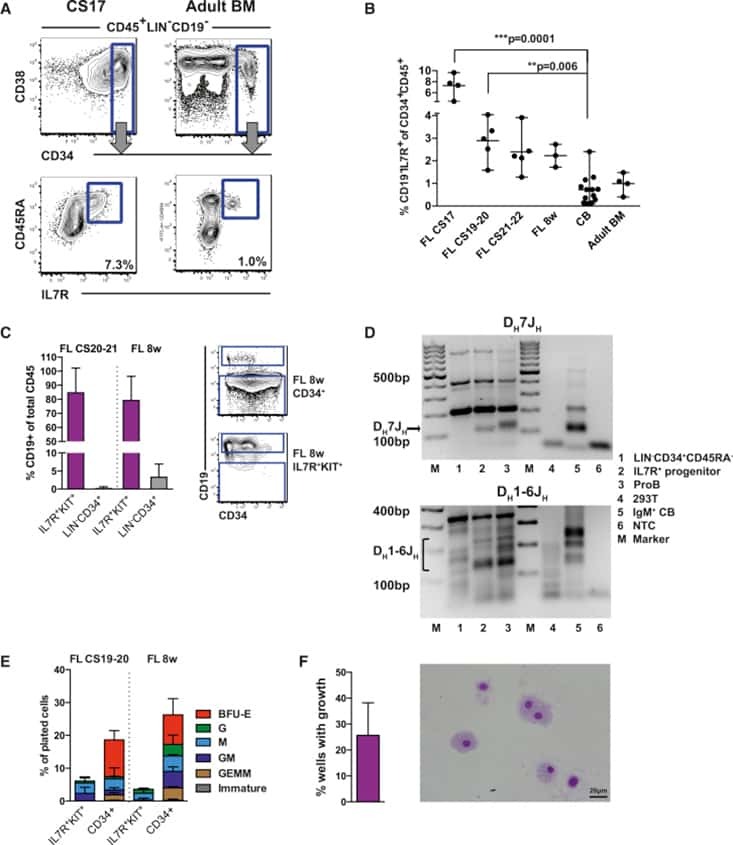
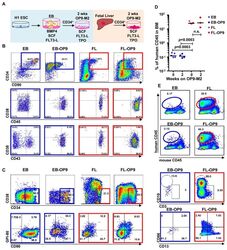
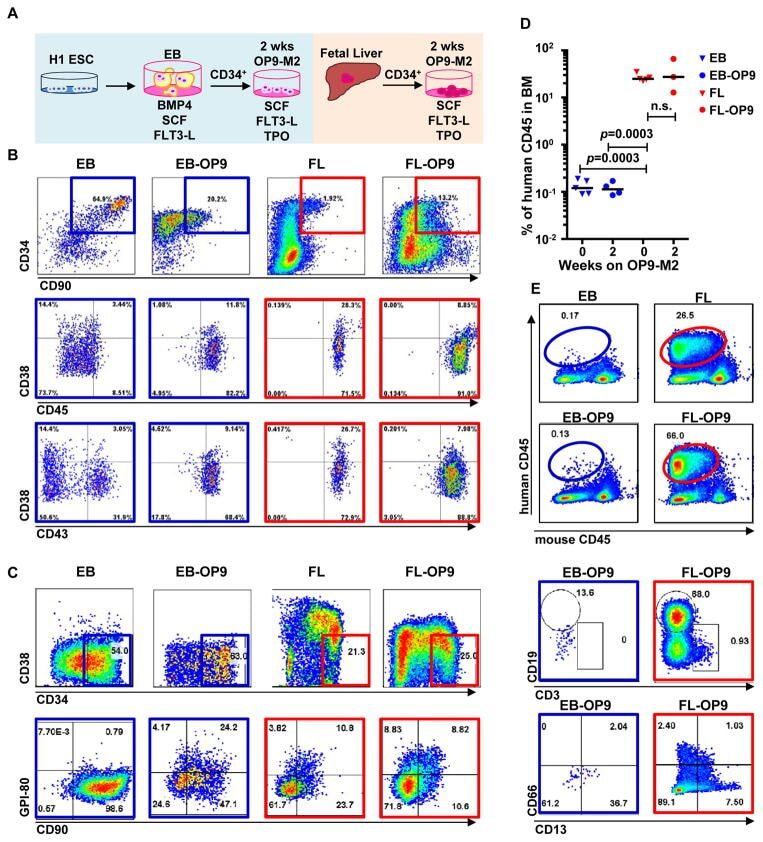
- Figure 1 Two-step culture of hESCs generates immunophenotypic HSPCs that engraft poorly (A) Culture and isolation strategy for differentiating H1 hESCs to HSPCs. (B) Representative FACS plots from 11 experiments staining for CD34, CD90, CD38, CD45 and CD43 on hESC-derived CD34 + cells isolated from 2 week EBs (EB), and after 2 week maturation culture on OP9-M2 (EB-OP9), compared to cells from second trimester foetal liver that were isolated directly (FL) or cultured on OP9-M2 (FL-OP9). (C) Representative FACS plots from 9 experiments staining for CD38, CD34, CD90 and human foetal HSC self-renewal marker GPI-80 on hESC- and FL-derived cells. (D) Human engraftment in NSG mice with hESC-derived and FL-derived CD34 + cells, before and after OP9-M2 co-culture (individual values and mean are shown, n=5 EB, n=4 EB-OP9 and FL, and n=3 FL-OP9 transplanted mice, statistical significance was calculated using the Wilcoxon Rank Sum test, see Supplementary Table 7 for statistics source data). (E) Representative FACS plots of showing human CD45 + fraction in the mouse BM 12 weeks post-transplantation. Multi-lineage engraftment is assessed by CD19 and CD3 (B-and T-lymphoid), and CD66 and CD13 (myeloid) stainings.
- Submitted by
- Invitrogen Antibodies (provider)
- Main image
- Experimental details
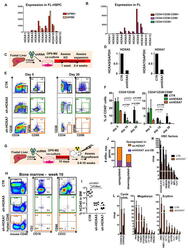
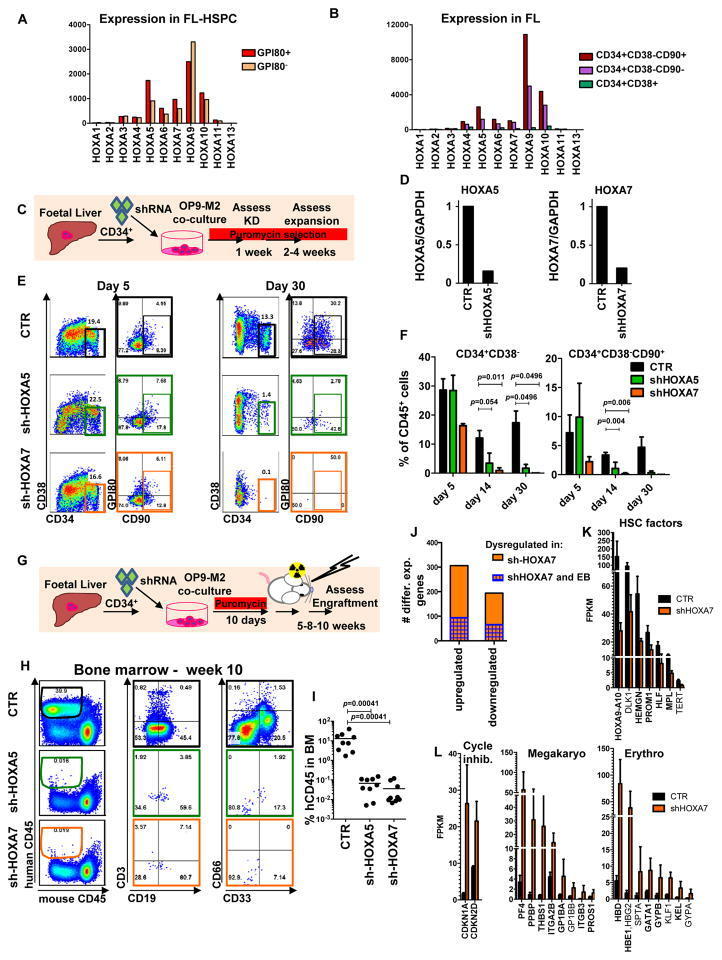
- Figure 4 Medial HOXA genes govern the function and identity of human foetal HSPCs (A, B) Microarray analysis of HOXA gene expression in CD34 + CD38 -/lo CD90 + GPI-80 + cells and their progeny (Mean values are shown, left, n=3 samples, GEO database GSE54316, and right, n=3 samples (CD34+CD38-CD90+) or 2 (CD34+CD38-CD90- and CD34+CD38-) GSE34974. (C) Schematic showing the strategy for lentiviral shRNA knockdown of HOXA5 or HOXA7 in FL-HSPCs. (D) Knockdown is confirmed using q-RT-PCR 1 week post-infection (mean +/- SD shown from n=3 different FL samples). (E) Representative FACS plots 30 days after HOXA5 or HOXA7 knockdown. (F) Quantification of HSPC subsets in empty-vector (CTR) and shRNA infected cells (shHOXA5 or shHOXA7) after 5, 14 and 30 days in culture (mean and SEM, n=6 independent experiments per condition for day 14 and n=3 for day 5 and 30). Statistical significance was assessed using Wilcoxon Signed Rank test. (G) Schematic showing the transplantation strategy with HOXA5 or HOXA7 knockdown FL-HSPCs. (H) Representative FACS plots from mouse BM 10 weeks post-transplantation assessing human CD45 + cells and multi-lineage engraftment (CD19 and CD3 for B-and T-lymphoid, and CD66 and CD33 for myeloid). (I) Quantification of human engraftment (n=9 mice per condition from 3 independent experiments Individual values and mean are shown.) Statistical significance was assessed using the Wilcoxon Rank Sum test (J) RNA-sequencing of HOXA7 knockdown FL-HSPCs at day 5 post-infectio
- Submitted by
- Invitrogen Antibodies (provider)
- Main image
- Experimental details
- Figure 5 Overexpression of medial HOXA genes enhances proliferative potential in FL-HSPCs but does not confer HSC properties to hESC-HSPCs (A) Schematic showing the strategy for constitutive lentiviral overexpression of HOXA5 or HOXA7 in FUGW vectors in FL-HSPCs. (B) Representative FACS plots of FUGW empty vector, HOXA5- or HOXA7- overexpressing FL-HSPCs. (C, D) Expansion of total FL cells (C) or HSPCs (D) transduced with HOXA5- or HOXA7- overexpression vectors or empty vector control (CTR), (mean and SEM values from n=3 independent experiments; statistical significance was assessed using the paired Student's t -test. (E) q-RT-PCR confirming overexpression in transduced HSPCs sorted 1 week post-infection (n=1 experiment with 2 pooled donors). (F) CFU-Cs from 2000 HSPCs sorted after day 10 of infection with vectors overexpressing HOXA5 or HOXA7 or FUGW empty vector control (mean and SD values shown from n=4 transductions from 2 independent experiments, p-values shown correspond to CTR vs. OE-HOXA7). (G) Schematic showing the strategy for lentiviral overexpression of HOXA5 and/or HOXA7 and/or HOXA9 in FUGW vectors in EB CD34 + cells. (H) Representative examples of FACS plots of EB CD34 + cells overexpressing HOXA5 or HOXA7 or a combination of HOXA5 , HOXA7 and HOXA9 . Un-transduced FL is shown as a control. (I) Quantification of CD34 + CD38 -/lo CD45 + haematopoietic cells from (H), mean from n=4 independent experiments for CTR and n=3 for HOXA5/7/9, HOXA5, and HOXA7 at da

- Submitted by
- Invitrogen Antibodies (provider)
- Main image
- Experimental details
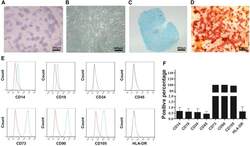
- Figure 2 CESCs Shared Features with BM-MSCs Regarding Morphology, Stem Cell Surface Markers, and Differentiation Ability (A) H&E staining of the tissue section. (B) Morphology of CESCs in agarose after seeding 6 weeks later. (C) Histologic section stained with Alcian blue of chondrified pellets in which CESCs formed in chondrogenic induction medium after 3 weeks. (D) Alizarin red staining of CESCs that underwent osteogenic induction for 3 weeks. (E) Immunophenotypic profile of stem cells in CESCs by flow cytometric analysis. The green lines indicate the fluorescence intensity of cells stained with the corresponding antibodies, and the red lines represent isotype-matched negative control cells. (F) Percentages of CESCs expressing different stem cell markers (n = 6 independent experiments). Data represent the mean +- SD.
