 Explore
 Validate
 Learn
Learn Flow cytometry
Antibody data
- Antibody Data
- Antigen structure
- References [23]
- Comments [0]
- Validations
- Flow cytometry [2]
- Other assay [32]
Submit
Validation data
Reference
Comment
Report error
- Product number
- 46-0199-42 - Provider product page

- Provider
- Invitrogen Antibodies
- Product name
- CD19 Monoclonal Antibody (HIB19), PerCP-eFluor™ 710, eBioscience™
- Antibody type
- Monoclonal
- Antigen
- Other
- Description
- Description: The HIB19 monoclonal antibody reacts with human CD19, a 95 kDa transmembrane glycoprotein. CD19 is expressed by B cells during all stages of development excluding the terminally differentiated plasma cells. Follicular dendritic cells also express CD19. Together CD21, CD81, Leu13, MHC class II, and CD19 form a multimolecular complex that associates with BCR. Signaling through CD19 induces tyrosine phosphorylation, calcium flux and proliferation of B cells. The SJ25C1 antibody and the HIB19 monoclonal antibody recognize overlapping epitopes Applications Reported: This HIB19 antibody has been reported for use in flow cytometric analysis. Applications Tested: This HIB19 antibody has been pre-diluted and tested by flow cytometric analysis of normal human peripheral blood cells. This may be used at 5 µL (0.06 µg) per test. A test is defined as the amount (µg) of antibody that will stain a cell sample in a final volume of 100 µL. Cell number should be determined empirically but can range from 10^5 to 10^8 cells/test. PerCP-eFluor 710 emits at 710 nm and is excited with the blue laser (488 nm); it can be used in place of PerCP-Cyanine5.5. We recommend using a 710/50 bandpass filter, however, the 695/40 bandpass filter is an acceptable alternative. Please make sure that your instrument is capable of detecting this fluorochrome. Light sensitivity: This tandem dye is sensitive to photo-induced oxidation. Please protect this vial and stained samples from light. Fixation: Samples can be stored in IC Fixation Buffer (Product # 00-8222-49) (100 µL of cell sample + 100 µL of IC Fixation Buffer) or 1-step Fix/Lyse Solution (Product # 00-5333-57) for up to 3 days in the dark at 4°C with minimal impact on brightness and FRET efficiency/compensation. Some generalizations regarding fluorophore performance after fixation can be made, but clone specific performance should be determined empirically. Excitation: 488 nm; Emission: 710 nm; Laser: Blue Laser.
- Reactivity
- Human
- Host
- Mouse
- Isotype
- IgG
- Antibody clone number
- HIB19
- Vial size
- 100 Tests
- Concentration
- 5 μL/Test
- Storage
- 4°C, store in dark, DO NOT FREEZE!
Submitted references Decoding the pathogenesis of Diamond-Blackfan anemia using single-cell RNA-seq.
Exosomes derived from stem cells of human deciduous exfoliated teeth inhibit angiogenesis in vivo and in vitro via the transfer of miR-100-5p and miR-1246.
Increased TNF-α Initiates Cytoplasmic Vacuolization in Whole Blood Coculture with Dengue Virus.
SARS-CoV-2 infection paralyzes cytotoxic and metabolic functions of the immune cells.
Th2 Biased Immunity With Altered B Cell Profiles in Circulation of Patients With Sporotrichosis Caused by Sporothrix globosa.
Human T Cells Expressing a CD19 CAR-T Receptor Provide Insights into Mechanisms of Human CD19-Positive β Cell Destruction.
The Act1 D10N missense variant impairs CD40 signaling in human B-cells.
Peli1 negatively regulates noncanonical NF-κB signaling to restrain systemic lupus erythematosus.
BNIP3/Bcl-2-mediated apoptosis induced by cyclic tensile stretch in human cartilage endplate-derived stem cells.
A Human IPS Model Implicates Embryonic B-Myeloid Fate Restriction as Developmental Susceptibility to B Acute Lymphoblastic Leukemia-Associated ETV6-RUNX1.
Limited nucleotide pools restrict Epstein-Barr virus-mediated B-cell immortalization.
Human Secretory IgM Emerges from Plasma Cells Clonally Related to Gut Memory B Cells and Targets Highly Diverse Commensals.
A Member of the Nuclear Receptor Superfamily, Designated as NR2F2, Supports the Self-Renewal Capacity and Pluripotency of Human Bone Marrow-Derived Mesenchymal Stem Cells.
Medial HOXA genes demarcate haematopoietic stem cell fate during human development.
CD19 CAR immune pressure induces B-precursor acute lymphoblastic leukaemia lineage switch exposing inherent leukaemic plasticity.
MIF Plays a Key Role in Regulating Tissue-Specific Chondro-Osteogenic Differentiation Fate of Human Cartilage Endplate Stem Cells under Hypoxia.
dNP2 is a blood-brain barrier-permeable peptide enabling ctCTLA-4 protein delivery to ameliorate experimental autoimmune encephalomyelitis.
Induction of type I and type III interferons by Borrelia burgdorferi correlates with pathogenesis and requires linear plasmid 36.
Aberrant expression of SALL4 in acute B cell lymphoblastic leukemia: mechanism, function, and implication for a potential novel therapeutic target.
Comparative study of the cytokine/chemokine response in children with differing disease severity in enterovirus 71-induced hand, foot, and mouth disease.
A pathobiological role of the insulin receptor in chronic lymphocytic leukemia.
B cells and monocytes from patients with active multiple sclerosis exhibit increased surface expression of both HERV-H Env and HERV-W Env, accompanied by increased seroreactivity.
Sepsis-induced human lymphocyte apoptosis and cytokine production in "humanized" mice.
Wang B, Wang C, Wan Y, Gao J, Ma Y, Zhang Y, Tong J, Zhang Y, Liu J, Chang L, Xu C, Shen B, Chen Y, Jiang E, Kurita R, Nakamura Y, Lim KC, Engel JD, Zhou J, Cheng T, Zhu X, Zhu P, Shi L
Cell discovery 2022 May 10;8(1):41
Cell discovery 2022 May 10;8(1):41
Exosomes derived from stem cells of human deciduous exfoliated teeth inhibit angiogenesis in vivo and in vitro via the transfer of miR-100-5p and miR-1246.
Liu P, Zhang Q, Mi J, Wang S, Xu Q, Zhuang D, Chen W, Liu C, Zhang L, Guo J, Wu X
Stem cell research & therapy 2022 Mar 3;13(1):89
Stem cell research & therapy 2022 Mar 3;13(1):89
Increased TNF-α Initiates Cytoplasmic Vacuolization in Whole Blood Coculture with Dengue Virus.
Satria RD, Huang TW, Jhan MK, Shen TJ, Tseng PC, Wang YT, Yang ZY, Hsing CH, Lin CF
Journal of immunology research 2021;2021:6654617
Journal of immunology research 2021;2021:6654617
SARS-CoV-2 infection paralyzes cytotoxic and metabolic functions of the immune cells.
Singh Y, Trautwein C, Fendel R, Krickeberg N, Berezhnoy G, Bissinger R, Ossowski S, Salker MS, Casadei N, Riess O, Deutsche COVID-19 OMICS Initiate (DeCOI)
Heliyon 2021 Jun;7(6):e07147
Heliyon 2021 Jun;7(6):e07147
Th2 Biased Immunity With Altered B Cell Profiles in Circulation of Patients With Sporotrichosis Caused by Sporothrix globosa.
Zu J, Yao L, Song Y, Cui Y, Guan M, Chen R, Zhen Y, Li S
Frontiers in immunology 2020;11:570888
Frontiers in immunology 2020;11:570888
Human T Cells Expressing a CD19 CAR-T Receptor Provide Insights into Mechanisms of Human CD19-Positive β Cell Destruction.
Ma H, Jeppesen JF, Jaenisch R
Cell reports. Medicine 2020 Sep 22;1(6):100097
Cell reports. Medicine 2020 Sep 22;1(6):100097
The Act1 D10N missense variant impairs CD40 signaling in human B-cells.
Yu N, Lambert S, Bornstein J, Nair RP, Enerbäck C, Elder JT
Genes and immunity 2019 Jan;20(1):23-31
Genes and immunity 2019 Jan;20(1):23-31
Peli1 negatively regulates noncanonical NF-κB signaling to restrain systemic lupus erythematosus.
Liu J, Huang X, Hao S, Wang Y, Liu M, Xu J, Zhang X, Yu T, Gan S, Dai D, Luo X, Lu Q, Mao C, Zhang Y, Shen N, Li B, Huang M, Zhu X, Jin J, Cheng X, Sun SC, Xiao Y
Nature communications 2018 Mar 19;9(1):1136
Nature communications 2018 Mar 19;9(1):1136
BNIP3/Bcl-2-mediated apoptosis induced by cyclic tensile stretch in human cartilage endplate-derived stem cells.
Yuan C, Pu L, He Z, Wang J
Experimental and therapeutic medicine 2018 Jan;15(1):235-241
Experimental and therapeutic medicine 2018 Jan;15(1):235-241
A Human IPS Model Implicates Embryonic B-Myeloid Fate Restriction as Developmental Susceptibility to B Acute Lymphoblastic Leukemia-Associated ETV6-RUNX1.
Böiers C, Richardson SE, Laycock E, Zriwil A, Turati VA, Brown J, Wray JP, Wang D, James C, Herrero J, Sitnicka E, Karlsson S, Smith AJH, Jacobsen SEW, Enver T
Developmental cell 2018 Feb 5;44(3):362-377.e7
Developmental cell 2018 Feb 5;44(3):362-377.e7
Limited nucleotide pools restrict Epstein-Barr virus-mediated B-cell immortalization.
Hafez AY, Messinger JE, McFadden K, Fenyofalvi G, Shepard CN, Lenzi GM, Kim B, Luftig MA
Oncogenesis 2017 Jun 12;6(6):e349
Oncogenesis 2017 Jun 12;6(6):e349
Human Secretory IgM Emerges from Plasma Cells Clonally Related to Gut Memory B Cells and Targets Highly Diverse Commensals.
Magri G, Comerma L, Pybus M, Sintes J, Lligé D, Segura-Garzón D, Bascones S, Yeste A, Grasset EK, Gutzeit C, Uzzan M, Ramanujam M, van Zelm MC, Albero-González R, Vazquez I, Iglesias M, Serrano S, Márquez L, Mercade E, Mehandru S, Cerutti A
Immunity 2017 Jul 18;47(1):118-134.e8
Immunity 2017 Jul 18;47(1):118-134.e8
A Member of the Nuclear Receptor Superfamily, Designated as NR2F2, Supports the Self-Renewal Capacity and Pluripotency of Human Bone Marrow-Derived Mesenchymal Stem Cells.
Zhu N, Wang H, Wang B, Wei J, Shan W, Feng J, Huang H
Stem cells international 2016;2016:5687589
Stem cells international 2016;2016:5687589
Medial HOXA genes demarcate haematopoietic stem cell fate during human development.
Dou DR, Calvanese V, Sierra MI, Nguyen AT, Minasian A, Saarikoski P, Sasidharan R, Ramirez CM, Zack JA, Crooks GM, Galic Z, Mikkola HK
Nature cell biology 2016 Jun;18(6):595-606
Nature cell biology 2016 Jun;18(6):595-606
CD19 CAR immune pressure induces B-precursor acute lymphoblastic leukaemia lineage switch exposing inherent leukaemic plasticity.
Jacoby E, Nguyen SM, Fountaine TJ, Welp K, Gryder B, Qin H, Yang Y, Chien CD, Seif AE, Lei H, Song YK, Khan J, Lee DW, Mackall CL, Gardner RA, Jensen MC, Shern JF, Fry TJ
Nature communications 2016 Jul 27;7:12320
Nature communications 2016 Jul 27;7:12320
MIF Plays a Key Role in Regulating Tissue-Specific Chondro-Osteogenic Differentiation Fate of Human Cartilage Endplate Stem Cells under Hypoxia.
Yao Y, Deng Q, Song W, Zhang H, Li Y, Yang Y, Fan X, Liu M, Shang J, Sun C, Tang Y, Jin X, Liu H, Huang B, Zhou Y
Stem cell reports 2016 Aug 9;7(2):249-62
Stem cell reports 2016 Aug 9;7(2):249-62
dNP2 is a blood-brain barrier-permeable peptide enabling ctCTLA-4 protein delivery to ameliorate experimental autoimmune encephalomyelitis.
Lim S, Kim WJ, Kim YH, Lee S, Koo JH, Lee JA, Yoon H, Kim DH, Park HJ, Kim HM, Lee HG, Yun Kim J, Lee JU, Hun Shin J, Kyun Kim L, Doh J, Kim H, Lee SK, Bothwell ALM, Suh M, Choi JM
Nature communications 2015 Sep 15;6:8244
Nature communications 2015 Sep 15;6:8244
Induction of type I and type III interferons by Borrelia burgdorferi correlates with pathogenesis and requires linear plasmid 36.
Krupna-Gaylord MA, Liveris D, Love AC, Wormser GP, Schwartz I, Petzke MM
PloS one 2014;9(6):e100174
PloS one 2014;9(6):e100174
Aberrant expression of SALL4 in acute B cell lymphoblastic leukemia: mechanism, function, and implication for a potential novel therapeutic target.
Ueno S, Lu J, He J, Li A, Zhang X, Ritz J, Silberstein LE, Chai L
Experimental hematology 2014 Apr;42(4):307-316.e8
Experimental hematology 2014 Apr;42(4):307-316.e8
Comparative study of the cytokine/chemokine response in children with differing disease severity in enterovirus 71-induced hand, foot, and mouth disease.
Zhang Y, Liu H, Wang L, Yang F, Hu Y, Ren X, Li G, Yang Y, Sun S, Li Y, Chen X, Li X, Jin Q
PloS one 2013;8(6):e67430
PloS one 2013;8(6):e67430
A pathobiological role of the insulin receptor in chronic lymphocytic leukemia.
Saiya-Cork K, Collins R, Parkin B, Ouillette P, Kuizon E, Kujawski L, Erba H, Campagnaro E, Shedden K, Kaminski M, Malek SN
Clinical cancer research : an official journal of the American Association for Cancer Research 2011 May 1;17(9):2679-92
Clinical cancer research : an official journal of the American Association for Cancer Research 2011 May 1;17(9):2679-92
B cells and monocytes from patients with active multiple sclerosis exhibit increased surface expression of both HERV-H Env and HERV-W Env, accompanied by increased seroreactivity.
Brudek T, Christensen T, Aagaard L, Petersen T, Hansen HJ, Møller-Larsen A
Retrovirology 2009 Nov 16;6:104
Retrovirology 2009 Nov 16;6:104
Sepsis-induced human lymphocyte apoptosis and cytokine production in "humanized" mice.
Unsinger J, McDonough JS, Shultz LD, Ferguson TA, Hotchkiss RS
Journal of leukocyte biology 2009 Aug;86(2):219-27
Journal of leukocyte biology 2009 Aug;86(2):219-27
No comments: Submit comment
Supportive validation
- Submitted by
- Invitrogen Antibodies (provider)
- Main image
- Experimental details
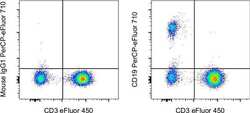
- Normal human peripheral blood cells were stained with CD3 Monoclonal Antibody, eFluor 450 (Product # 48-0038-42) and Mouse IgG1 kappa Isotype Control, PerCP-eFluor 710 (Product # 46-4714-82) (left) or CD19 Monoclonal Antibody, PerCP-eFluor 710 (right). Cells in the lymphocyte gate were used for analysis.

- Submitted by
- Invitrogen Antibodies (provider)
- Main image
- Experimental details
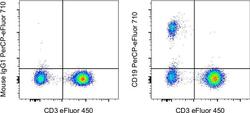
- Normal human peripheral blood cells were stained with CD3 Monoclonal Antibody, eFluor 450 (Product # 48-0038-42) and Mouse IgG1 kappa Isotype Control, PerCP-eFluor 710 (Product # 46-4714-82) (left) or CD19 Monoclonal Antibody, PerCP-eFluor 710 (right). Cells in the lymphocyte gate were used for analysis.

Supportive validation
- Submitted by
- Invitrogen Antibodies (provider)
- Main image

- Experimental details
- NULL
- Submitted by
- Invitrogen Antibodies (provider)
- Main image
- Experimental details
- NULL
- Submitted by
- Invitrogen Antibodies (provider)
- Main image

- Experimental details
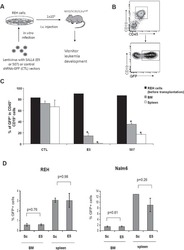
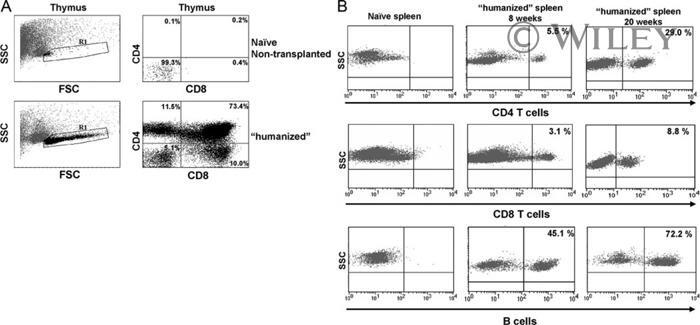
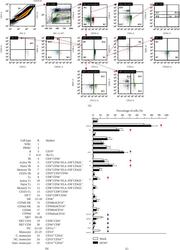
- 2. Quantification of human lymphocytes in thymus and spleen. (A) Isolated thymocytes were stained for anti-hCD4 and anti-hCD8 to characterize the distribution of single-positive, double-positive, and double-negative cell populations (images are representative of three mice/group). (B) Spleens were harvested at 8 weeks or 20 weeks postadoptive transfer, respectively. Splenocytes were stained for the human surface markers CD4, CD8, and CD19, and distribution was determined. One representative flow cytometry figure is shown for each stain. Table 1 indicates the number of investigated animals, the average percentage of positive cells for each stain, as well as the maximum and minimum percentage detected.
- Submitted by
- Invitrogen Antibodies (provider)
- Main image
- Experimental details
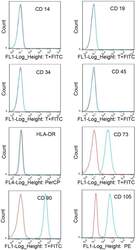
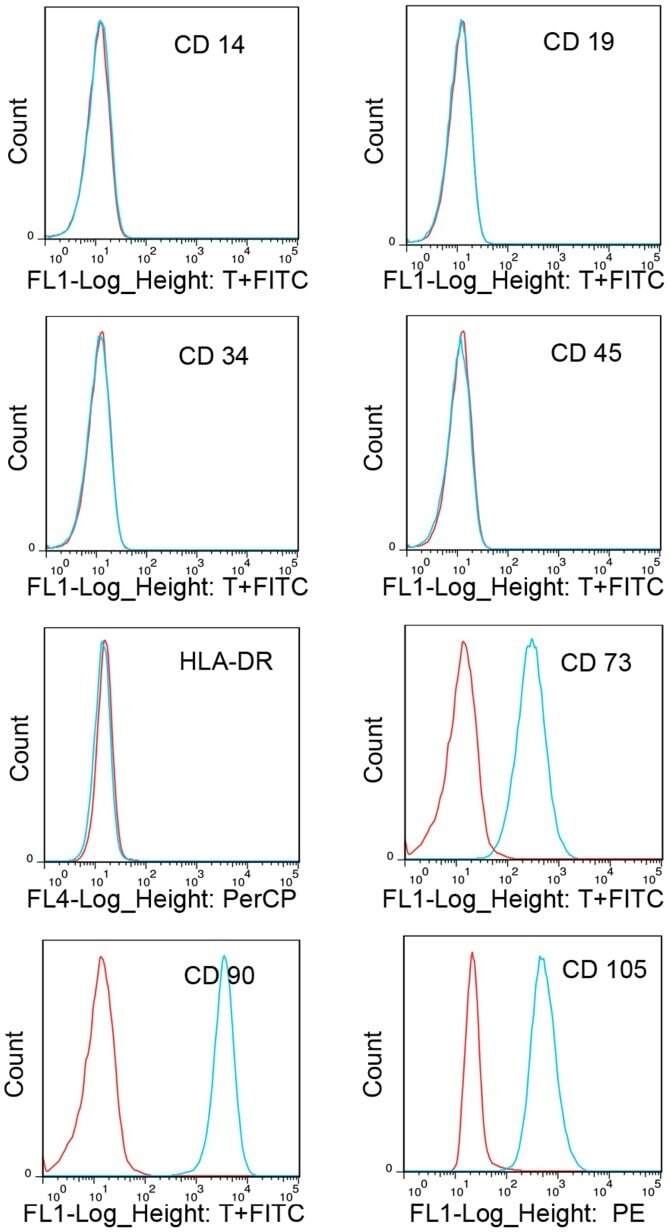
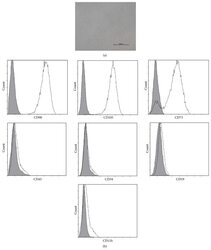
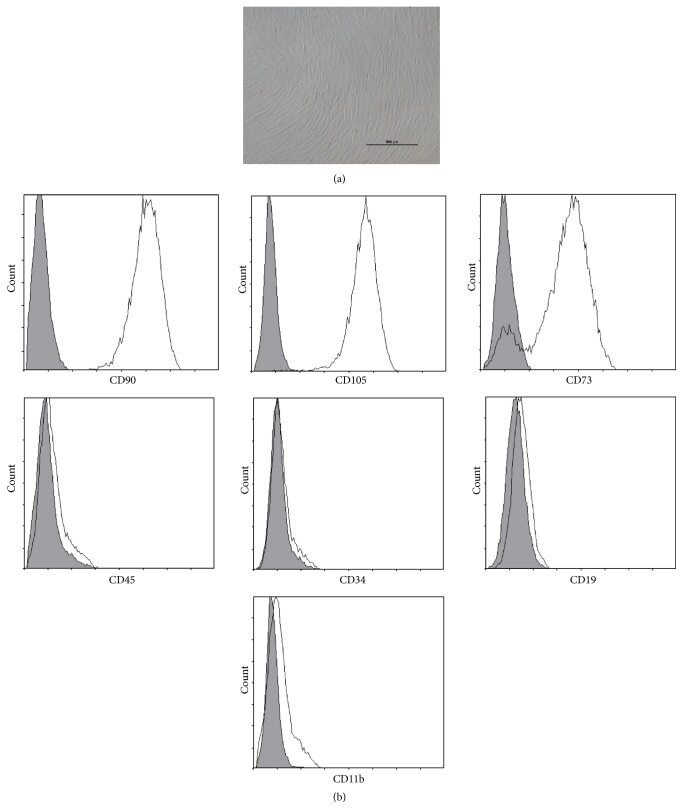
- Figure 1. Immunophenotypic profile of cultured cartilage endplate-derived stem cells. The blue lines represent the fluorescence intensity of cells stained with the indicated antibodies and the red lines represent the negative controls cells, which were stained with a non-immunoreactive isotype control antibody. FITC, fluorescein isothiocyanate; PerCP, peridinin chlorophyll; PE, phycoerythrin; HLA-DR, human leukocyte antigen-antigen D related.
- Submitted by
- Invitrogen Antibodies (provider)
- Main image
- Experimental details
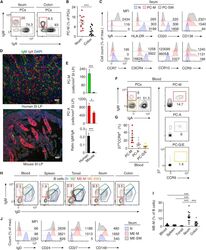
- Figure 1 Human PC-Ms Accumulate in the Gut together with ME-M B Cells and Include a Circulating Counterpart Expressing Gut-Homing Receptors (A) Flow cytometry (FCM) of IgM and IgA on CD19 + CD38 hi CD10 - PCs from human ileum and colon. (B) Frequency of PC-Ms among total PCs, assessed by FCM. (C) FCM of selected surface molecules on naive (N) B cells, PC-Ms, and switched PCs (PC-SW) from human ileum. Numbers indicate mean fluorescence intensity (MFI). (D) Immunofluorescence analysis (IFA) of IgM (green), IgA (red), and DNA (blue) in human ileum and mouse small intestine (SI) lamina propria (LP). Original magnification, 20x. Scale bars, 50 mum. (E) Number of PC-Ms (top), PC-As (center) per mm 2 of LP, and PC-M/PC-A ratio (bottom) from human or mouse SI assessed following tissue IFA. Data summarize six different tissue samples where at least four high-power microscopic fields were analyzed. (F and G) Representative FCM (F) and frequency (G) of beta7 + CCR9 + cells in human circulating PC-Ms, PC-As, and PC-G/Es. (H) Representative FCM showing IgM versus IgD staining on CD19 + CD38 - CD10 - B cells from different human tissues. (I) Frequency of ME-M B cells from tissues shown in (H). (J) FCM of IgD, CD24, CD27, and CD148 on naive, ME-M, and ME-SW B cells from ileum. Data show one representative result (A, F, H) of 12 (B), 8 (G), or 52 (I) experiments or are from one experiment of at least 3 with similar results (C, D, J). Results are presented as mean +- SEM; two-tailed unpaired
- Submitted by
- Invitrogen Antibodies (provider)
- Main image

- Experimental details
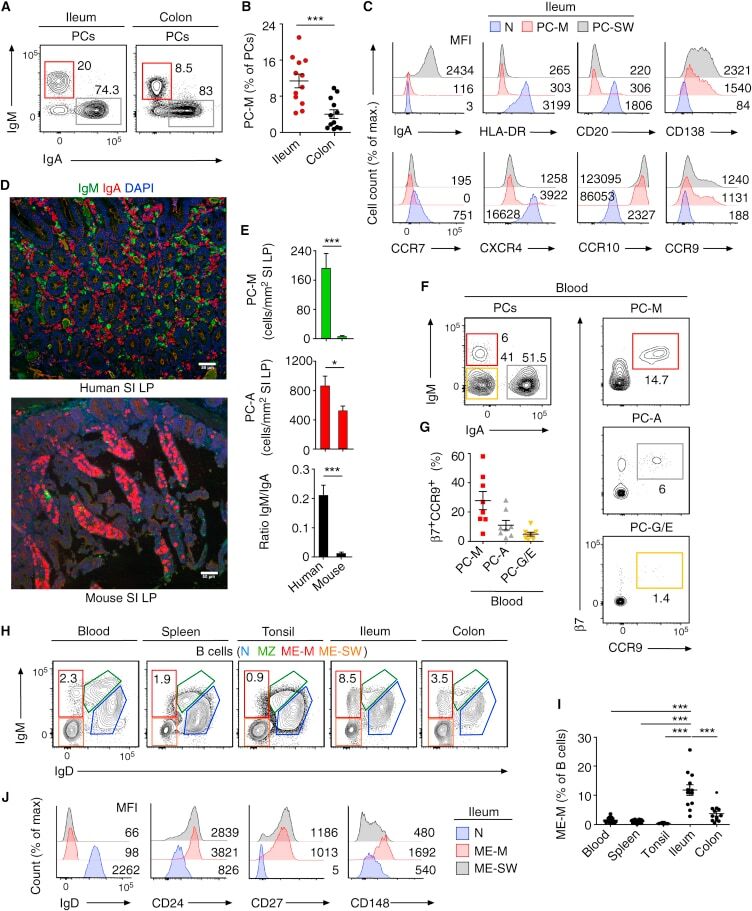
- Figure 5 Supplementation with purine nucleosides alone rescues EBV-induced growth arrest. ( a ) Schematic demonstrating staining, infection and sorting protocol to separate proliferating, then arrested (PA) from proliferating, then proliferating further (PP) cells within the early proliferating period. ( b ) Quantification of individual deoxyribonucleotide pools, including dATP, dGTP, dCTP and TTP measured from sorted PA cells (gray) and PP cells (black). ( c ) Percentage of proliferating CD19 + B cells was determined for early proliferating infected B cells and LCLs that were treated with DMSO (black) or supplemented with 30 mu M purine nucleosides (AG) (gray) at the time of infection. The data were analyzed by FACS at day 14 post infection. Error bars represent s.e.m. of three independent donors. ( d ) Quantification of EBV-infected B-cell outgrowth following PBMC infection in the presence of DMSO (black) or 30 mu M purine nucleosides (AG) (red) at time of infection similar to experiments performed in Figure 4 f and g. ( d , inset) Fold change of the transformation efficiency.
- Submitted by
- Invitrogen Antibodies (provider)
- Main image

- Experimental details
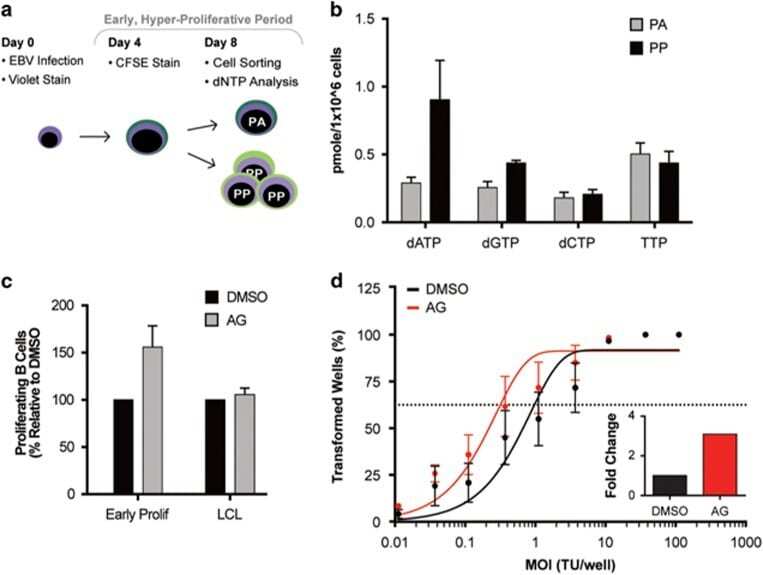
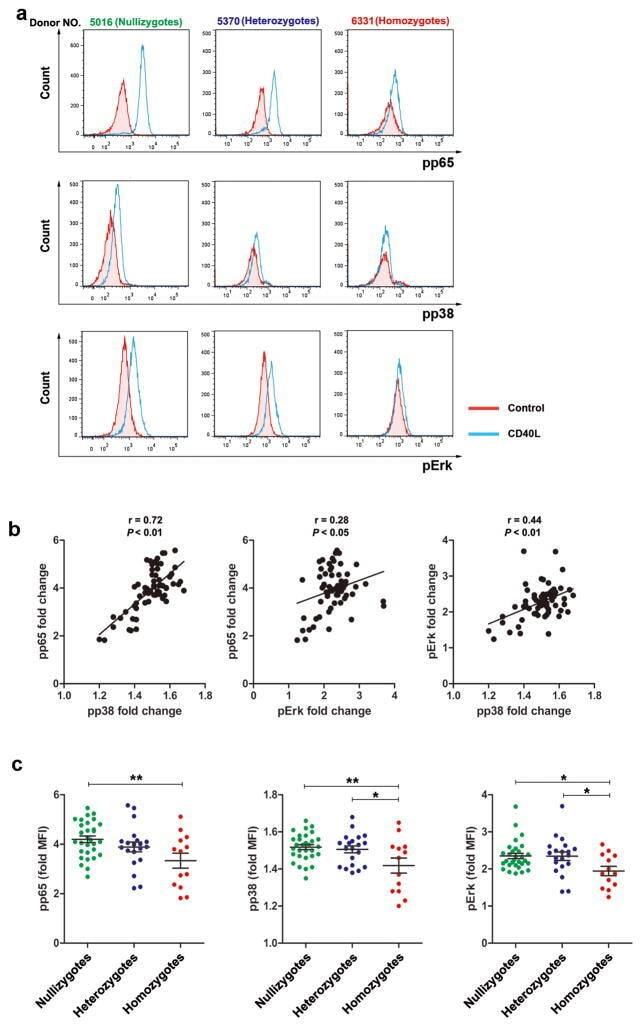
- Figure 4 D10N impairs CD40L-induced p65, p38 and Erk phosphorylation in PBMC-derived B-cells. PBMCs were cultured with (blue curves) or without (red shadow) 100 ng/ml CD40L for 15 minutes, followed by phospho-flow cytometric analysis of pp65, pp38 and pErk within the CD19 + gate. ( a ) Representative histograms (from one of two experiments performed for each genotype) are presented for PBMC-derived B-cells from Act1 D10N izygous (left panels), heterozygous (middle panels), and homozygous (right panels) individuals. ( b ) Correlations between MFI values for pp65, pp38 and pErk in stimulated CD19 + B-cells for all tested individuals (n = 63), Data are expressed as fold-change increases. Pearson correlations between pp65 and pp38, pp65 and pErk, pErk and pp38 were performed. Each symbol represents two experiments averaged for one donor ( c ) Phosphorylation of p65, p38 and Erk in B-cells from izygous, heterozygous, and homozygous groups in response to CD40L were expressed as fold MFI. Each symbol represents one individual donor. Summary data represented by horizontal lines represent mean +- SEM. * P < 0.05, ** P < 0.01, as assessed by one-way analysis of variance followed by Dunnett''s post hoc test.
- Submitted by
- Invitrogen Antibodies (provider)
- Main image
- Experimental details
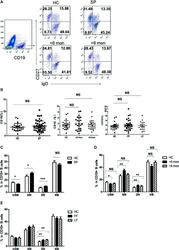
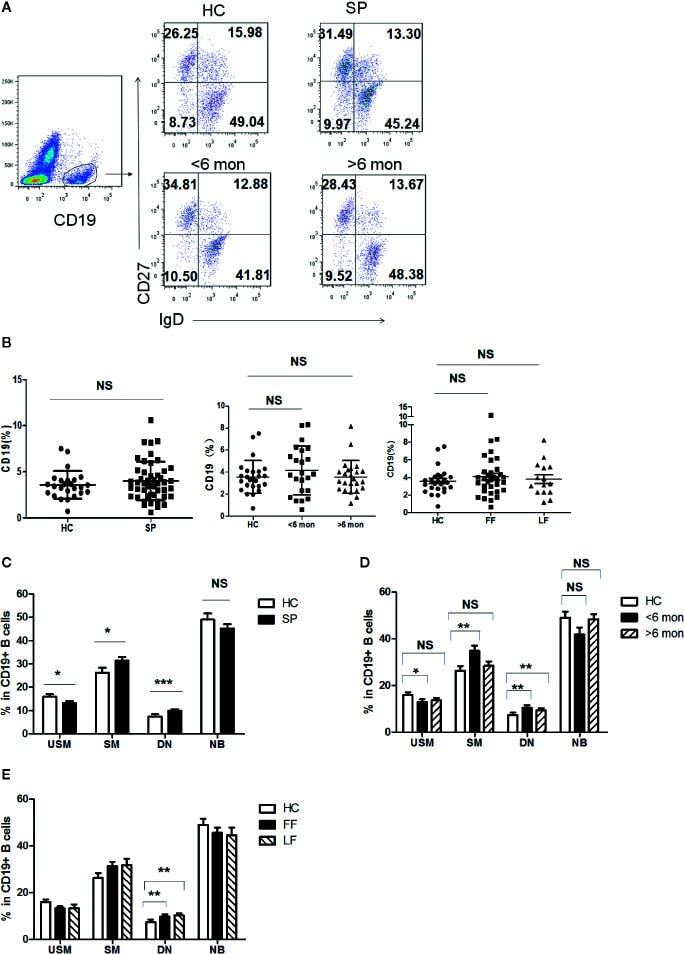
- Figure 3 Phenotypic characterization of circulating B cell subsets in patients and HC. (A) Gated by CD19 + B cells, IgD + CD27 - NB, IgD + CD27 + USM B cells, IgD - CD27 + SM B cells, and IgD - CD27 - DN B cells were identified. The graphs are representative for HC and patients with different duration. Mean value of each B cell subset's percentage is shown in the quadrants. (B) Statistical graphs for comparison of CD19 + B cells' percentages between patient groups and HC. (C-E) Statistical graphs for distinct CD19 + B cells subsets between patients (SP, n = 48; SD, n = 23; LD, n = 25; FF, n = 33; LF, n = 15.) and HC (n = 25). Error bars represent mean+-SD. * P < 0.05, ** P < 0.01, *** P < 0.001, and NS P >= 0.05.
- Submitted by
- Invitrogen Antibodies (provider)
- Main image
- Experimental details
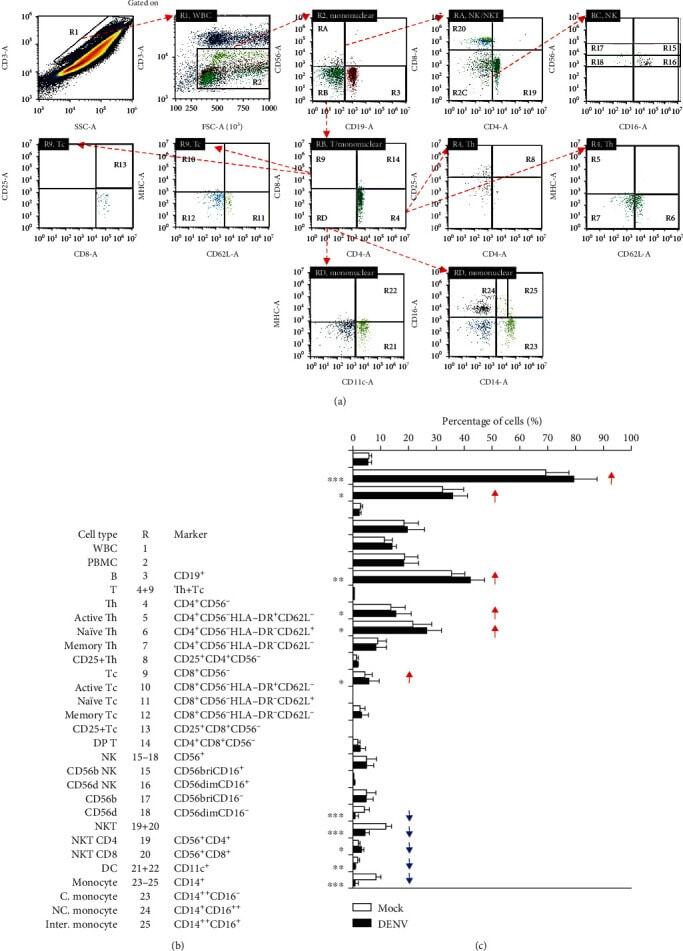
- Figure 4 Immune profiling in DENV-treated whole blood cells 24 h postincubation. Following DENV (MOI = 1) coculture in 100 mu l of WB ex vivo for 24 h, (a) representative flow cytometric analysis and gating of various cells obtained from five cases, performed by staining for specific cell surface markers (CD4, CD8, CD11c, CD14, CD16, CD19, CD25, CD56, CD62L, and HLA-DR), in the DENV-infected and mock groups showed (b) the changes in the expression of specific immune cell populations as noted. (c) The results are shown as a percentage of the mean +- SD obtained from five cases. * p < 0.05, ** p < 0.01, and *** p < 0.001, compared to the mock group. R: region; WBC: white blood cell; bri: bright.
- Submitted by
- Invitrogen Antibodies (provider)
- Main image
- Experimental details
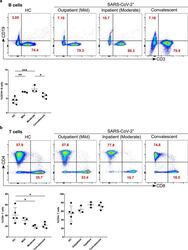
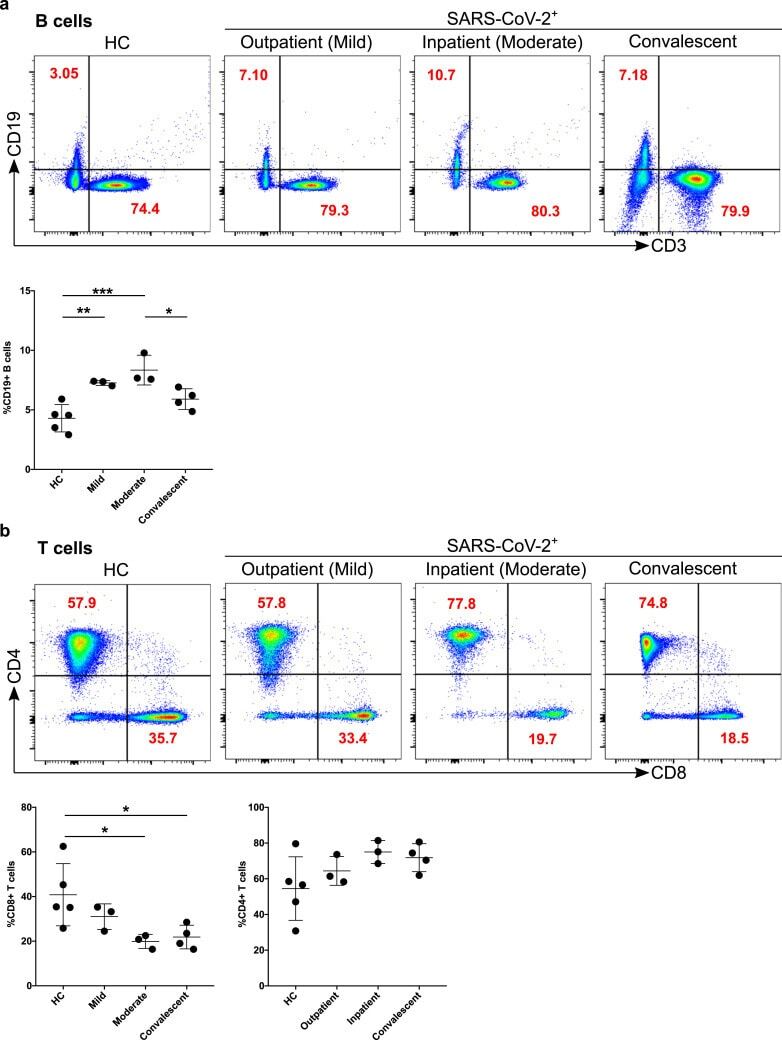
- Figure 4 Increased B cells in mild and moderate patients and reduced CD8 + cytotoxic T cells in mild and convalescent patients. A. The stained PBMCs were gated on lymphocyte population and examined for the CD19 and CD3 expression in HC, mild, moderate and convalescent (upper FACS panel). One exemplary dot plot is shown per study group. The bar diagram shows CD3 - CD19 + B cells. *P-value
- Submitted by
- Invitrogen Antibodies (provider)
- Main image
- Experimental details
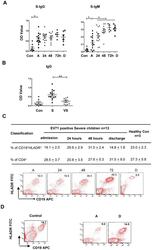
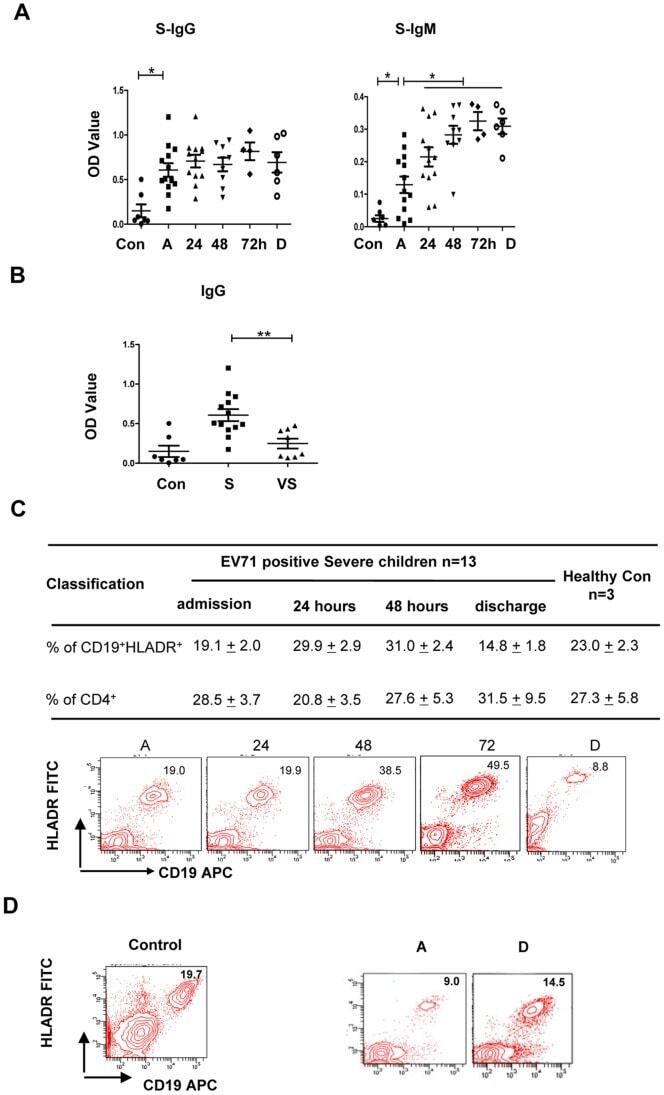
- 10.1371/journal.pone.0067430.g005 Figure 5 Production of EV71 VP-1-specific IgG and IgM antibodies in patients with increased frequency of CD19 + HLA-DR + cells. (A) IgG and IgM antibodies were rapidly increased and were markedly higher in plasma from severe patients (n = 13) compared with normal controls (n = 7). The differences between two time points of every individuals were determined by Wilcoxon's Sign Rank Test. * P
- Submitted by
- Invitrogen Antibodies (provider)
- Main image
- Experimental details
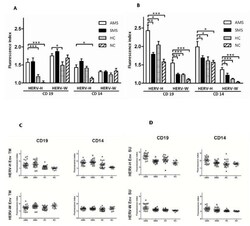
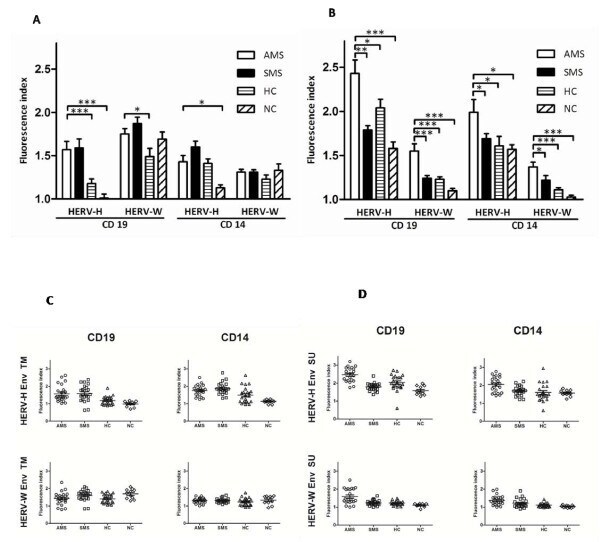
- Figure 2 Flow cytometric analysis of surface expression of HERV-H Env and HERV-W Env on B-cells and monocytes from patients with active MS (AMS), stable MS patients (SMS), healthy individuals (HC), and neurological non-inflammatory controls (NC) . The results are presented as fluorescence indices calculated as the ratio of the mean fluorescence of the cells incubated with anti-Env Abs to the mean fluorescence of the cells incubated with the appropriate control (pre-immune serum). Mean values (2A) and scatter plots (2C) for cells incubated with anti-Env TM Abs. Mean values (2B) and scatter plots (2D) for cells incubated with anti-Env SU Abs. The standard errors for each group are presented. The significant differences ( P
- Submitted by
- Invitrogen Antibodies (provider)
- Main image
- Experimental details
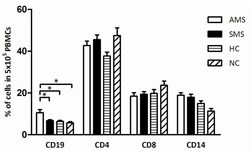
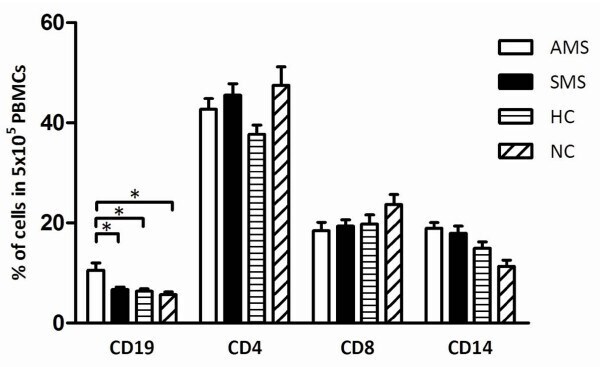
- Figure 3 Flow cytometric analysis of different leukocyte populations in PBMCs isolated from patients with active MS (AMS), stable MS patients (SMS), healthy individuals (HC), and neurological non-inflammatory controls (NC) . The bars represent the percentage of CD19, CD4, CD8, and CD14 cells in 5 x 10 6 PBMCs. The mean values and the standard error for each group are presented, and the significant differences ( P
- Submitted by
- Invitrogen Antibodies (provider)
- Main image
- Experimental details
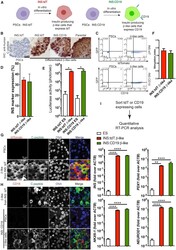
- Figure 1 Differentiation of Human PSC INS Reporter Cells (A) A diagram showing control (left panel) and experimental (right panel) INS reporter cells. (B) Immunohistochemistry (IHC) staining with an anti-human-C-peptide antibody in beta-like cells differentiated from INS:tdT, INS:CD19, and parental PSCs (right three panels) and undifferentiated PSCs (left panel). Scale bar, 50 mum. (C) Representative flow cytometry results of PSCs (left panels) and beta-like cells (right panels) differentiated from INS:tdT (top panel) and INS:CD19 (bottom panel), showing the GFP signal on the vertical axis and the tdTomato fluorescence signal (top panel) or anti-CD19 signal on the horizontal axis (bottom panel). (D) Quantifications of the proportion of INS reporter-expressing cells at the end of differentiation (n = 3). (E) Quantification of the luciferase signal in undifferentiated ESCs and beta-like cells differentiated from the INS reporter cells (n = 4). (F) In vitro glucose-stimulated insulin secretion (GSIS) assays of PSC-differentiated beta-like cells. The stimulation index shows the ratio of the amounts of secreted human insulin released when beta-like cells were treated with 20 mM glucose compared with 2.5 mM glucose (n = 4). (G) Confocal micrographs with an anti-tdTomato antibody (red) and an anti-C-peptide antibody (green) of beta-like cells differentiated from INS:tdT PSCs. Scale bar, 10 mum. (H) Confocal micrographs with an anti-CD19 antibody (red) and an anti-C-peptide antibody

- Submitted by
- Invitrogen Antibodies (provider)
- Main image
- Experimental details
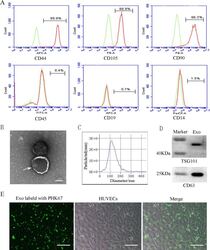
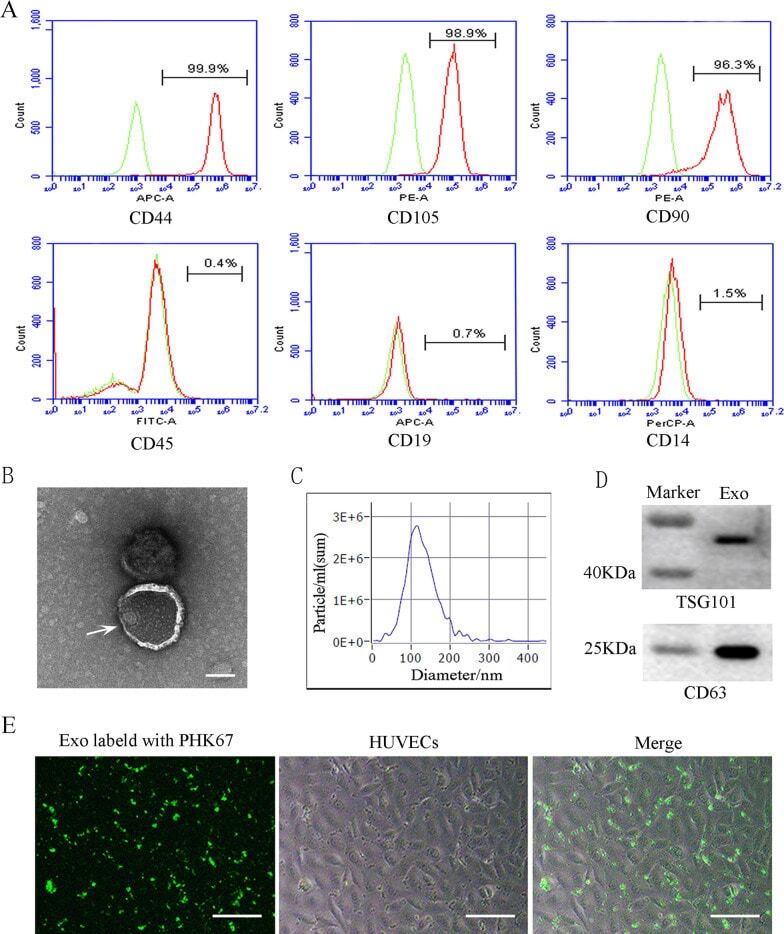
- Characterization and uptake of SHED-Exos. A Surface markers of SHED cells were analyzed by flow cytometry (FACS) and were positive for mesenchymal markers (CD44, CD105 and CD90) and negative for endothelial markers (CD45, CD19 and CD14). B The morphology of exosomes (indicated by arrows) was observed using a transmission electron microscope (TEM). Scale bar = 100 nm. C Particle size distribution of SHED-Exos assessed by nanoparticle tracking analysis (NTA). D Expression of exosome-specific CD63 and TSG101 validated using western blotting. E Efficient uptake of PKH67-labeled exosomes by HUVECs was detected at 24 h. Scale bars = 100 mum
- Submitted by
- Invitrogen Antibodies (provider)
- Main image
- Experimental details
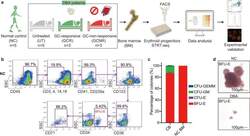
- Fig. 1 BM erythroid progenitors in DBA patients show compromised growth. a Schematic illustrating the experimental workflow. Bone marrow (BM) erythroid progenitors from healthy individuals (acting as normal controls, NC) and DBA patients, who were subcategorized into untreated (UT), glucocorticoid (GC)-responsive (GCR) and GC-non-responsive (GCNR) groups, were sorted using flow cytometry and processed for single-cell RNA-seq (scRNA-seq) using modified STRT-seq, followed by data analyses and experimental validation. b Representative FACS plots showing the gating strategies used for isolation of BFU-E cells from NCs, which were immunophenotypically defined as CD45 + CD3 - CD4 - CD14 - CD19 - CD41 - CD235a - CD123 - CD36 - CD34 + . c The percentage of colonies generated from FACS-sorted cells (BFU-E: CD45 + CD3 - CD4 - CD14 - CD19 - CD41 - CD235a - CD123 - CD36 - CD34 + ) from cord blood (CB) and BM mononuclear cells. We seeded the sorted cells from the CB of three individuals and BM of one individual due to the limited healthy BM sample. Results are represented as mean +- SEM. d Micrographs of representative BFU-E colonies differentiated from sorted BFU-E cells of NC and DBA UT patients on day 14 of the colony forming unit assay. Scale bars, 100 mum. See also Supplementary Fig. S1 , Tables S1 , 2 .

- Submitted by
- Invitrogen Antibodies (provider)
- Main image

- Experimental details
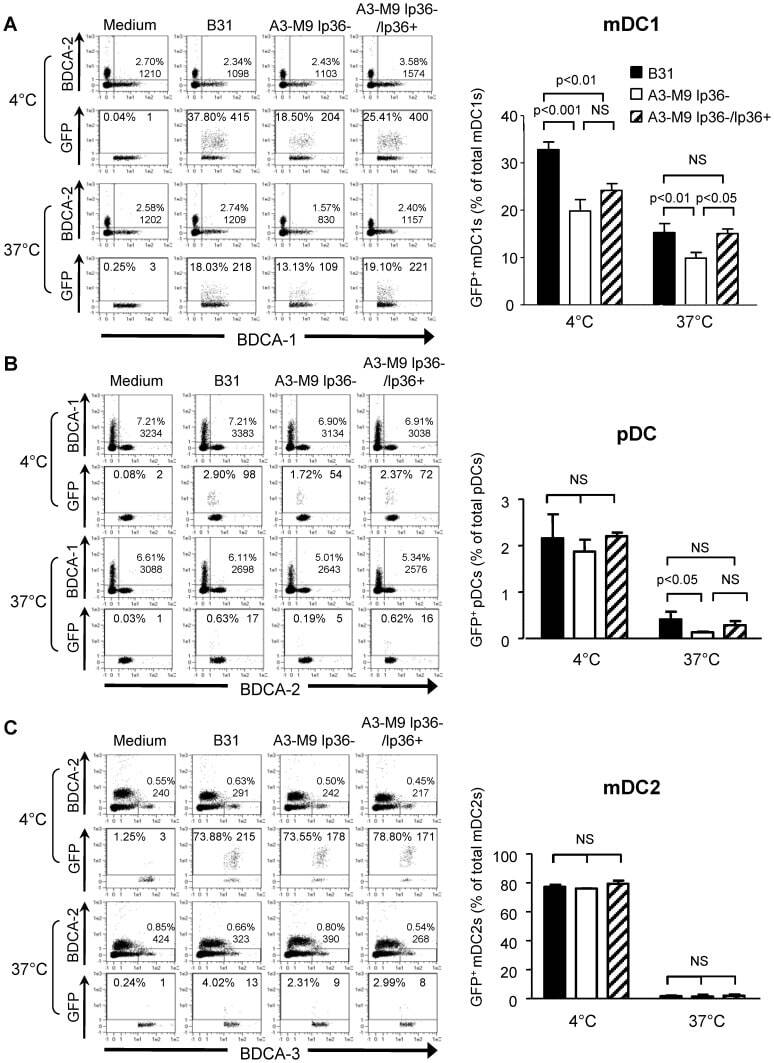
- Figure 5 lp36 contributes to the association of B. burgdorferi with specific populations of dendritic cells. Human PBMCs (4x10 6 ) were co-incubated with 4x10 7 GFP-tagged B31 (black bars), A3-M9 lp36- (white bars) or A3-M9 lp36-/lp36+ (cross-hatched bars) B. burgdorferi for 6 hours at 4degC or 37degC. The percentages of GFP + mDC1s (CD19 - CD3 - BDCA2 - BDCA1 + ) ( A ), pDCs (CD19 - CD3 - BDCA2 + BDCA1 - ) or ( B ) mDC2s (CD19 - CD3 - BDCA3 + BDCA2 - ) ( C ) were determined by multiparameter flow cytometry. Dot plots representing 500,000 collected events are provided to illustrate gating strategies (left). Column graphs represent the mean and standard deviation of three biological replicates (right). Statistical analysis was performed using a one-way ANOVA with a Tukey''s post-test for multiple comparisons.
- Submitted by
- Invitrogen Antibodies (provider)
- Main image
- Experimental details
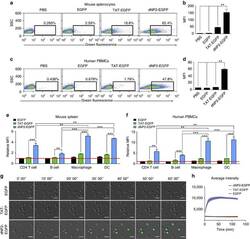
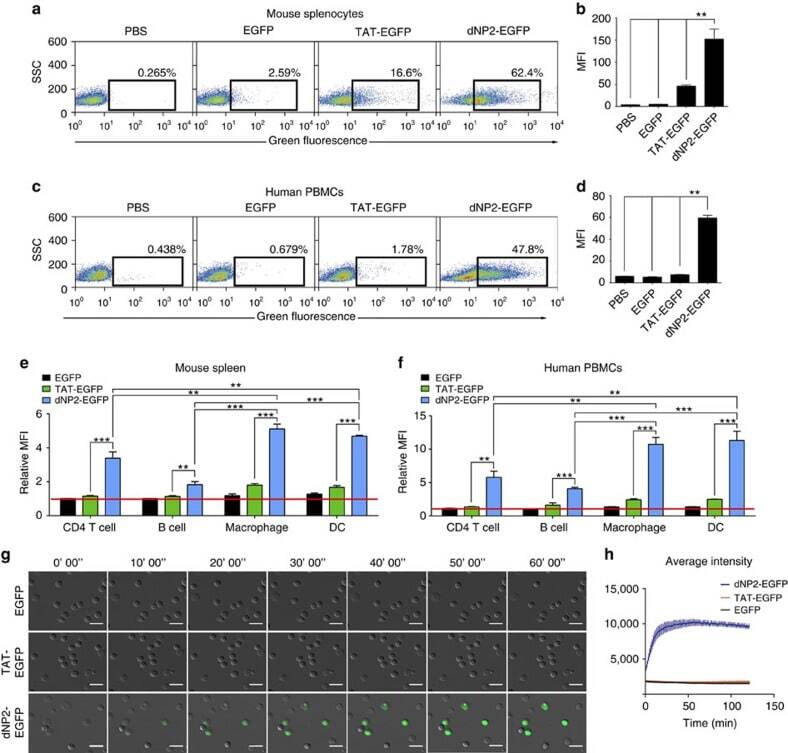
- Figure 2 Protein delivery efficiency of dNP2 in primary mouse and human immune cells. ( a , b ) Mouse primary splenocytes were isolated from 6-week-old female C57BL/6 mice and the cells were incubated with 5 muM EGFP, TAT- and dNP2-EGFP for 2 h. Intracellular fluorescence was analysed by flow cytometry and the data are represented as dot plots or mean fluorescence intensity (MFI) of the cells. ( c , d ) Human PBMCs were isolated from healthy donor blood and the cells were incubated with 5 muM EGFP, TAT-, dNP2-EGFP for 2 h. The data were analysed as described above. ( e ) Total splenocytes were incubated with 1 muM EGFP, TAT-, and dNP2-EGFP for 2 h. Cells were gated using markers specific for CD4 T cells (CD4 + ), B cells (CD19 + ), macrophages (CD11c lo CD11b hi F480 + ) and DCs (CD11c hi MHCII hi ). The EGFP signal in each cell population was then analysed by flow cytometric analysis. The relative MFI value was normalization to PBS treated cells. The red line indicates relative MFI of PBS-treated cells. ( f ) Total PBMCs were incubated with 1 muM EGFP, TAT-, and dNP2-EGFP for 2 h. Cells were gated with markers specific for CD4 T cells (CD4 + ), B cells (CD19 + ), macrophages (CD11b + ) and DCs (CD11c + ) and the data were then analysed as described above. ( g ) Time-lapse images of mouse CD4 T cells incubated with 1 muM EGFP, TAT- and dNP2-EGFP were acquired for 2 h (Scale bar, 15 mum) and ( h ) the average fluorescence intensities of 10 cells from each sample were calculate
- Submitted by
- Invitrogen Antibodies (provider)
- Main image
- Experimental details
- Figure 1 Characteristics of BM-MSCs. (a) Representative morphology of BM-MSCs. Scale bar = 500 mu m. (b) Representative flow cytometric characterization of cell surface markers expressed on BM-MSCs. Isotypic controls were represented by the gray filled histograms.
- Submitted by
- Invitrogen Antibodies (provider)
- Main image

- Experimental details
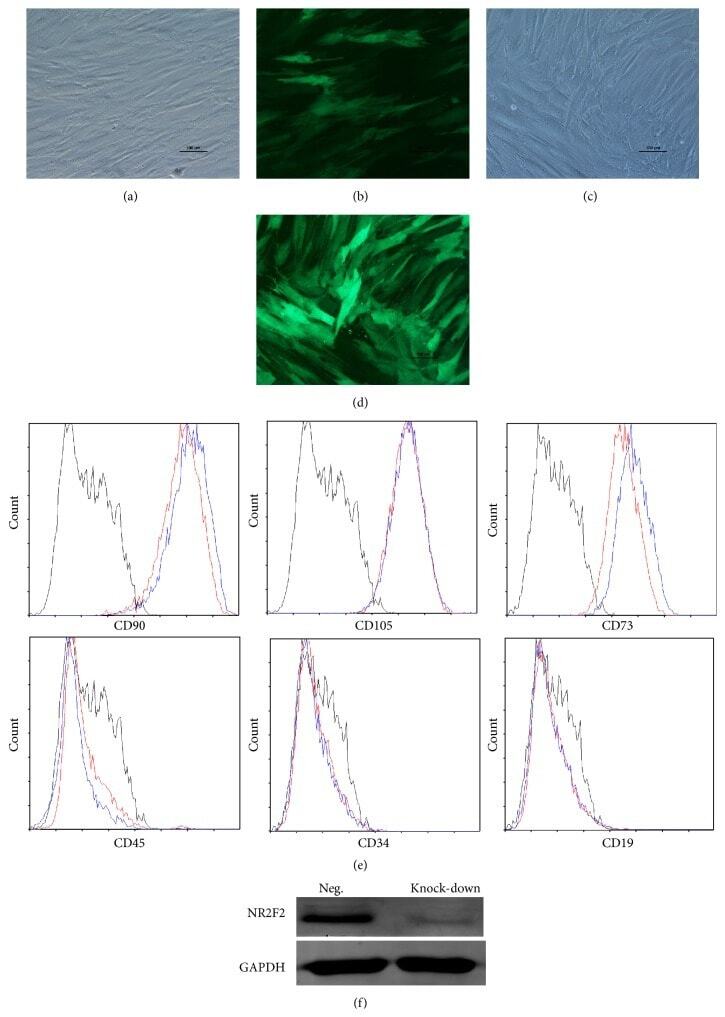
- Figure 2 Characteristics of transfected BM-MSCs. (a) Representative morphology of transfected BM-MSCs in negative control group. (b) More than 90% of BM-MSCs expressed GFP in negative control group. (c) Representative morphology of transfected BM-MSCs in knock-down group. (d) More than 90% of BM-MSCs expressed GFP in knock-down group. (e) Representative flow cytometric characterization of cell surface markers expressed on transfected BM-MSCs. Isotypic controls were represented by black line. The red line represented the negative control group and the blue line represented the knock-down group. (f) The knock-down of NR2F2 was confirmed by western blot analysis.
- Submitted by
- Invitrogen Antibodies (provider)
- Main image
- Experimental details
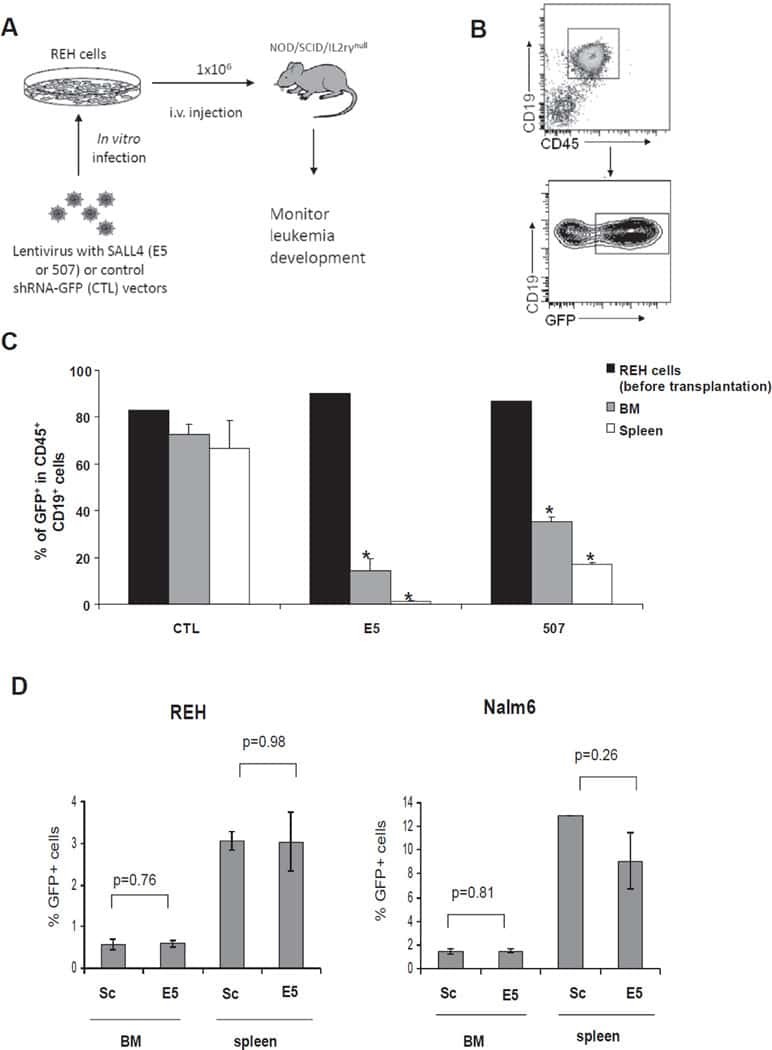
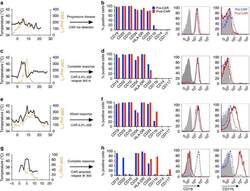
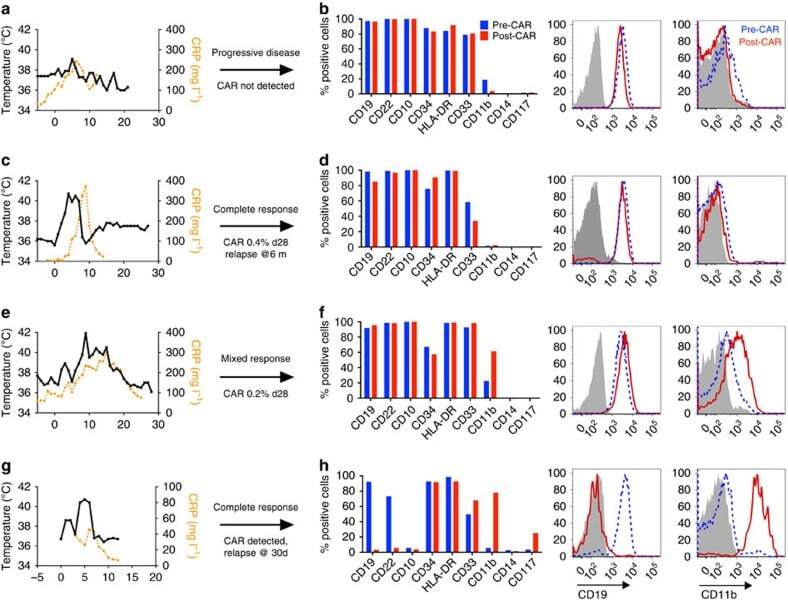
- Figure 1 Phenotypic alterations in clinical ALL samples following CD19 CAR. ( a , c , e , g ) Fever curves, CRP values and clinical response to CD19 CAR treatment. ( b , d , f , h ) Bar graph demonstrating percent of cells expressing cell surface markers by flow cytometry in the bone marrow, gated on leukaemic blasts, with representative flow cytometry histograms of CD19 and CD11b on the right (grey, control; blue, pre-CAR; red, post CAR). ( a , b ) Pre-CAR sample and day +30 post-CAR sample from a patient who did not experience CRS following CD19 CAR. ( c , d ) Pre-CAR and +180 days post-CAR samples from a patient with normal karyotype multiple relapsed ALL, who had a severe CRS followed by an MRD-negative complete response with CD19 CAR, with no CAR + cells persisting beyond 60 days. ( e , f ) Pre-CAR and day +30 post-CAR samples from a patient with normal karyotype ALL who experienced a mild CRS and CAR expansion, but had persistent disease. ( g , h ) Pre-CAR and post-CAR samples from an infant with MLL-rearranged ALL, treated with CD19-41BB-zeta CAR, who relapsed with myeloid blasts.
- Submitted by
- Invitrogen Antibodies (provider)
- Main image
- Experimental details
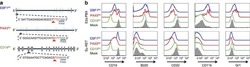
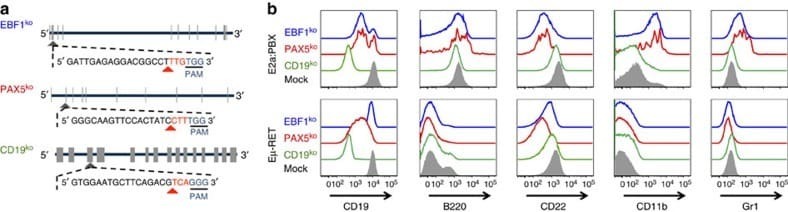
- Figure 5 Knockout of Pax5 or Ebf1 in E2a:PBX pre-B-cell ALL results in a phenotype mirroring relapse under CAR pressure. ( a ) Representative structure of Cd19 , Pax5 and Ebf1 , exons marked in tabs. Guide-RNA design for each knockout shown, with the CAS9 PAM site underlined, and cleavage site marked with a red arrowhead. ( b ) Flow cytometry plots for murine leukaemia cell lines E2a:PBX (upper panel) and Emu-RET 309 (bottom panel) following CRISPR/CAS9 knockout of CD19 (green), PAX5 (red), EBF1 (blue) or mock (grey shadow).
- Submitted by
- Invitrogen Antibodies (provider)
- Main image
- Experimental details
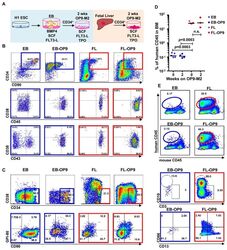
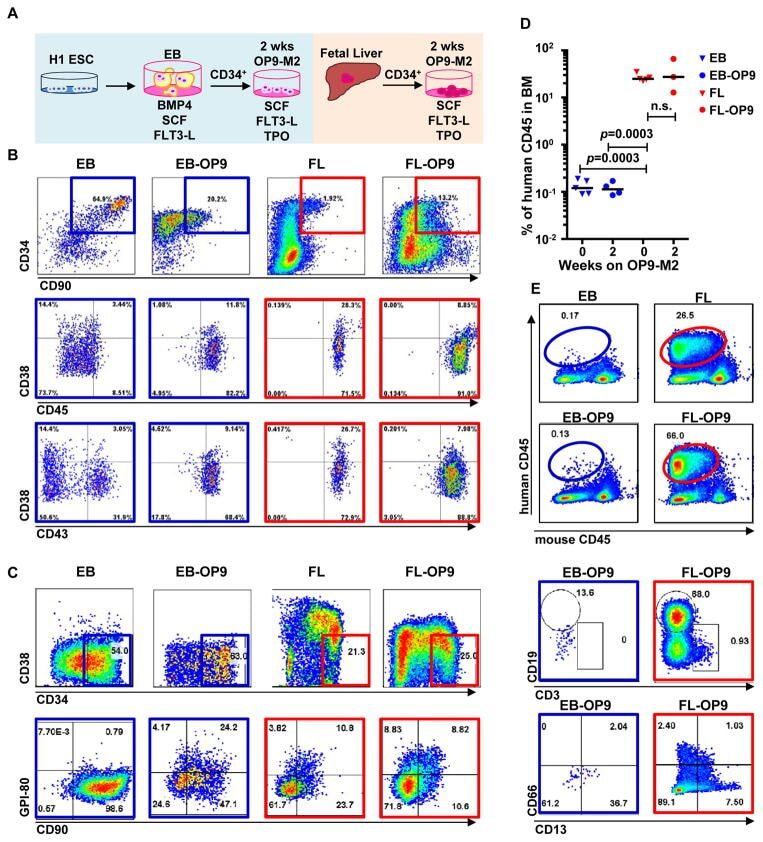
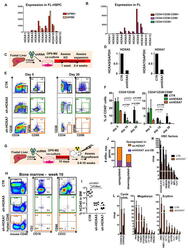
- Figure 1 Two-step culture of hESCs generates immunophenotypic HSPCs that engraft poorly (A) Culture and isolation strategy for differentiating H1 hESCs to HSPCs. (B) Representative FACS plots from 11 experiments staining for CD34, CD90, CD38, CD45 and CD43 on hESC-derived CD34 + cells isolated from 2 week EBs (EB), and after 2 week maturation culture on OP9-M2 (EB-OP9), compared to cells from second trimester foetal liver that were isolated directly (FL) or cultured on OP9-M2 (FL-OP9). (C) Representative FACS plots from 9 experiments staining for CD38, CD34, CD90 and human foetal HSC self-renewal marker GPI-80 on hESC- and FL-derived cells. (D) Human engraftment in NSG mice with hESC-derived and FL-derived CD34 + cells, before and after OP9-M2 co-culture (individual values and mean are shown, n=5 EB, n=4 EB-OP9 and FL, and n=3 FL-OP9 transplanted mice, statistical significance was calculated using the Wilcoxon Rank Sum test, see Supplementary Table 7 for statistics source data). (E) Representative FACS plots of showing human CD45 + fraction in the mouse BM 12 weeks post-transplantation. Multi-lineage engraftment is assessed by CD19 and CD3 (B-and T-lymphoid), and CD66 and CD13 (myeloid) stainings.
- Submitted by
- Invitrogen Antibodies (provider)
- Main image
- Experimental details
- Figure 4 Medial HOXA genes govern the function and identity of human foetal HSPCs (A, B) Microarray analysis of HOXA gene expression in CD34 + CD38 -/lo CD90 + GPI-80 + cells and their progeny (Mean values are shown, left, n=3 samples, GEO database GSE54316, and right, n=3 samples (CD34+CD38-CD90+) or 2 (CD34+CD38-CD90- and CD34+CD38-) GSE34974. (C) Schematic showing the strategy for lentiviral shRNA knockdown of HOXA5 or HOXA7 in FL-HSPCs. (D) Knockdown is confirmed using q-RT-PCR 1 week post-infection (mean +/- SD shown from n=3 different FL samples). (E) Representative FACS plots 30 days after HOXA5 or HOXA7 knockdown. (F) Quantification of HSPC subsets in empty-vector (CTR) and shRNA infected cells (shHOXA5 or shHOXA7) after 5, 14 and 30 days in culture (mean and SEM, n=6 independent experiments per condition for day 14 and n=3 for day 5 and 30). Statistical significance was assessed using Wilcoxon Signed Rank test. (G) Schematic showing the transplantation strategy with HOXA5 or HOXA7 knockdown FL-HSPCs. (H) Representative FACS plots from mouse BM 10 weeks post-transplantation assessing human CD45 + cells and multi-lineage engraftment (CD19 and CD3 for B-and T-lymphoid, and CD66 and CD33 for myeloid). (I) Quantification of human engraftment (n=9 mice per condition from 3 independent experiments Individual values and mean are shown.) Statistical significance was assessed using the Wilcoxon Rank Sum test (J) RNA-sequencing of HOXA7 knockdown FL-HSPCs at day 5 post-infectio
- Submitted by
- Invitrogen Antibodies (provider)
- Main image
- Experimental details
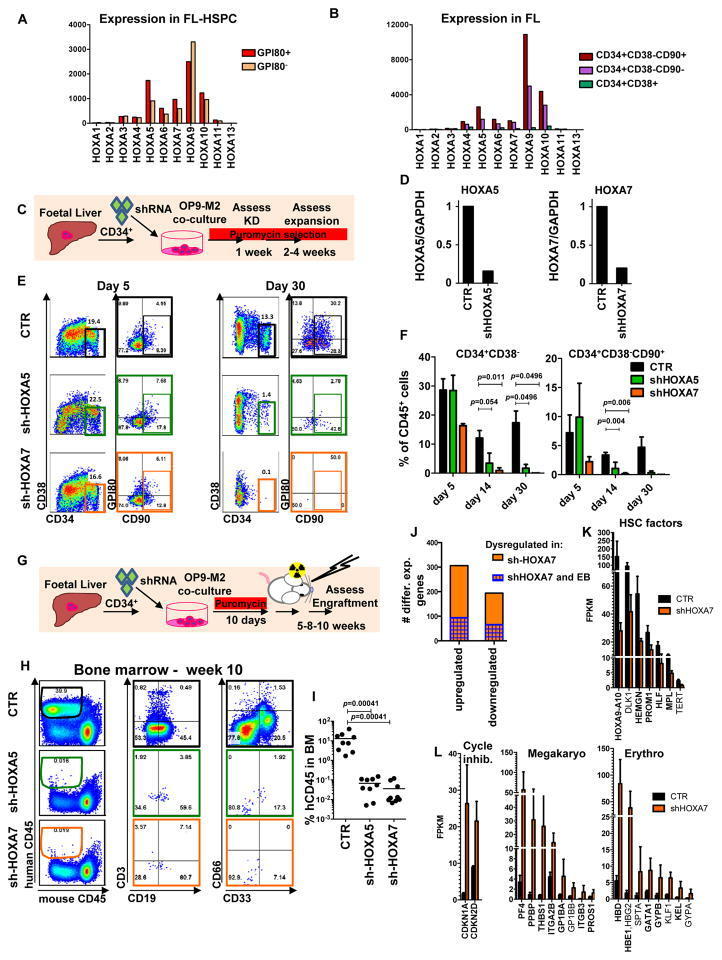
- Figure 5 Overexpression of medial HOXA genes enhances proliferative potential in FL-HSPCs but does not confer HSC properties to hESC-HSPCs (A) Schematic showing the strategy for constitutive lentiviral overexpression of HOXA5 or HOXA7 in FUGW vectors in FL-HSPCs. (B) Representative FACS plots of FUGW empty vector, HOXA5- or HOXA7- overexpressing FL-HSPCs. (C, D) Expansion of total FL cells (C) or HSPCs (D) transduced with HOXA5- or HOXA7- overexpression vectors or empty vector control (CTR), (mean and SEM values from n=3 independent experiments; statistical significance was assessed using the paired Student''s t -test. (E) q-RT-PCR confirming overexpression in transduced HSPCs sorted 1 week post-infection (n=1 experiment with 2 pooled donors). (F) CFU-Cs from 2000 HSPCs sorted after day 10 of infection with vectors overexpressing HOXA5 or HOXA7 or FUGW empty vector control (mean and SD values shown from n=4 transductions from 2 independent experiments, p-values shown correspond to CTR vs. OE-HOXA7). (G) Schematic showing the strategy for lentiviral overexpression of HOXA5 and/or HOXA7 and/or HOXA9 in FUGW vectors in EB CD34 + cells. (H) Representative examples of FACS plots of EB CD34 + cells overexpressing HOXA5 or HOXA7 or a combination of HOXA5 , HOXA7 and HOXA9 . Un-transduced FL is shown as a control. (I) Quantification of CD34 + CD38 -/lo CD45 + haematopoietic cells from (H), mean from n=4 independent experiments for CTR and n=3 for HOXA5/7/9, HOXA5, and HOXA7 at days 0

- Submitted by
- Invitrogen Antibodies (provider)
- Main image
- Experimental details
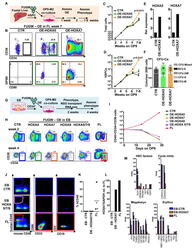
- Figure 2 CESCs Shared Features with BM-MSCs Regarding Morphology, Stem Cell Surface Markers, and Differentiation Ability (A) H&E staining of the tissue section. (B) Morphology of CESCs in agarose after seeding 6 weeks later. (C) Histologic section stained with Alcian blue of chondrified pellets in which CESCs formed in chondrogenic induction medium after 3 weeks. (D) Alizarin red staining of CESCs that underwent osteogenic induction for 3 weeks. (E) Immunophenotypic profile of stem cells in CESCs by flow cytometric analysis. The green lines indicate the fluorescence intensity of cells stained with the corresponding antibodies, and the red lines represent isotype-matched negative control cells. (F) Percentages of CESCs expressing different stem cell markers (n = 6 independent experiments). Data represent the mean +- SD.

- Submitted by
- Invitrogen Antibodies (provider)
- Main image
- Experimental details
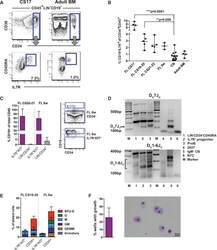
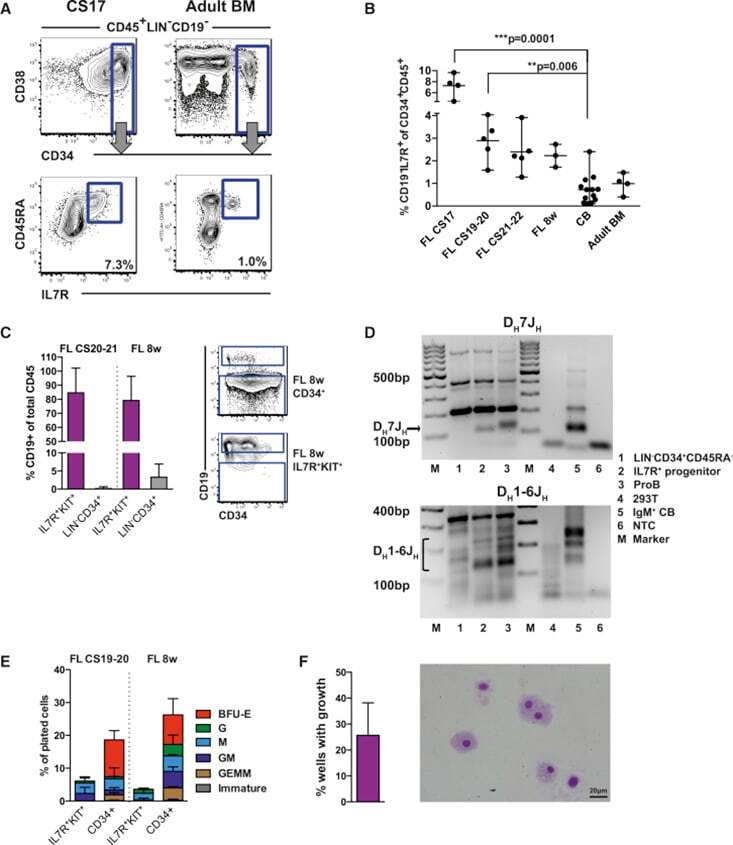
- Figure 2 Identification of a CD19 - IL-7R + Progenitor (A) Fluorescence-activated cell sorting (FACS) analysis of CS17 FL showing CD19 - IL-7R + progenitor co-expressing CD34 and CD45RA. Adult BM (right) is shown for comparison. Cells were gated CD45 + LIN - CD19 - . Further gating as indicated. Mean percentage of total CD45 + CD34 + cells. (B) Kinetics of IL-7R progenitor emergence during development as percentage of total CD45 + CD34 + cells. Each dot represents one biological sample. Mean with range. Statistical comparison versus CB control. (C) B cell potential of IL-7R + KIT + FL progenitors was tested by co-culture on MS-5 for 2 weeks. Percentage of CD19 + B cells of total CD45 + cells is shown (left) with representative FACS analysis (right). CD34 + cells were used as control. Mean +- SD, n = 2-3. (D) Agarose gel of IGH DJ rearrangements in IL-7R + FL progenitor. Top: D H 7J H recombination assay. Bottom: D H 1-6J H recombination assay. Label for lanes 1-6 is shown to the right. Marker lanes (M). Predicted D H 7J H recombination between 100 and 130 bp. Predicted D H 1-6J H rearrangements between 110 and 290 bp, n = 1 ( van Dongen et al., 2003 ). (E) GM and erythroid potential of IL-7R + KIT + FL progenitor in semi-solid media. Data show distribution of colony types as percentage of plated cells versus CD34 + cells as controls. Mean +- SD, n = 2 per developmental stage. (F) Myeloid potential of IL-7R + KIT + FL progenitor in liquid culture (20-40 cells/well). Graph show
- Submitted by
- Invitrogen Antibodies (provider)
- Main image
- Experimental details
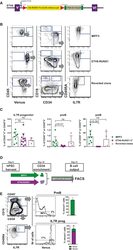
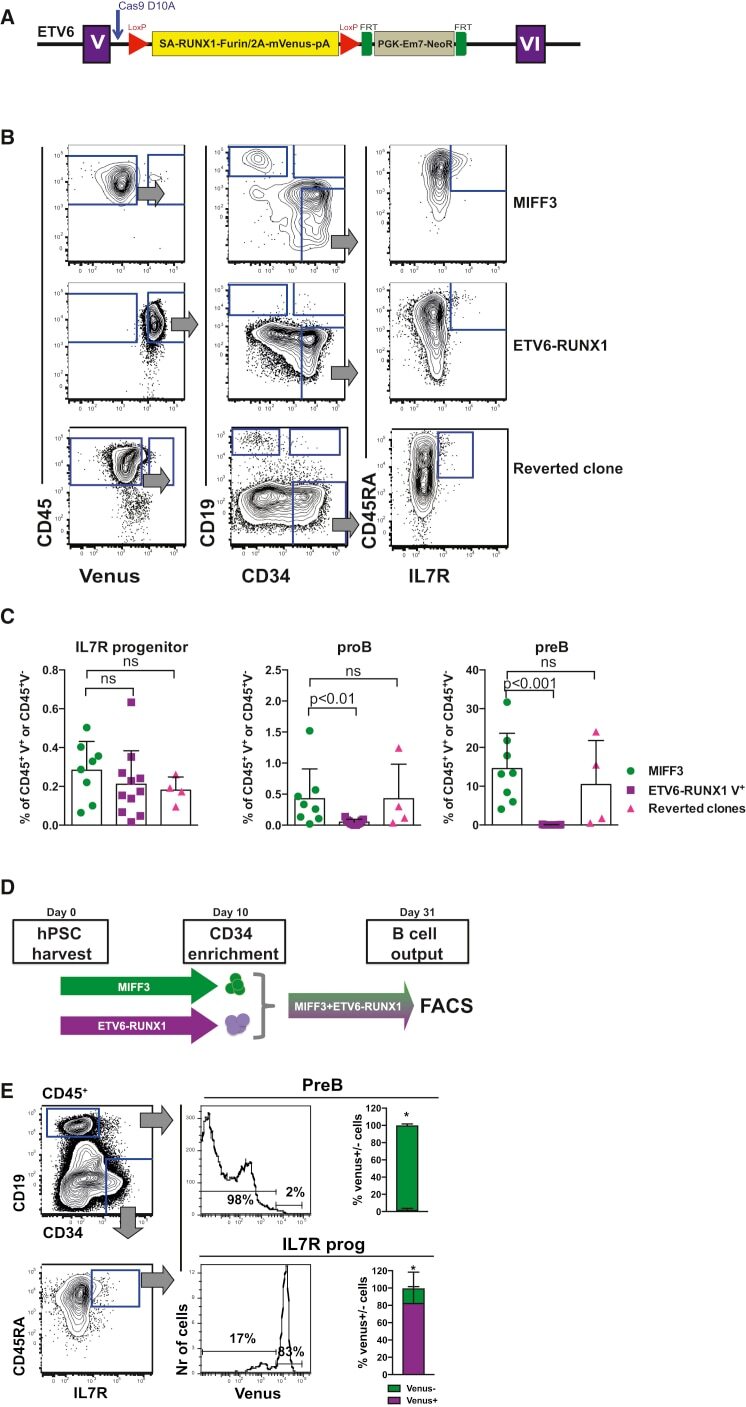
- Figure 5 An hIPSC Model of ETV6-RUNX1 Shows a Block in B Lineage Commitment (A) Genome engineering strategy. A constitutive knockin cassette, encoding a splice acceptor (SA), cDNA for RUNX1 exons II-VIII V5 tagged at the C terminus, and linked to the mVenus fluorescent reporter by a self-cleaving furin/T2A peptide is inserted by CRISPR-directed homologous recombination toward the 5'' end of ETV6 intron V. The cassette is flanked by LoxP sites and includes a 3'' triple stop/poly(A) tail followed by an FLP floxable NeoR + selection cassette. (B) Control MIFF3 (top panel), ETV6-RUNX1 hPSCs (middle panel) and reverted ETV6-RUNX1 hPSCs (bottom panel) were cultured according to Figure 4 A and analyzed by flow cytometry for Venus reporter (left), proB (CD34 + CD19 + ) and preB (CD34 - CD19 + ) cells (middle), and IL-7R + progenitor (right). Viable cells were gated as indicated. (C) Frequencies of IL-7R + progenitor, proB, and preB cells in MIFF3 cells compared with ETV6-RUNX1 iPSCs and reverted ETV6-RUNX1 hPSCs analyzed at D27-31. Percentage of Venus - (MIFF3/reverted clone) or Venus + (ETV6-RUNX1 hIPSC) CD45 + blood cells. Each dot represents one replicate. Only samples with 8,000 cells or more were considered. Mean +- SD. Statistics were performed using MIFF3 as control group, ns, not significant. (D) Schematic drawing of in vitro competitive assay. Equal numbers of ETV6-RUNX1 and wild-type MIFF3-derived CD34 + cells from D10 of OP9 co-culture were seeded onto MS5 in B differentia
- Submitted by
- Invitrogen Antibodies (provider)
- Main image
- Experimental details
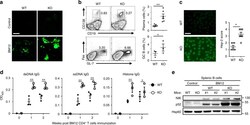
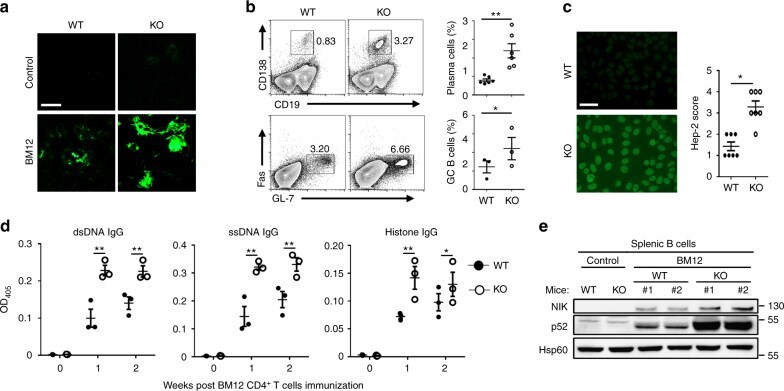
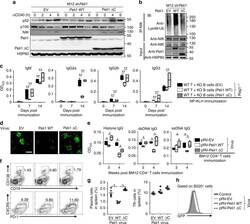
- Fig. 2 Peli1 deficiency aggravates the induction of lupus-like disease. a WT and Peli1 -deficient (KO) mice were intraperitoneally injected with 7.5 million of CD4 + T cell from C57BL/6 mice (control) or from BM12 mice. Representative immunofluorescent images showing IgG deposits in kidney by staining with Alexa Fluor 488-labeled anti-mouse IgG. Scale bar, 100 mum. b Flow cytometric analysis of the percentages of CD19 - CD138 + plasma cells and Fas + GL-7 + germinal center (GC) B cells in WT and KO immunized mice as described in ( a ). Data are presented as a representative plot (left panel) and summary graph (right panel). c Distinct anti-nuclear antibody (ANA) staining patterns of the Hep-2 cell line with serum from WT and KO mice 4 weeks after immunization as described in ( a ). Scale bar, 50 mum. d Enzyme-linked immunosorbent assay (ELISA) of anti-dsDNA, anti-ssDNA, and anti-histone IgG in serum from WT and KO immunized mice as described in ( a ) at the indicate time point. e Immunoblot showing NIK and p52 protein levels in splenic B cells from control and BM12 CD4 + T cells immunized WT and KO mice as described in ( a ). Data are shown as the mean +- SEM based on three independent experiments. Two-tailed Student''s t- tests were performed. * P < 0.05 and ** P < 0.01
- Submitted by
- Invitrogen Antibodies (provider)
- Main image
- Experimental details
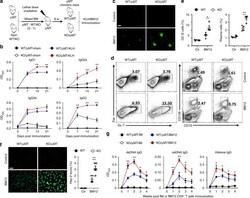
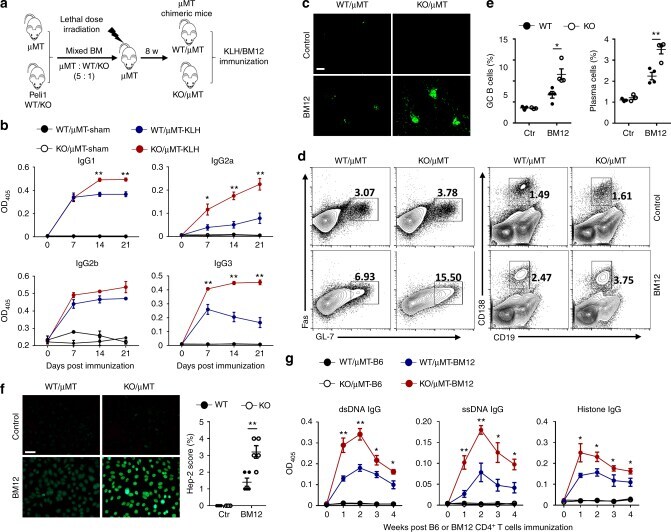
- Fig. 3 Peli1 deficiency specifically in B cells promotes autoimmunity in vivo. a Scheme showing how the muMT chimeric mice were constructed for immunization. b Enzyme-linked immunosorbent assay (ELISA) of NP-specific IgG1, IgG2a, IgG2b, and IgG3 in the serum of WT/muMT and Peli1-deficient (KO)/muMT chimeric mice that immunized intraperitoneally with vehicle (sham) or NP-KLH (KLH). c WT/muMT and KO/muMT chimeric mice were intraperitoneally injected with 7.5 million of CD4 + T cell from C57BL/6 mice (control) or from BM12 mice. Representative immunofluorescent images showing IgG deposits in kidney by staining with Alexa Fluor 488-labeled anti-mouse IgG. Scale bar, 100 mum. d , e Flow cytometric analysis of the percentages of Fas + GL-7 + germinal center (GC) B cells and CD19 - CD138 + plasma cells in immunized WT/muMT and KO/muMT chimeric mice as described in ( c ). Data are presented as the representative FACS plots ( d ) and summary graphs ( e ). f Distinct anti-nuclear antibody (ANA) staining patterns of the Hep-2 cell line with serum from WT/muMT and KO/muMT chimeric mice 4 weeks after immunization as described in ( c ). Ctr represents control in the right panel bar graph. Scale bar, 50 mum. g Enzyme-linked immunosorbent assay (ELISA) of anti-dsDNA, anti-ssDNA, and anti-histone IgG in serum from immunized WT/muMT and KO/muMT chimeric mice as described in ( c ) at the indicate time point. Data are shown as the mean +- SEM based on three independent experiments. Two-tailed St
- Submitted by
- Invitrogen Antibodies (provider)
- Main image
- Experimental details
- Fig. 7 Overexpression of Peli1 prevents lupus-like disease. a Immunoblot analysis of p52, p100, NIK, Peli1, Peli1DeltaC and HSP60 in Peli1 -knockdown M12 cells that reconstituted with empty vector (EV), WT full-length Peli1 or Peli1DeltaC that stimulated with anti-CD40 (alphaCD40) at the indicated time points. b Analysis of Lys48 ubiquitination of NIK in Peli1 -knockdown M12 cells reconstituted with EV, WT Peli1, or Peli1DeltaC that stimulated with anti-CD40 (alphaCD40) for 4 h in the presence of MG132. c LISA of NP-specific IgM, IgG2a, IgG2b and IgG3 in the serum of Rag1 -/- mice that transferred with WT T cells plus KO B cells reconstituted with EV, WT Peli1 or Peli1DeltaC, and then immunized intraperitoneally with NP-KLH. d - h Peli1 -deficient (KO) mice were immunized with 7.5 million of BM12 CD4 + T cell to induce lupus-like disease, and then injected with pRV-GFP retrovirus encoding Peli1 or Peli1DeltaC 12 h post-immunization. The IgG deposits in kidney were examined by staining with Alexa Fluor 488-labeled anti-mouse IgG ( d ). Scale bar, 100 mum. The anti-dsDNA, anti-ssDNA, anti-histone IgG in serum were determined by ELISA ( e ). The percentages of CD19 - CD138 + plasma cells, PD-1 + CXCR5 + Tfh cells ( f , g ) and infected B220 + B cells ( h ) in spleens were assessed by flow cytometry. Data are shown as the mean +- SEM based on three independent experiments. Two-tailed Student''s t- tests were performed. * P < 0.05 and ** P < 0.01

- Submitted by
- Invitrogen Antibodies (provider)
- Main image
- Experimental details
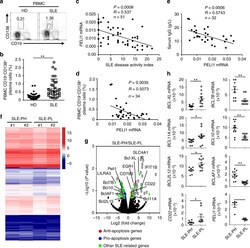
- Fig. 8 PELI1 expression is negatively correlated with SLE disease activity. a , b Flow cytometric analysis of the frequencies of CD19 - CD138 + plasma cells in peripheral blood mononuclear cells (PBMCs) from health donors (HD) and SLE patients. Data are presented as a representative plot ( a ) and summary graph ( b ). c - e Correlation analysis of the PELI1 mRNA expression in PBMCs with the disease activity ( c ), plasma cells frequencies ( d ), and serum IgG levels ( e ) in SLE patients. f Heat map showing differentially expressed genes in PBMCs that isolated from SLE patients with Peli1 high or Peli1 low mRNA expression (SLE-PH or SLE-PL). g Volcano graphs showing the genes differentially expressed in PBMCs between SLE-PH and SLE-PL. h QPCR determining the relative expression of the indicated apoptosis-related and Peli1 genes in PBMCs of SLE-PH and SLE-PL patients. Each dot represents a value of the gene epression results from SLE-PH or SLE-PL patients. Data were normalized to a reference gene, ACTIN . Data are shown as the mean +- SEM based on three independent experiments. Two-tailed Student''s t- tests were performed. * P < 0.05 and ** P < 0.01
