Explore
 Validate
 Learn
Learn44-610
antibody from Invitrogen Antibodies
Targeting: GSK3B
 Western blot
 ELISA Immunocytochemistry Immunoprecipitation Immunohistochemistry Flow cytometry Other assay
Antibody data
- Antibody Data
- Antigen structure
- References [0]
- Comments [0]
- Validations
- Western blot [3]
- Immunocytochemistry [2]
- Other assay [39]
Submit
Validation data
Reference
Comment
Report error
- Product number
- 44-610 - Provider product page

- Provider
- Invitrogen Antibodies
- Product name
- GSK3 alpha/beta Monoclonal Antibody (21A)
- Antibody type
- Monoclonal
- Antigen
- Recombinant full-length protein
- Description
- 44-610 is an antibody that's produced in mouse against a recombinant Xenopus laevis protein. |Has been successfully used ELISA, Flow Cytometry, Immunohistochemistry, Immunoprecipitation, and Western Blot procedures.
- Reactivity
- Human, Mouse, Rat, Xenopus
- Host
- Mouse
- Isotype
- IgG
- Antibody clone number
- 21A
- Vial size
- 100 µg
- Concentration
- 1 mg/mL
- Storage
- 4°C short term, -80°C long term
No comments: Submit comment
Supportive validation
- Submitted by
- Invitrogen Antibodies (provider)
- Main image

- Experimental details
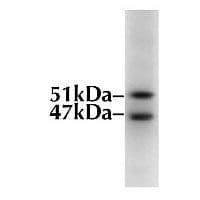
- Proteins were resolved from MCF-7 cell extracts by SDS-PAGE. The proteins were transferred to PVDF membrane and incubated with this mouse anti-GSK-3a/β monoclonal antibody at 0.5 µg/mL. The signal was detected using a goat F (ab')2 anti-mouse IgG Alkaline Phosphatase conjugated antibody (Product # AMI4405) at a 1:5000 dilution and the membrane was incubated with CDP-substrate using the WesternStarTM method (Tropix). The membrane was then exposed to Kodak BioMax film.
- Submitted by
- Invitrogen Antibodies (provider)
- Main image
- Experimental details
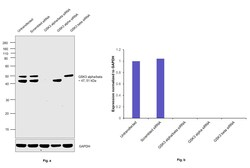
- Knockdown of Glycogen synthase kinase-3 alpha/beta was achieved by transfecting HeLa with Glycogen synthase kinase-3 alpha/beta specific siRNAs (Silencer® select Product # GSK3 alpha-S6237, S6238 and GSK3 beta -S6239, S6241). Western Blot analysis (Fig. a) was performed using Whole cell extracts from the Glycogen synthase kinase-3 alpha/beta knockdown cells (lane 3), Glycogen synthase kinase-3 alpha knockdown cells (lane 4), Glycogen synthase kinase-3 beta knockdown cells (lane 5), non-targeting scrambled siRNA transfected cells (lane 2) and untransfected cells (lane 1). The Blot was probed with GSK3 alpha/beta Monoclonal Antibody (21A) (Product # 44-610, 1:1000 dilution ) and Goat anti-Mouse IgG (H+L) Superclonal™ Recombinant Secondary Antibody, HRP (Product # A28177, 1:4000 dilution). Densitometric analysis of this western Blot is shown in histogram (Fig. b). Loss in signal upon siRNA mediated knock down confirms that antibody is specific to Glycogen synthase kinase-3 alpha/beta.

- Submitted by
- Invitrogen Antibodies (provider)
- Main image
- Experimental details
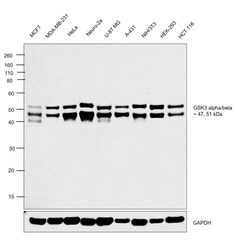
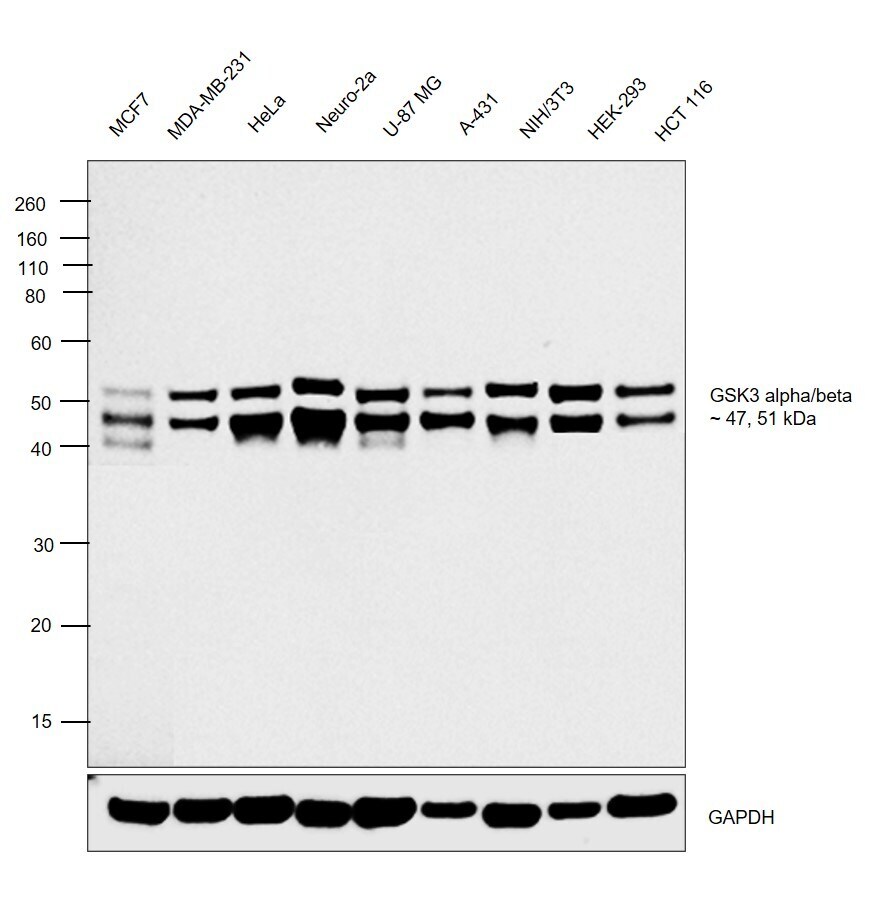
- Western Blot was performed using Anti-GSK3 alpha/beta Monoclonal Antibody (21A) (Product # 44-610) and 51 kDa (GSK3 alpha) and 47 kDa (GSK3 beta), bands corresponding to Glycogen synthase kinase-3 alpha/beta was observed across the cell lines tested. Whole cell extracts (30 µg lysate) of MCF7 (Lane 1), MDA-MB-231 (Lane 2), HeLa (Lane 3), Neuro-2a (Lane 4), U-87 MG (Lane 5), A-431 (Lane 6), NIH/3T3 (Lane 7), HEK-293 (Lane 8) and HCT 116 (Lane 9) were electrophoresed using NuPAGE™ 10% Bis-Tris Protein Gel (Product # NP0302BOX). Resolved proteins were then transferred onto a Nitrocellulose membrane (Product # IB23001) by iBlot® 2 Dry Blotting System (Product # IB21001). The Blot was probed with the primary antibody (1:1000 dilution) and detected by chemiluminescence with Goat anti-Mouse IgG (H+L) Superclonal™ Recombinant Secondary Antibody, HRP (Product # A28177, 1:4000 dilution) using the iBright FL 1000 (Product # A32752). Chemiluminescent detection was performed using Novex® ECL Chemiluminescent Substrate Reagent Kit (Product # WP20005).
Supportive validation
- Submitted by
- Invitrogen Antibodies (provider)
- Main image
- Experimental details
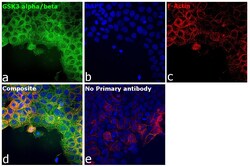
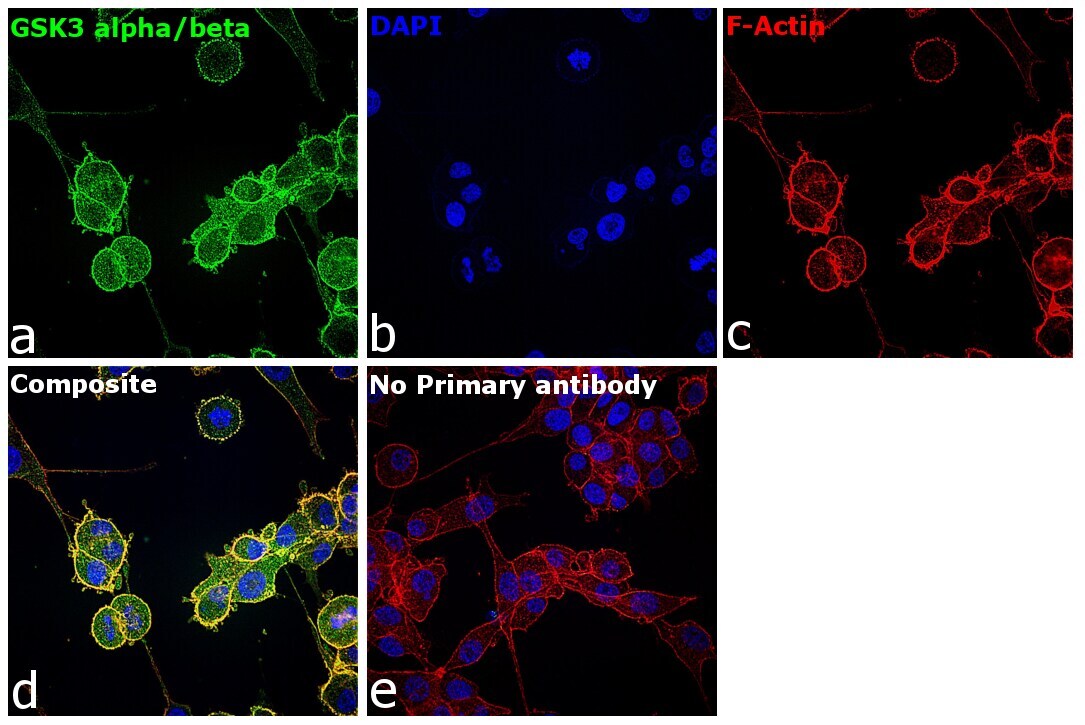
- Immunofluorescence analysis of GSK3 alpha/beta was performed using 70% confluent log phase A-431 cells. The cells were fixed with 4% paraformaldehyde for 10 minutes, permeabilized with 0.1% Triton™ X-100 for 15 minutes, and blocked with 2% BSA for 1 hour at room temperature. The cells were labeled with GSK3 alpha/beta Monoclonal Antibody (21A) (Product # 44-610) at 1:100 dilution in 0.1% BSA, incubated at 4 degree celsius overnight and then with Donkey anti-Mouse IgG (H+L) Highly Cross-Adsorbed Secondary Antibody, Alexa Fluor Plus 488 (Product # A32766), (1:2,000 dilution) at a dilution of 1:2,000 for 45 minutes at room temperature (Panel a: green). Nuclei (Panel b: blue) were stained with Hoechst 33342 (Product # H1399). F-actin (Panel c: red) was stained with Rhodamine Phalloidin (Product # R415, 1:300). Panel d represents the merged image showing plasma membrane and cytoplasmic localization. Panel e represents control cells with no primary antibody to assess background. The images were captured at 40X magnification in CellInsight CX7 LZR High-Content Screening (HCS) Platform (Product # CX7C1115LZR).

- Submitted by
- Invitrogen Antibodies (provider)
- Main image
- Experimental details
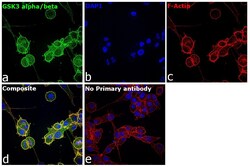
- Immunofluorescence analysis of GSK3 alpha/beta was performed using 70% confluent log phase U-87 MG cells. The cells were fixed with 4% paraformaldehyde for 10 minutes, permeabilized with 0.1% Triton™ X-100 for 15 minutes, and blocked with 2% BSA for 1 hour at room temperature. The cells were labeled with GSK3 alpha/beta Monoclonal Antibody (21A) (Product # 44-610) at 1:100 dilution in 0.1% BSA, incubated at 4 degree celsius overnight and then with Donkey anti-Mouse IgG (H+L) Highly Cross-Adsorbed Secondary Antibody, Alexa Fluor Plus 488 (Product # A32766), (1:2,000 dilution) at a dilution of 1:2,000 for 45 minutes at room temperature (Panel a: green). Nuclei (Panel b: blue) were stained with Hoechst 33342 (Product # H1399). F-actin (Panel c: red) was stained with Rhodamine Phalloidin (Product # R415, 1:300). Panel d represents the merged image showing plasma membrane and cytoplasmic localization. Panel e represents control cells with no primary antibody to assess background. The images were captured at 40X magnification in CellInsight CX7 LZR High-Content Screening (HCS) Platform (Product # CX7C1115LZR).
Supportive validation
- Submitted by
- Invitrogen Antibodies (provider)
- Main image

- Experimental details
- NULL

- Submitted by
- Invitrogen Antibodies (provider)
- Main image
- Experimental details
- NULL

- Submitted by
- Invitrogen Antibodies (provider)
- Main image
- Experimental details
- NULL

- Submitted by
- Invitrogen Antibodies (provider)
- Main image

- Experimental details
- NULL
- Submitted by
- Invitrogen Antibodies (provider)
- Main image
- Experimental details
- NULL
- Submitted by
- Invitrogen Antibodies (provider)
- Main image

- Experimental details
- NULL
- Submitted by
- Invitrogen Antibodies (provider)
- Main image

- Experimental details
- NULL
- Submitted by
- Invitrogen Antibodies (provider)
- Main image
- Experimental details
- NULL
- Submitted by
- Invitrogen Antibodies (provider)
- Main image
- Experimental details
- NULL
- Submitted by
- Invitrogen Antibodies (provider)
- Main image

- Experimental details
- NULL
- Submitted by
- Invitrogen Antibodies (provider)
- Main image

- Experimental details
- NULL
- Submitted by
- Invitrogen Antibodies (provider)
- Main image

- Experimental details
- NULL
- Submitted by
- Invitrogen Antibodies (provider)
- Main image
- Experimental details
- NULL
- Submitted by
- Invitrogen Antibodies (provider)
- Main image
- Experimental details
- NULL

- Submitted by
- Invitrogen Antibodies (provider)
- Main image

- Experimental details
- NULL
- Submitted by
- Invitrogen Antibodies (provider)
- Main image

- Experimental details
- NULL

- Submitted by
- Invitrogen Antibodies (provider)
- Main image
- Experimental details
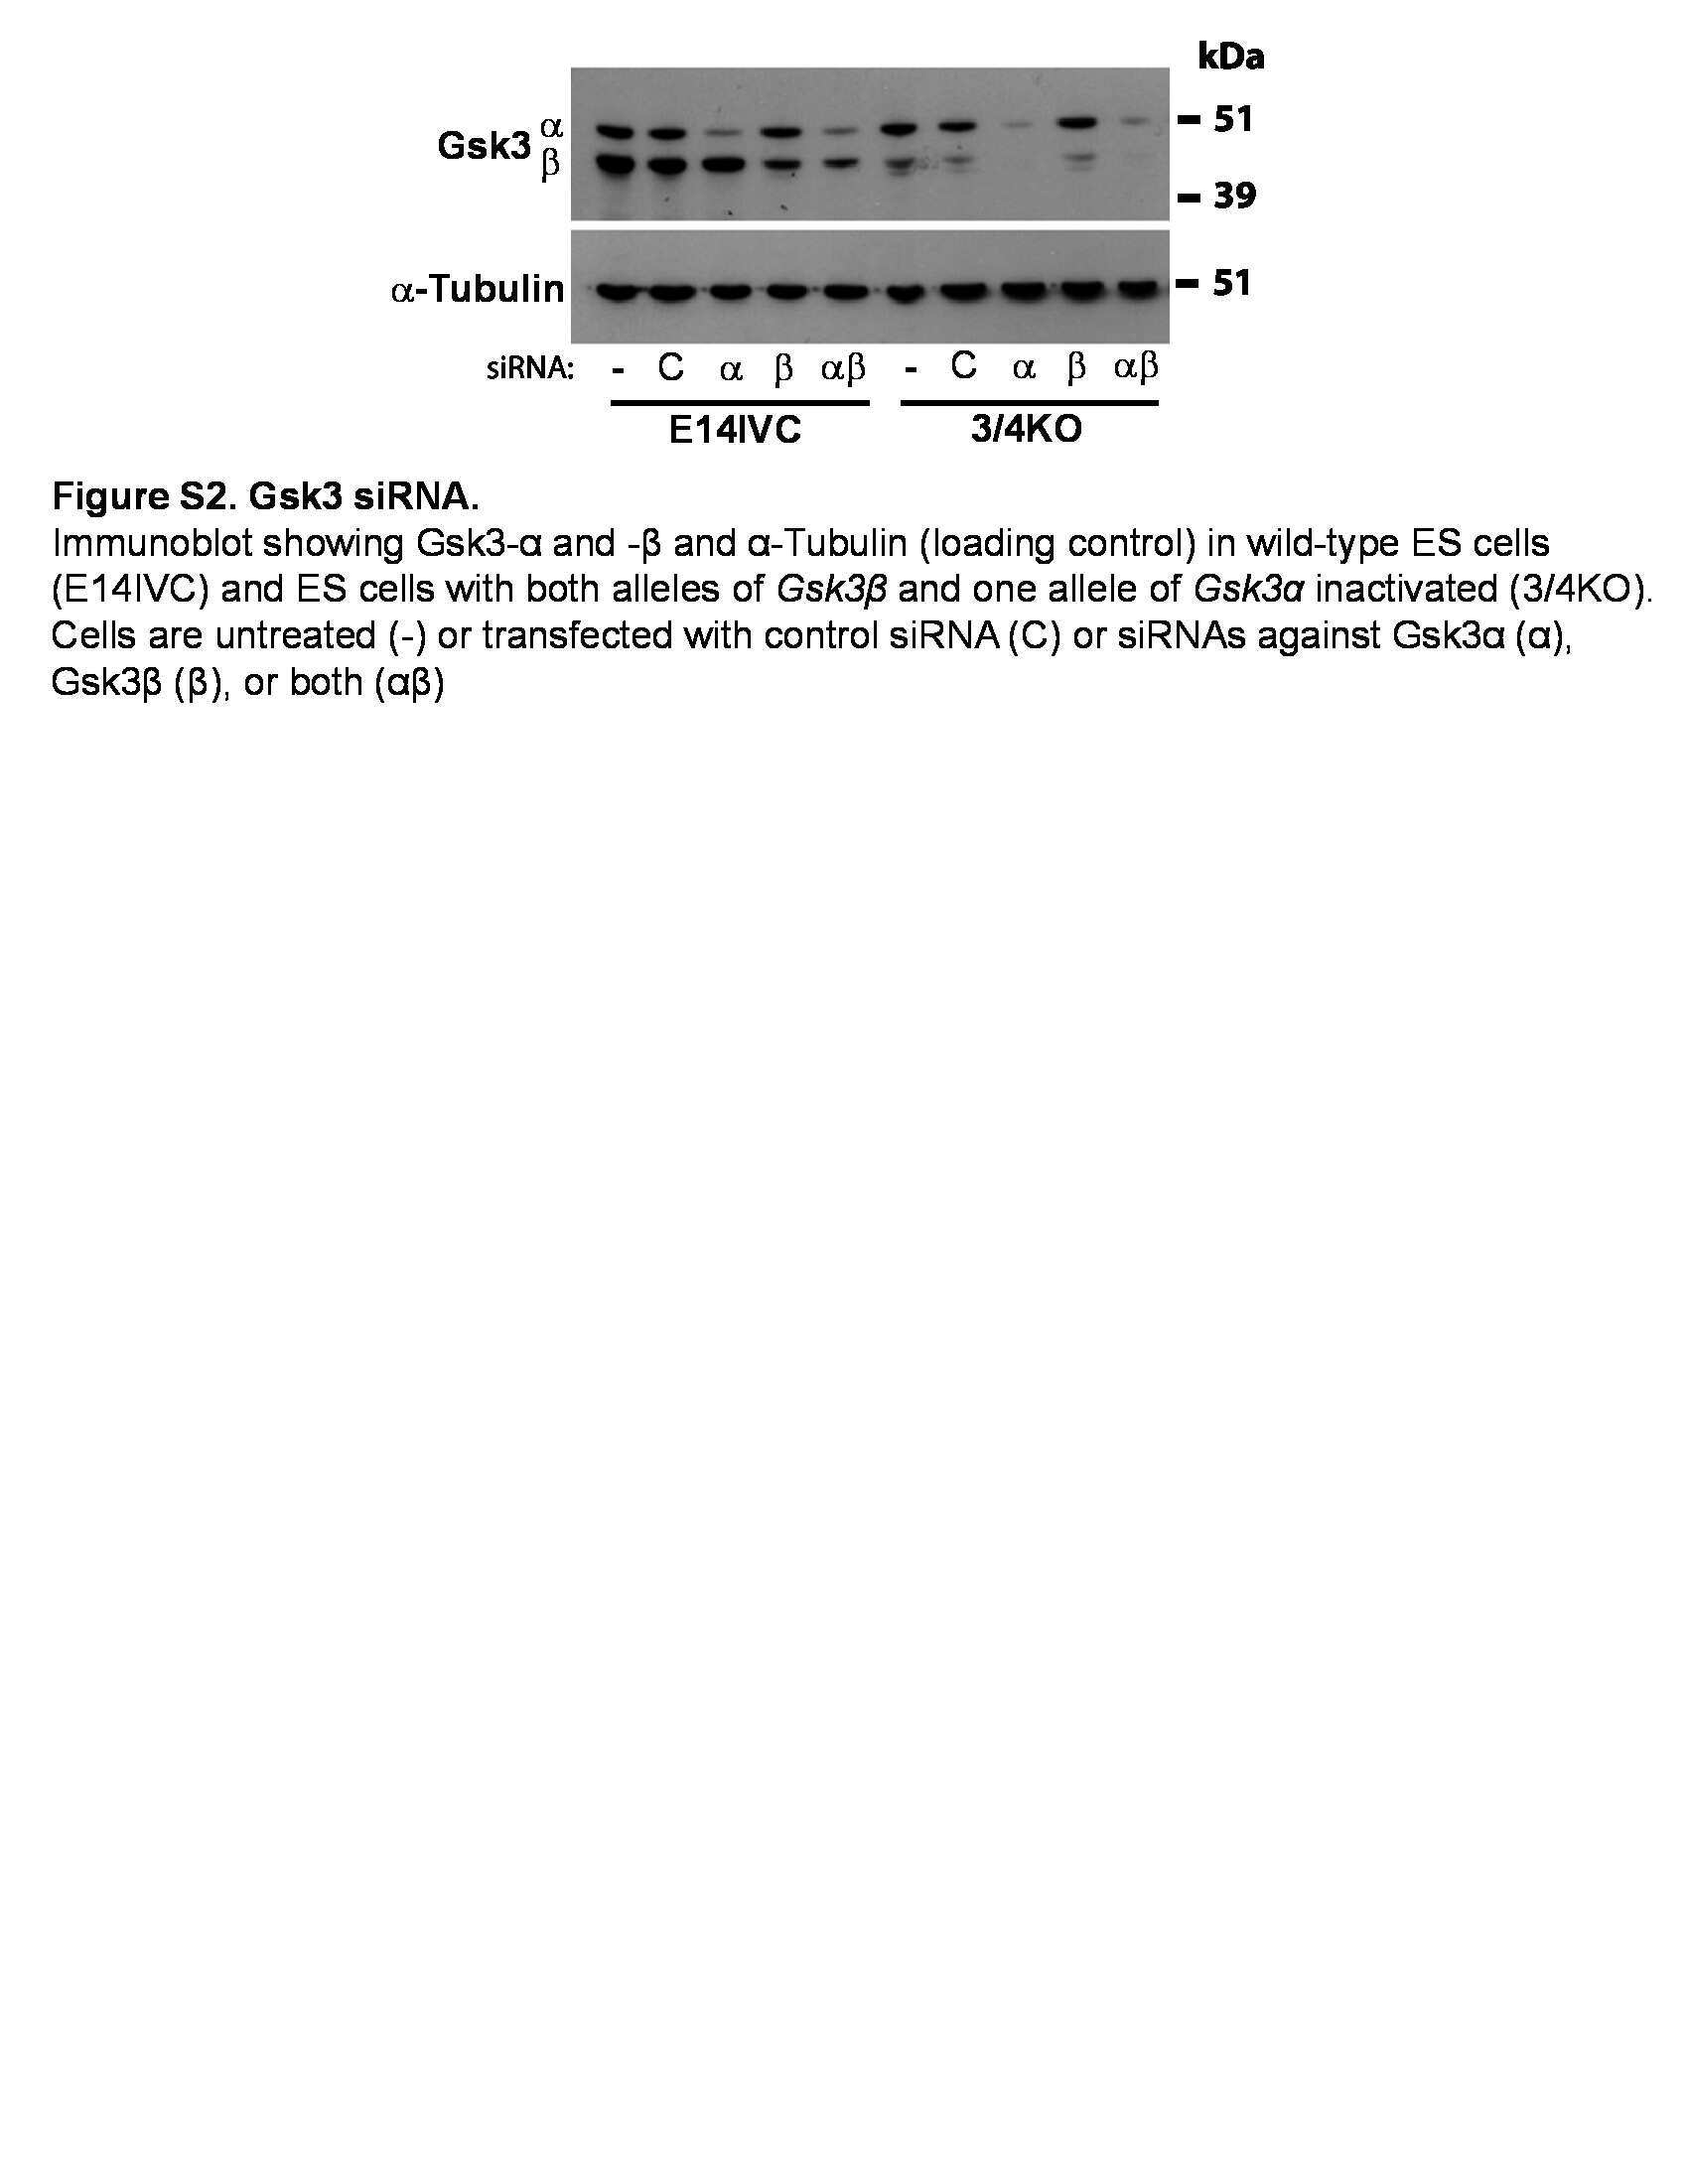
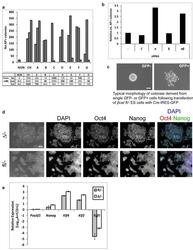
- Figure 1 Suppression of Gsk3 mediates enhanced ES cell self-renewal but beta-catenin is dispensable for ES cell maintenance (a). Histogram showing number of undifferentiated (alkaline phosphatase positive, AP+), colonies formed from 600 E141VC ES cells plated in N2B27 with Mek inhibitor PD0325901 (PD, 1 muM) plus CHIRON99021 (CH); or alternative Gsk3 inhibitors A, B, C, D, E, F, and G (see methods for details). Concentrations (Conc) of the inhibitors (nM) are indicated in the table beneath the graph. 1 st , 2 nd and 3 rd correspond to the bars from left to right. Optimum concentrations are shown in bold print. (b). Histogram showing relative number of undifferentiated (alkaline phosphatase positive, AP+), colonies formed from 600 3/4KO ES cells plated in N2B27 plus PD. Cells were untreated (-) or transfected with control siRNA (C) or siRNAs against Gsk3alpha (alpha), Gsk3beta (beta), or both (alphabeta). Mean of two biological replicates. (c). Phase contrast images showing typical morphology of primary colonies isolated from GFP-negative (left) and -positive (right) fractions of betacat fl/- ES cells transiently transfected with Cre-IRES-GFP. Note the lack of cell-cell contacts in colonies from the GFP-positive fraction. Scale bar, 200mum (d). Phase contrast and fluorescent images showing immunostaining of betacat fl/- and betacat Delta/- ES cells for Oct4 and Nanog. Scale bar, 100mum. (e). Histogram showing gene expression in betacat fl/- and betacat Delta/- ES cells culture

- Submitted by
- Invitrogen Antibodies (provider)
- Main image
- Experimental details
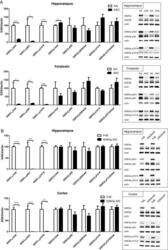
- Figure 10 Biochemical analysis of protein Tau in GSK3alpha deficient mice. A . Biochemical analysis by western blotting of total protein extracts from forebrain of AAC and AA- mice aged 3, 6 and 18 months (n=5/age). Tau protein levels are normalized to actin and expressed relative to control AA- mice at age 3 months. Data (mean+-SEM) are statistically analyzed by two-way Anova (Bonferroni post hoc test), genotype: F (1,24) =3.40, p=0.5093; age: F (2,24) =37.60, p=0.0027; interaction: F (2,24) =0.20, p=0.7759. Lower panels show representative western blots. B . Biochemical analysis by western blotting for phospho-epitopes pS396/404, pS199 and pT231 of endogenous mouse Tau in total protein extracts from hippocampus and forebrain of AAC and control AA- mice. C . Biochemical analysis by western blotting for phospho-epitopes pS396/404, pS199 and pT231 of endogenous mouse Tau in total protein extracts from hippocampus and cortex of GSK3alpha.KO and FVB wild-type mice. D . Biochemical analysis by western blotting for phospho-epitopes pS396/404, pS199 and pT231 of human Tau.P301L in total protein extracts from hippocampus and cortex of GSK3alpha.KOxTau.P301L mice and the parental Tau.P301L mice. In panels B-D , all data are normalized for total Tau and reported relative to the respective control mice. Data (mean+-SEM) are statistically analyzed by unpaired Student's t-test (two-tailed), n=6 or 7 per genotype; * p

- Submitted by
- Invitrogen Antibodies (provider)
- Main image
- Experimental details
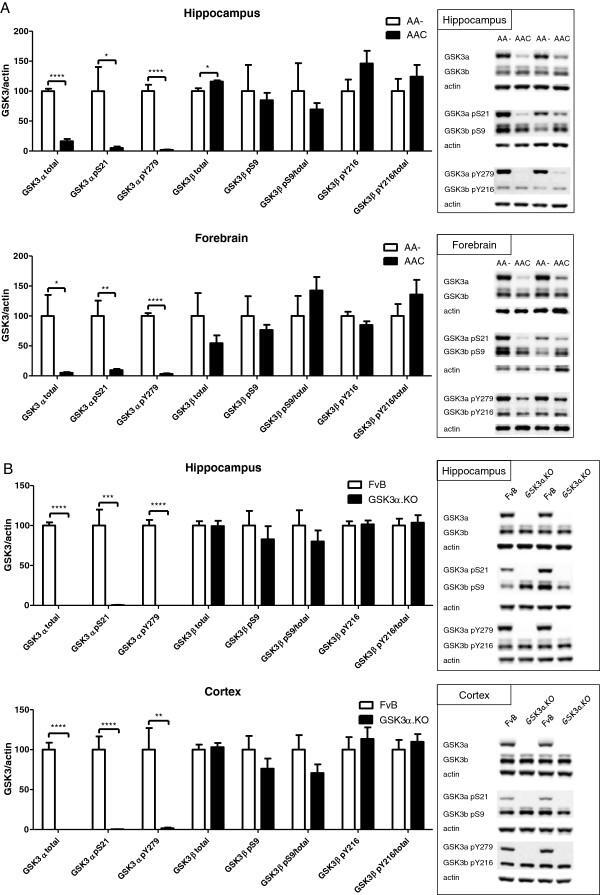
- Figure 2 Biochemical analysis of GSK3 isozymes in mouse brain extracts. Levels of total GSK3 protein, pS21/S9 and pY279/Y216 in total protein extracts from hippocampus and forebrain from AAC mice compared to control AA- mice ( A ) and from hippocampus and cortex from GSK3alpha.KO mice versus wild-type FvB mice ( B ). Western blots were digitally quantified, normalized for actin and reported relative to the respective control mice. Data (mean+-SEM) are statistically analyzed by unpaired Student's t-test (two-tailed), n=6 or 7 per genotype; *p
- Submitted by
- Invitrogen Antibodies (provider)
- Main image
- Experimental details
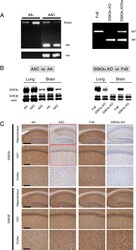
- Figure 1 Genotyping and characterization of neuron-specific and total GSK3alpha deficient mice. A . Genotyping by PCR reveals floxed or recombined (del) GSK3alpha alleles in AAC and AA- mice by the action of Cre-recombinase (Cre) (left panel). In GSK3alpha.KO mice (right panel) the same PCR reaction defines wild-type (WT) and recombined GSK3alpha alleles (del) in homozygous and heterozygous GSK3alpha.KO mice. B . Representative western blots for the GSK3 isozymes in total protein extracts of brain and lung from AA-, AAC, FvB and GSK3alpha.KO mice, as indicated. Note some residual GSK3alpha protein in the brain of AAC mice as opposed to the total absence in the GSK3alpha.KO mice. The minor non-specific reaction observed in extracts of lungs of GSK3alpha.KO mice was caused by a non-identified protein. C . Representative IHC of hippocampus, CA1 and cortex for either GSK3 isozyme on brain sections from both deficient genotypes and their respective control mice: AAC versus AA- mice and GSK3alpha.KO versus wild-type FvB mice. Note some residual GSK3alpha immunoreaction in the hippocampus of AAC mice, as opposed to total absence in GSK3alpha.KO mice (cfr text for details).

- Submitted by
- Invitrogen Antibodies (provider)
- Main image

- Experimental details
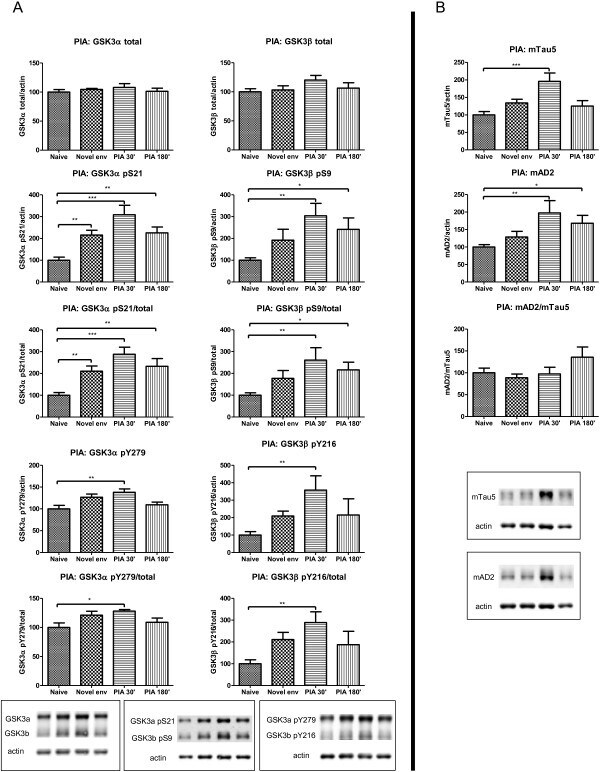
- Figure 8 Biochemical repercussions of PIA on GSK3 and protein tau in hippocampus of wild-type mice. A . Biochemical analysis of GSK3 by western blotting of total protein extracts from hippocampus of FvB wild-type mice (n=10) at different timepoints before or after they performed the PIA task (n=6 per timepoint). All data normalized to actin and reported relative to naive control mice. Data (mean+-SEM) are statistically analyzed by one-way Anova (Dunnet's post hoc test compared to naive). GSK3alpha: F (3,24) =0.5422; p=0.6581. GSK3beta: F (3,24) =1.523; p=0.2339. GSK3alpha pS21: F (3,24) =12.58; p
- Submitted by
- Invitrogen Antibodies (provider)
- Main image
- Experimental details
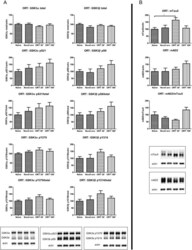
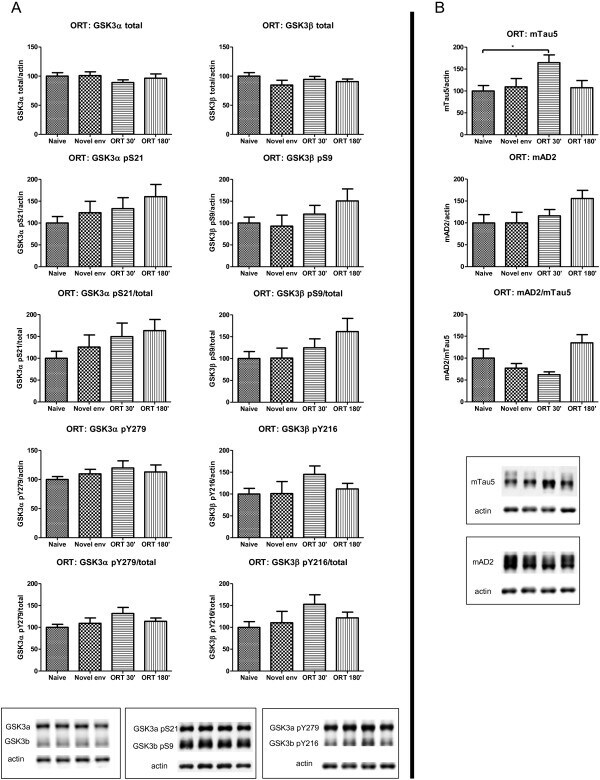
- Figure 9 Biochemical repercussions of NORT on GSK3 and Tau in hippocampus of wild-type mice. A . Biochemical analysis of GSK3 by western blotting of total protein extracts from hippocampus of FvB wild-type mice (n=10) at difference timepoints before or after they performed the NORT task (n=6 per timepoint). All data normalized to actin and reported relative to naive control mice. Data (mean+-SEM) are statistically analyzed by one-way Anova (Dunnet's post hoc test compared to naive). GSK3alpha: F (3,24) = 0.6609; p=0.5842. GSK3beta: F (3,24) = 1.131; p=0.3566. GSK3alpha pS21: F (3,24) = 1.351; p=0.2816. GSK3alpha pS21/total: F (3,24) = 1.529; p=0.2327. GSK3beta pS9: F (3,24) = 1.469; p=0.2479. GSK3beta pS9/total: F (3,24) = 1.699; p=0.1939. GSK3alpha pY279: F (3,24) = 1.002; p=0.4091. GSK3alpha pY279/total: F (3,24) = 1.871; p=0.1614. GSK3beta pY216: F (3,24) = 1.302; p=0.2967. GSK3beta pY216/total: F (3,24) = 1.580; p=0.2203. Lower panels show representative western blots. B . Biochemical analysis of protein Tau by western blotting of total protein extracts from hippocampus of FvB wild-type mice (n=10) at difference timepoints before or after they performed the NORT task (n=6 per timepoint). All data normalized to actin and reported relative to naive control mice. Data (mean+-SEM) are statistically analyzed by one-way Anova (Dunnet's post hoc test compared to naive). Tau5: F (3,24) = 3.286; p=0.0380. AD2: F (3,24) = 1.637; p=0.2071. AD2/Tau5: F (3,24) = 2.593; p=0.0
- Submitted by
- Invitrogen Antibodies (provider)
- Main image
- Experimental details
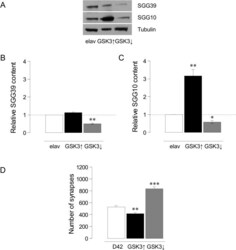
- Fig 1 Quantification of GSK3 isoforms levels and synaptic effects. A. Image from a representative immunoblot showing GSK3 levels in larval brains. The antibody recognizes the two larval GSK3 isoforms SGG39 (upper band) and SGG10 (middle band). Tubulin is shown as load control (lower band). B. Histograms show the content of SGG10 isoform in controls ( elav-Gal4 ), GSK3 over-expressers ( elav-Gal4/UAS-GSK3 ) and GSK3 under-expressers ( elav-Gal4/UAS-GSK3 RNAi ) normalized to Tubulin (n = 11 larval brains per lane, n = 3 independent Western blots). C. Histograms show the quantification of SGG39 levels in the three genotypes as above. ANOVA test, *p

- Submitted by
- Invitrogen Antibodies (provider)
- Main image
- Experimental details
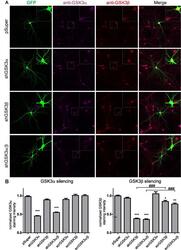
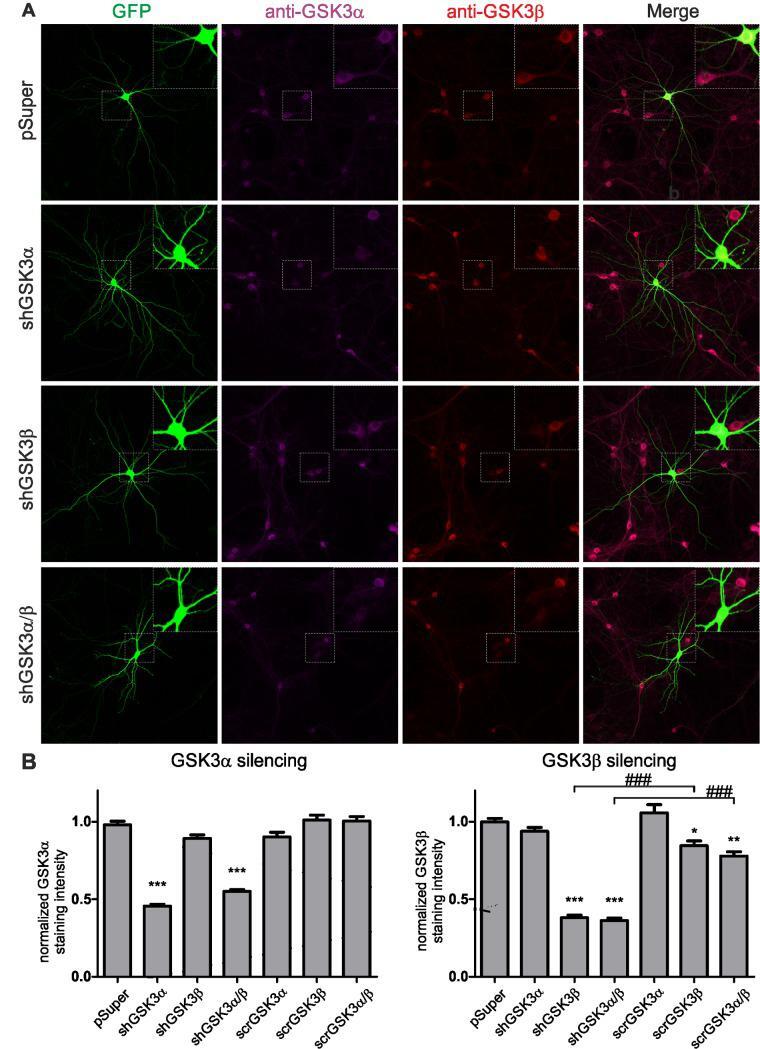
- Fig 3 Validation of GSK3 shRNAs and their scrambled counterparts. A. Representative micrographs of neurons transfected with shRNA constructs (as indicated) and immunofluorescently labeled for GSK3alpha or GSK3beta. Scale bar = 50 mum. B. Quantitative analysis of GSK3 silencing; * = p < 0.05, ** = p
- Submitted by
- Invitrogen Antibodies (provider)
- Main image

- Experimental details
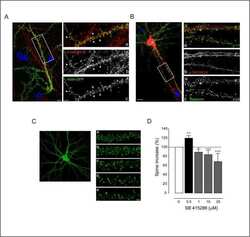
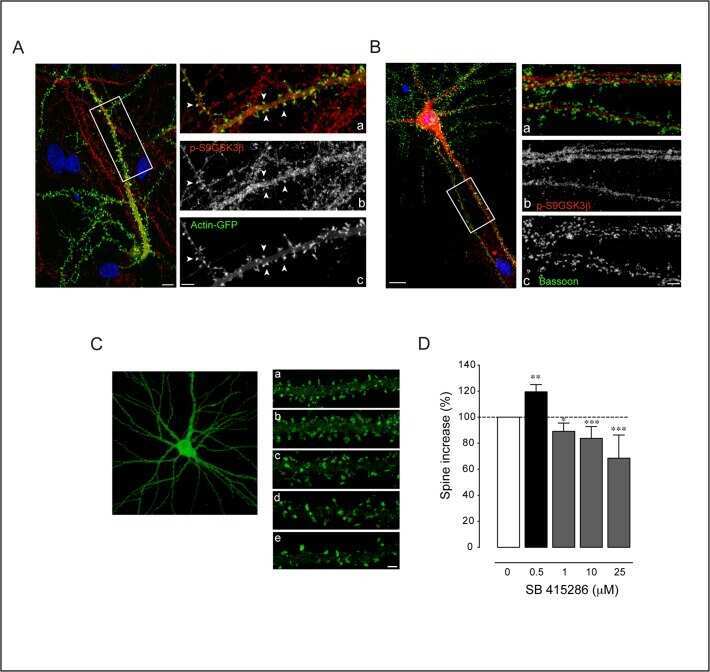
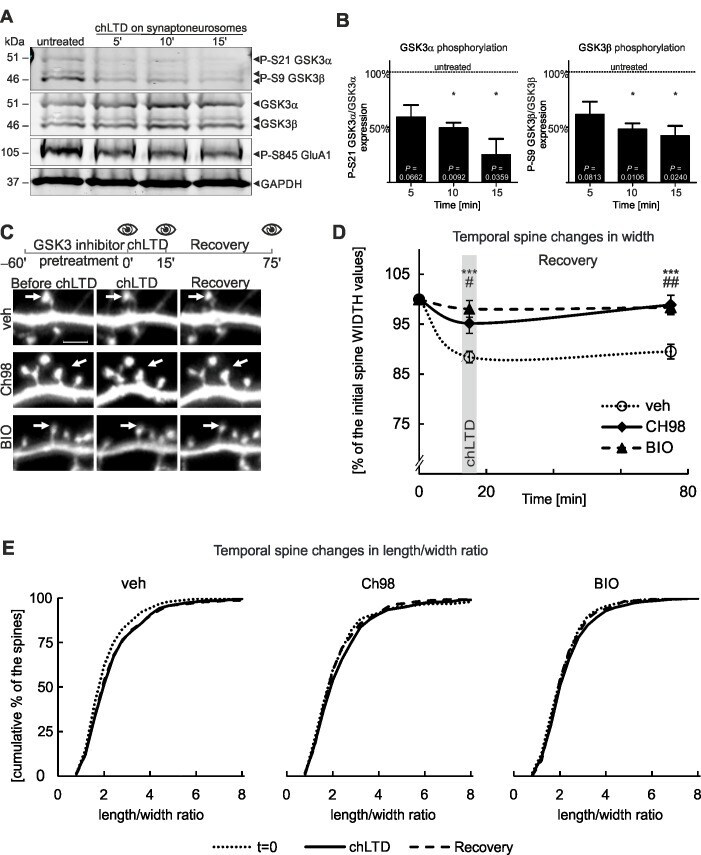
- Fig 2 Inhibition of GSK3alpha/beta activity in cultured neurons hinders spine structural plasticity upon chLTD A. chLTD activates GSK3alpha/beta in synaptoneurosomes isolated from murine hippocampi. Representative immunoblots, scanned with a Li-Cor Odyssey imager, for phospho-GSK3alpha (Ser21)/beta (Ser9), total GSK3alpha/beta, phospho-GluA1 (Ser845; LTD control) and GAPDH (loading control). B. Quantitative analysis of phospho-GSK3alpha/beta to the total-GSK3alpha/beta ratio at the time points indicated, expressed as % values of an untreated control. Data (n = 3 experiments) are presented as means +- s.e.m. * indicates a p
- Submitted by
- Invitrogen Antibodies (provider)
- Main image

- Experimental details
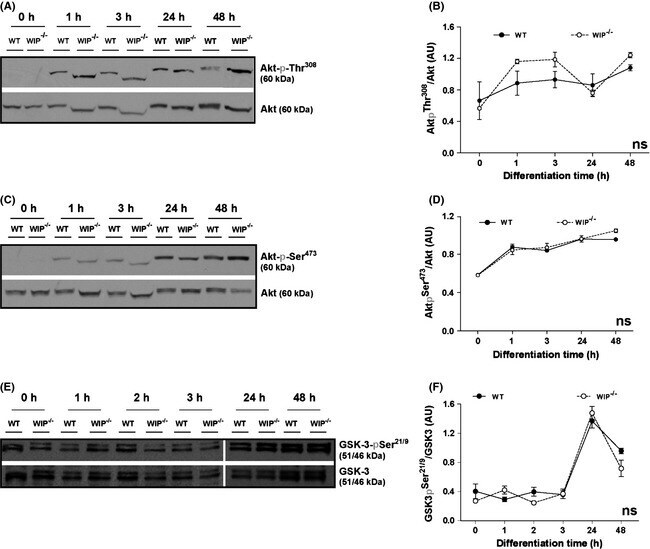
- Figure 2 Akt and GSK 3 phosphorylation are not modified in WIP -/- neurons. Soluble extracts were obtained from murine primary cortical neurons from WT or WIP -/- embryos and maintained in suspension (0) or cultured at high density for 1, 2, 3, 24, or 48 h on PLL -coated plates. Proteins analyzed in WB (25 mug/lane) were probed with antibodies to phosphoepitopes (A,B) Akt- pT hr 308 , (C,D) Akt- pS er 473 or (E,F) GSK 3- pS er 21/9 . Equivalent protein loading was confirmed using anti-Akt or - GSK 3 antibodies. Images show one representative experiment. Data show as mean +- SEM; from four independent experiments; ns, not significant (two-way ANOVA analysis).
- Submitted by
- Invitrogen Antibodies (provider)
- Main image

- Experimental details
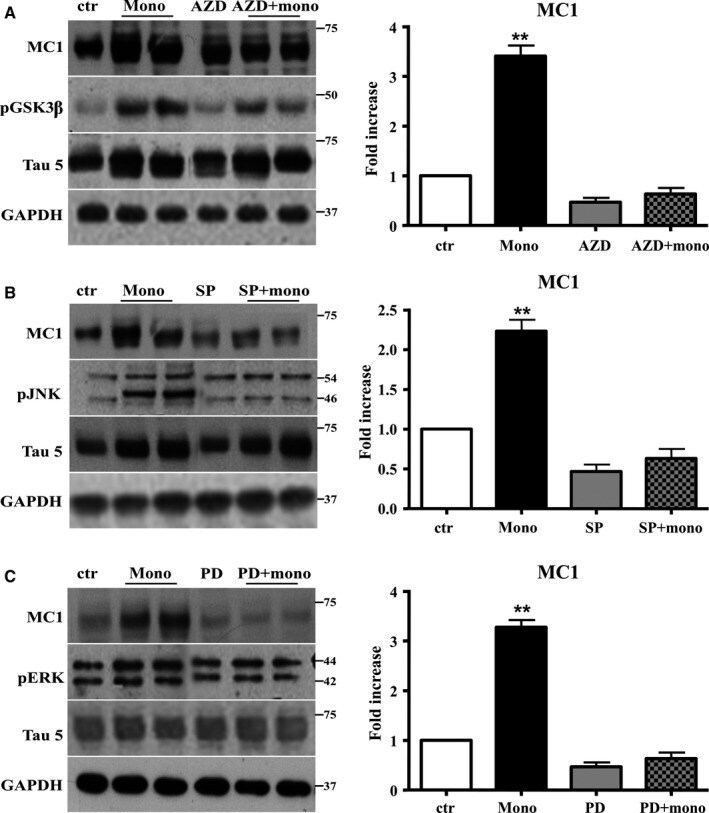
- Figure 6 The activation of JNK , ERK 1/2, and GSK is required to mediate the conformational change of Tau protein induced by Abeta1-42 monomers. Representative Western blot of brain extracts from control and pretreated or not with the GSK 3beta inhibitor AZD 1080, ERK inhibitor PD 98059, and JNK inhibitor SP 600125 before 3 h injection with Abeta1-42 Tau mice using MC 1 (A-C), pGSK 3beta (A), pJNK (B), and pERK 1/2 (C) antibodies for detection. An antibody raised against GAPDH or Tau5 served as loading control. Densitometric quantification shows that each pretreatment was followed by a complete inhibition of the pathway and by the complete reversion of Tau conformational change (A-C). The data are mean +- standard error of the mean ( SEM ), ** P < 0.01 vs. control by one-way ANOVA followed by Bonferroni post hoc test, n = 6 for each kinase.
- Submitted by
- Invitrogen Antibodies (provider)
- Main image
- Experimental details
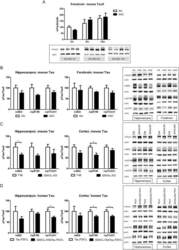
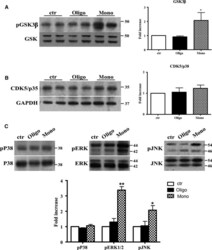
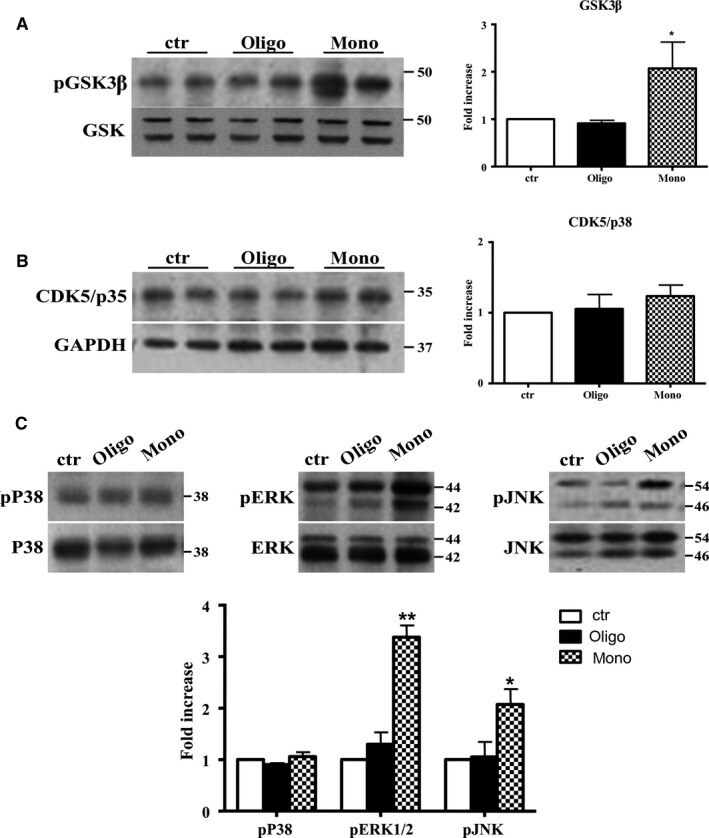
- Figure 4 Abeta1-42 monomers affect Tau phosphorylation through GSK 3beta, ERK 1/2, and JNK kinases activation. Representative Western blot of brain extracts from control (saline) and treated mice using pGSK 3beta (A), CDK 5/p35 (B), pP 38, pERK 1/2, and pJNK (C) antibodies for detection. Densitometric quantification shows an increase in the total protein level of pGSK 3beta induced by monomers (A), while CDK 5/p35 was not modified by any treatments (B). (A,B) An antibody raised against GAPDH was used as loading control. The data are mean +- standard error of the mean ( SEM ), * P < 0.05 vs. control by one-way ANOVA followed by Bonferroni post hoc test, n = 6 for each kinase. (C) pP 38, pERK 1/2, and pJNK levels were standardized against their respective total protein amount. Densitometric quantification shows an increase of ERK 1/2 and JNK activity due to monomers, while p38 was not involved by any treatments. The data are mean +- standard error of the mean ( SEM ), * P < 0.05; ** P < 0.01 vs. control by two-way ANOVA followed by Bonferroni post hoc test, n = 3 for each kinase.
- Submitted by
- Invitrogen Antibodies (provider)
- Main image

- Experimental details
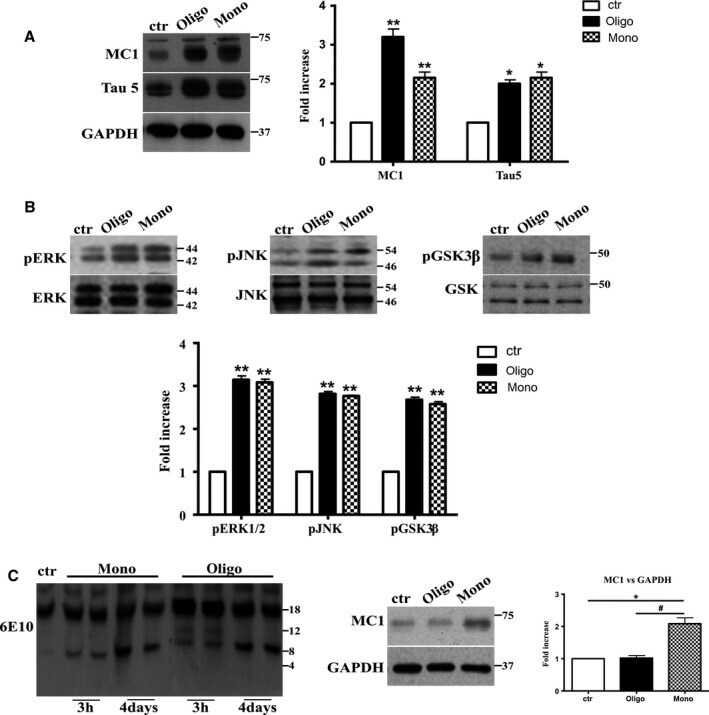
- Figure 5 After 4 days of treatment, Abeta1-42 oligomers and the monomers show a similar effect on Tau protein and phospho-kinases. Representative Western blot of brain extracts from control (saline) and treated mice using MC 1 and Tau5 (A), pERK 1/2, pJNK , and pGSK 3beta (B) antibodies for detection. (A) Densitometric quantification shows an increase in the total protein level of both MC 1 and Tau5 induced by both preparations. An antibody raised against GAPDH served as loading control. The data are mean +- standard error of the mean ( SEM ), * P < 0.05, ** P < 0.01 vs. control by one-way ANOVA followed by Bonferroni post hoc test, n = 3. (B) Densitometric quantification shows an increase of ERK 1/2 and JNK activity due to both monomers and oligomers treatments. pERK 1/2 and pJNK levels were standardized against their respective total protein amount. The data are mean +- SEM , ** P < 0.01 vs. control by two-way ANOVA followed by Bonferroni post hoc test, n = 3 for each kinase. (C) Representative Western blot of the aggregation state of Abeta1-42 in brain tissue of hT au mice injected after 3 h or 4 days with both preparations using the 6E10 antibody. As shown, the aggregation state of oligomeric preparation was different in the short and in the longer treatment: After 3 h, a band of approximately 12 Kda was observed, whereas after 4 days, this band was no more detectable. The data are mean +- SEM , ** P < 0.01 vs. control by two-way ANOVA followed by Bonferroni post hoc test
- Submitted by
- Invitrogen Antibodies (provider)
- Main image
- Experimental details
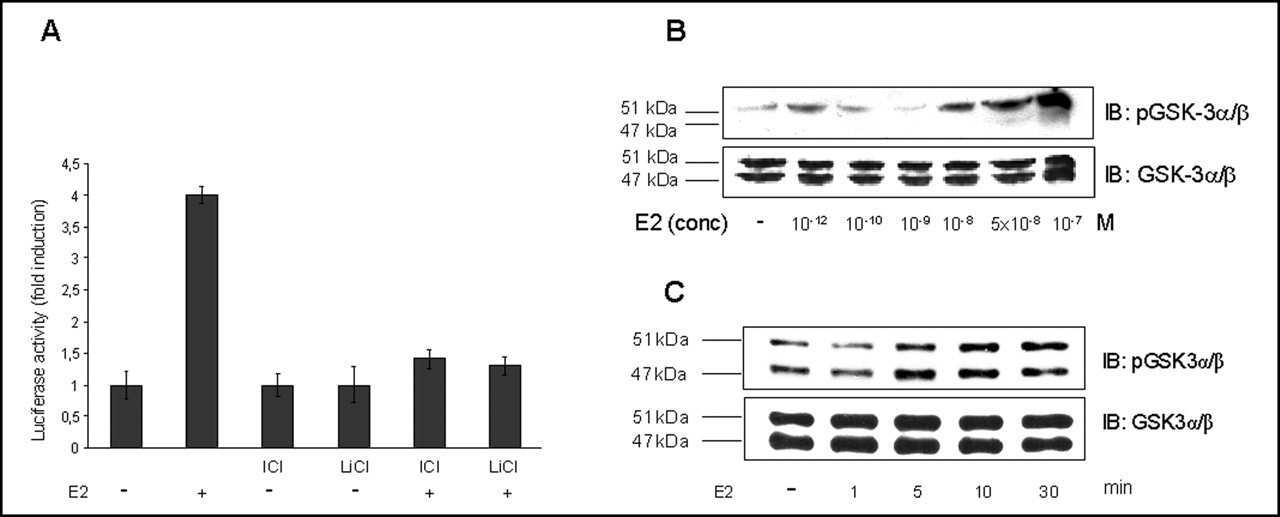
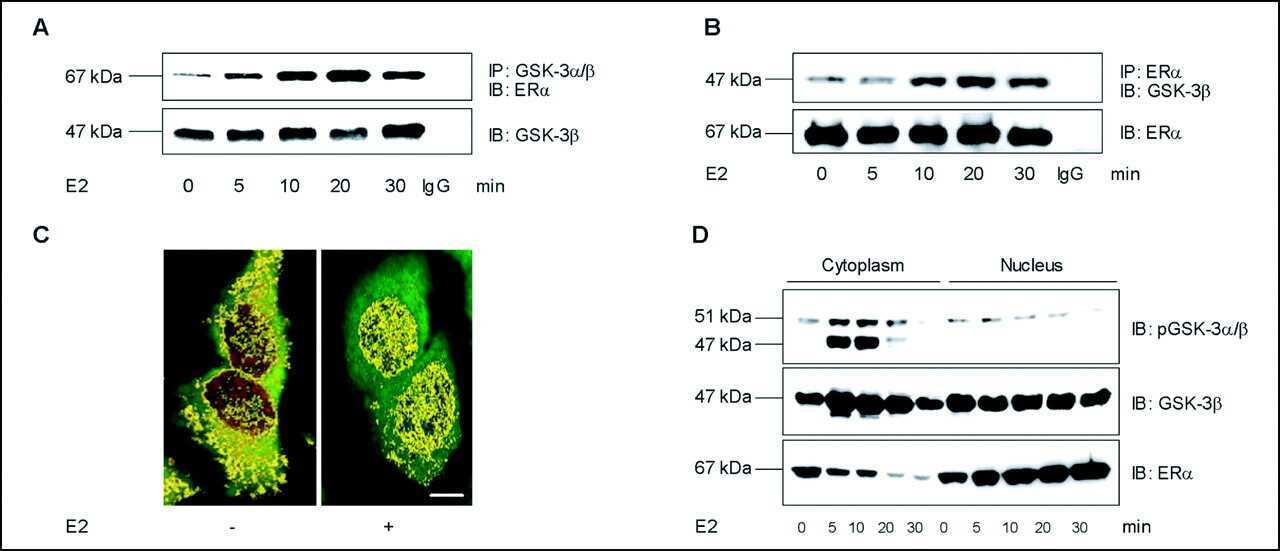
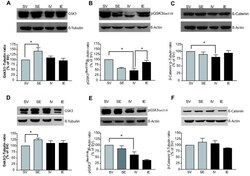
- Figure 5 Post-ischemic estradiol treatment restores pGSK3Ser21/9 levels in the cerebral cortex but not the hippocampus. Levels of phosphorylated GSK3 and total beta-catenin (a substrate of GSK3) were measured in western blots of homogenates from the ipsilateral cerebral cortex ( A , B , C ) and hippocampus ( D , E , F ). The bar graphs show the total GSK3 ( A , D ), the pGSK3Ser21/9 ( B , E ), and the total beta-catenin ( C , F ), as well as representative blots. The data represent the mean of three to five independent experiments, using beta-tubulin or beta-actin as loading controls. In the ipsilateral cortex ( B ) and hippocampus (E), pMCAO (IV group) significantly reduced the pGSK3Ser21/9 levels and total beta-catenin levels 54 h after the onset of ischemia when compared with the SV group. Post-pMCAO estradiol treatment attenuated the decrease in pGSK3Ser21/9 (B) and beta-catenin ( C ) levels in the cerebral cortex, but it had no effect on pGSK3Ser21/9 levels in the hippocampus ( E ). No changes in total beta-catenin levels were observed in the hippocampus in any experimental group ( F ). Total GSK3 levels increased significantly following estradiol treatment in sham operated animals (SE), both in the cortex ( A ) and hippocampus ( C ), as compared with the corresponding control (SV) group. The data are expressed as mean +- SEM: * P

- Submitted by
- Invitrogen Antibodies (provider)
- Main image

- Experimental details
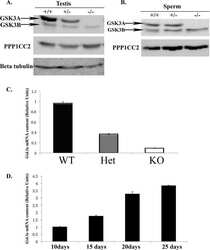
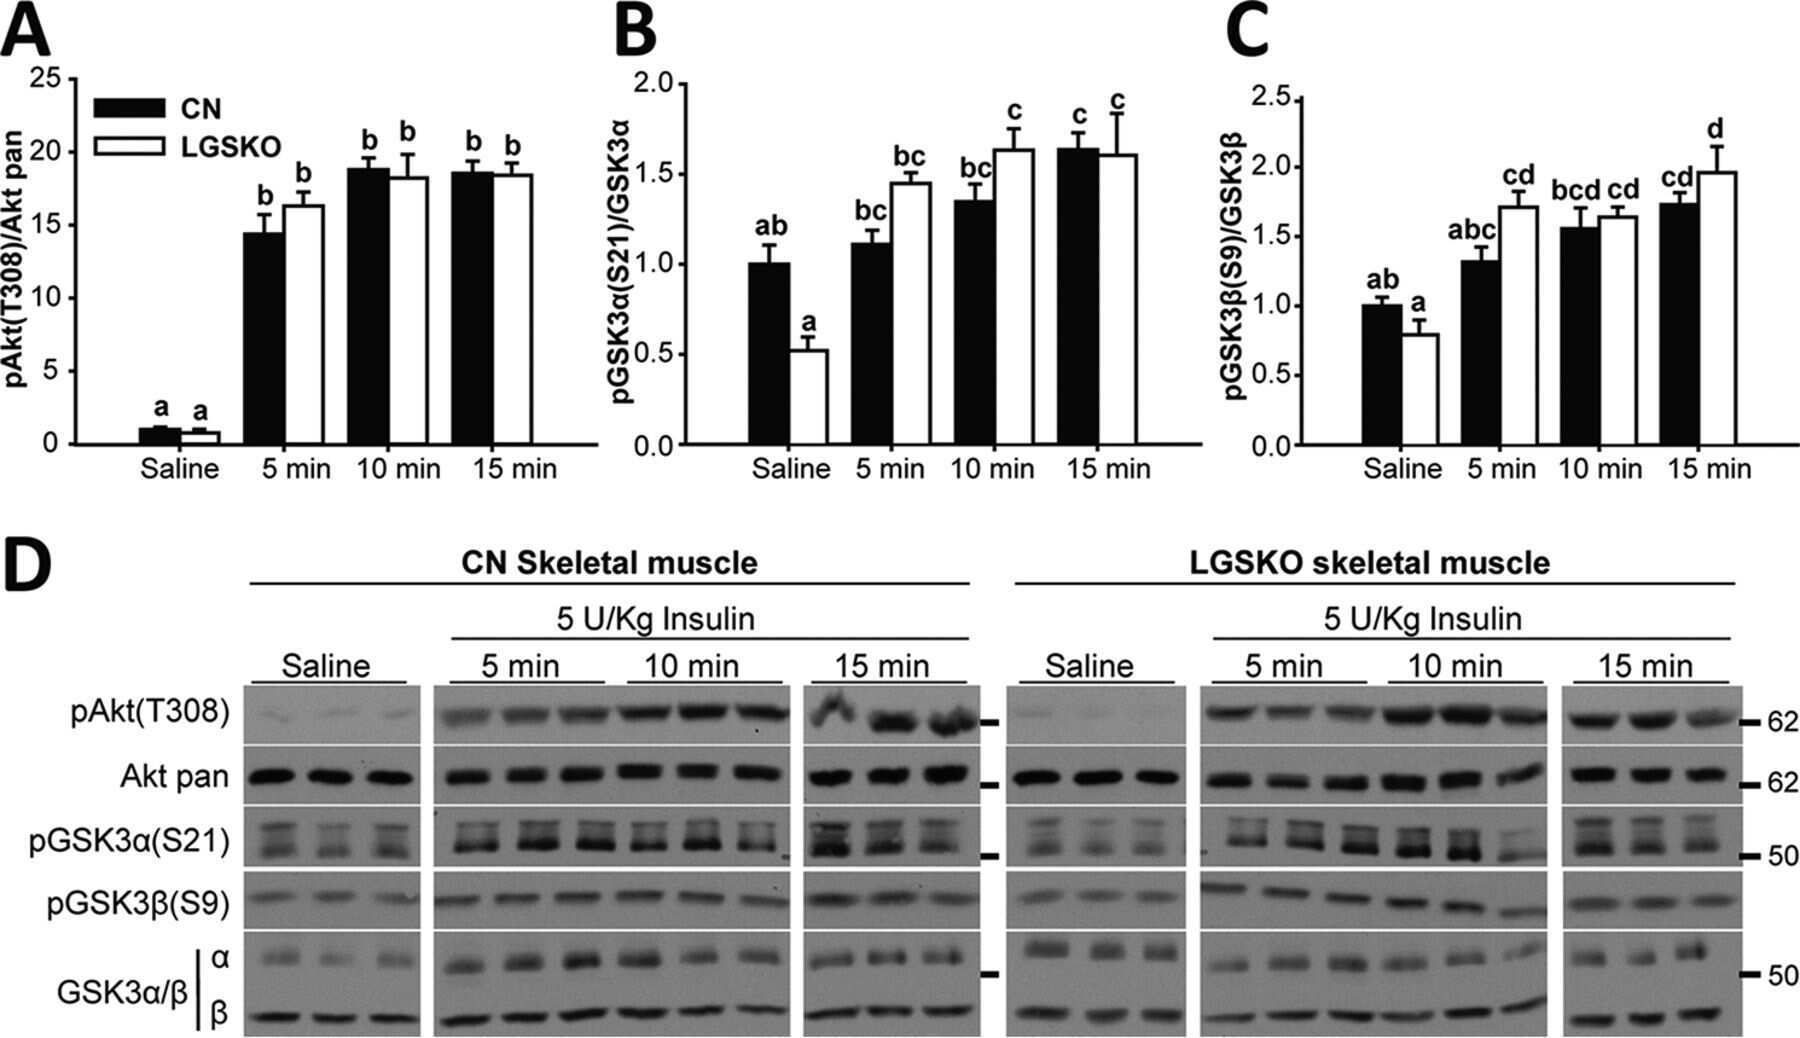
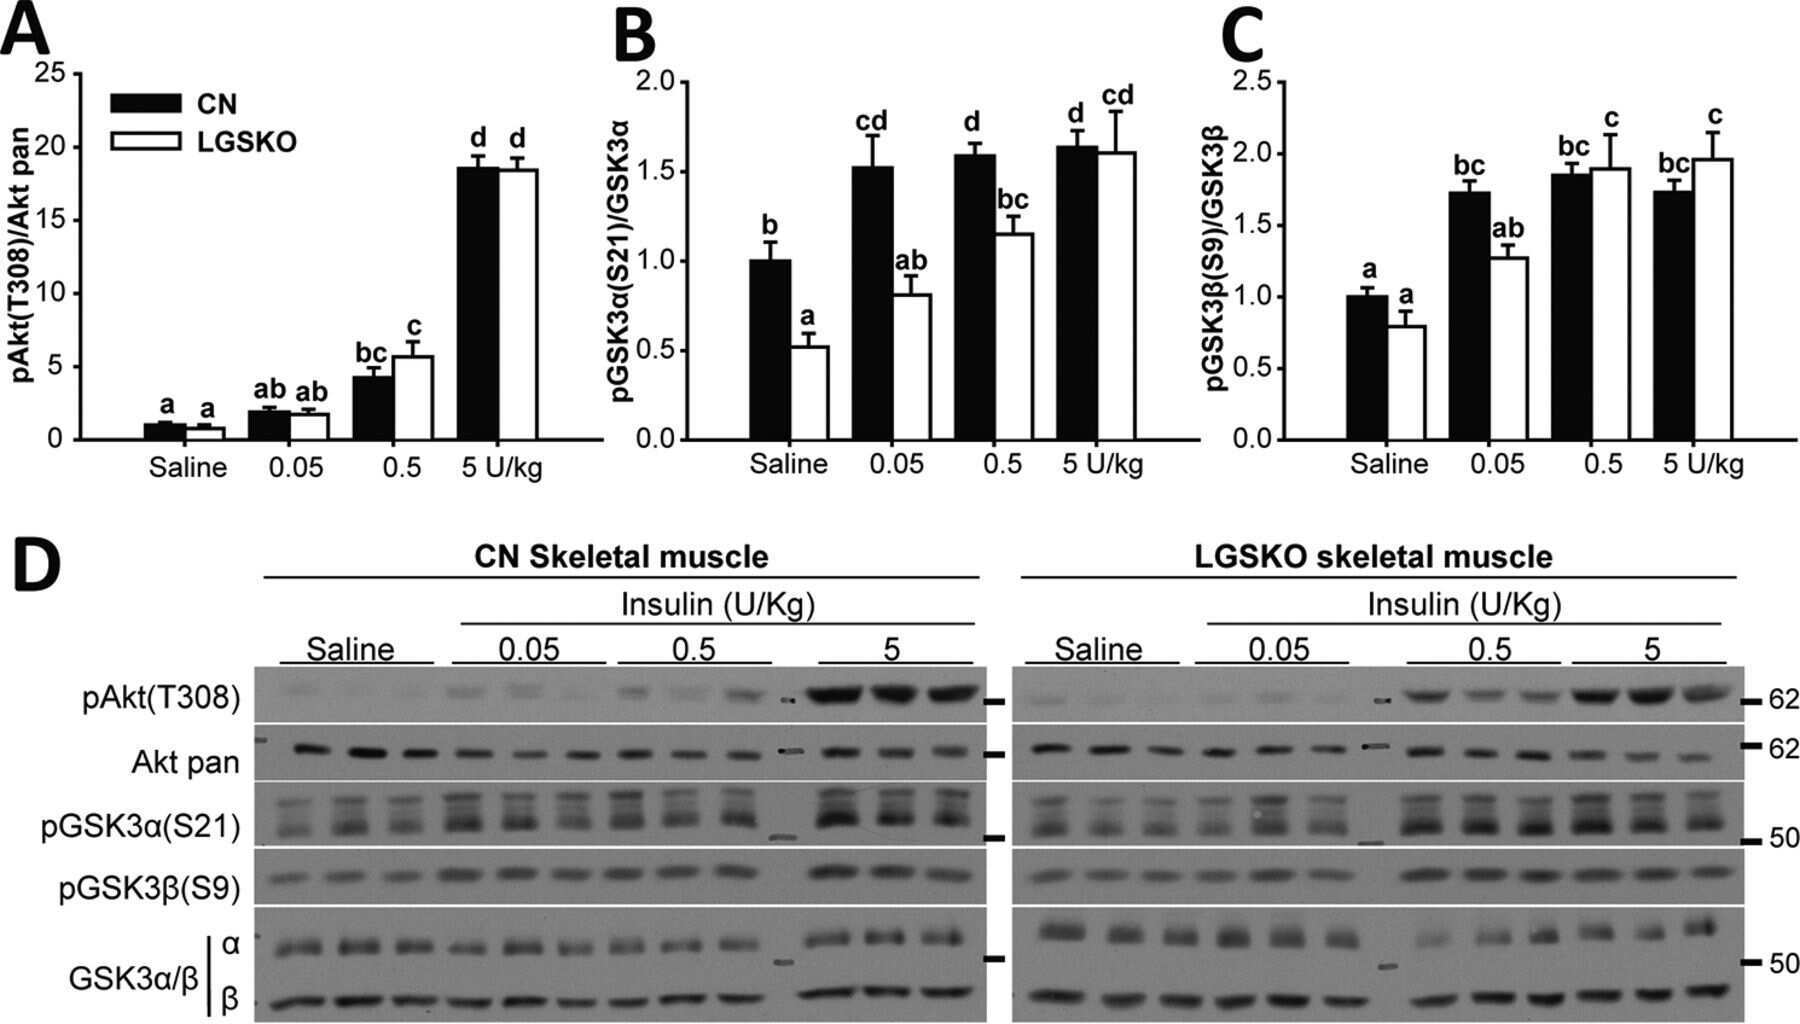
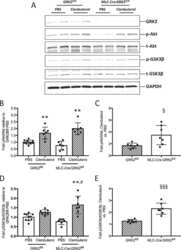
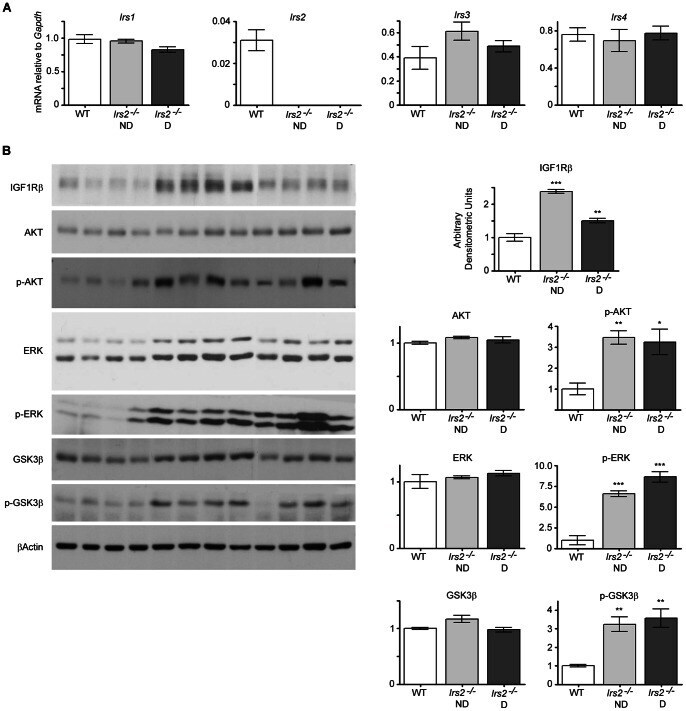
- Figure 7 Insulin signalling in the testes of Irs2 -deficient mice. (A) Gene expression of IRS proteins in the testes revealed that there were no differences in expression of Irs1 , Irs3 , or Irs4 between WT and Irs2 -deficient mice. Quantitative RT-PCR was performed using TaqMan probes. Each reaction was performed in duplicate and the value of the gene of interest was normalized to the expression of a control gene, Gapdh. For each gene, results are mean +- SEM of 5 WT, 5 Irs2 -/- ND, and 6 Irs2 -/- D mice. (B) Immunoblots of IGF1R, AKT, p-AKT, ERK, p-ERK, GSK3beta, and p-GSK3beta in the testis. Testes were homogenized in lysis buffer, 20 ug of total protein was loaded per lane, and blots were probed with the corresponding antibody. beta-actin was used as a loading control. The results are representative of three independent experiments. Band intensities were quantified using Adobe Photoshop (v.CS2) and the intensity ratio for each protein was normalized to that of beta-actin. Values obtained from testes of WT mice were set as 1 arbitrary densitometric unit. Results are mean +- SEM of 4 mice per phenotype. Asterisks denote a significant difference compared to WT; * P
- Submitted by
- Invitrogen Antibodies (provider)
- Main image
- Experimental details
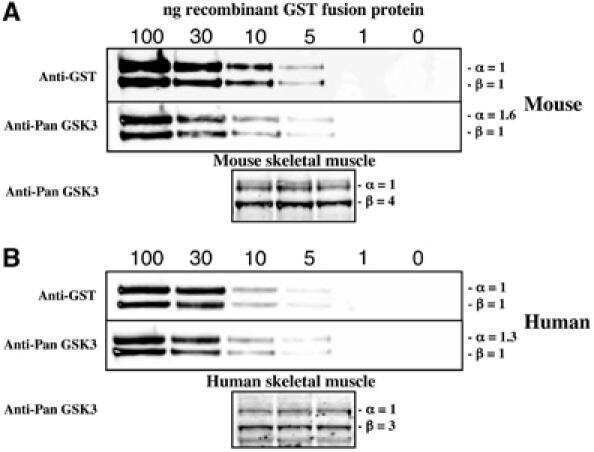
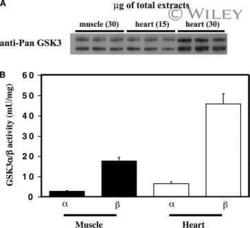
- Relative levels of GSK3alpha and GSK3beta in heart and skeletal muscle. (A) The indicated amounts of mouse skeletal muscle and heart derived from 3 wild type mice were subjected to quantitative immunoblot analysis with the Pan-GSK3 isoform antibody. (B) GSK3alpha and GSK3beta were immunoprecipitated from the same amount of skeletal and heart muscle employing isoform-specific antibodies and their activity was measured. The data are presented as the means +- S.E.M. for muscle isolated from 3 mice each assayed triplicate.

- Submitted by
- Invitrogen Antibodies (provider)
- Main image
- Experimental details
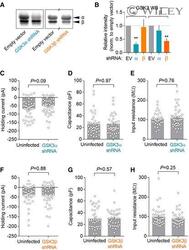
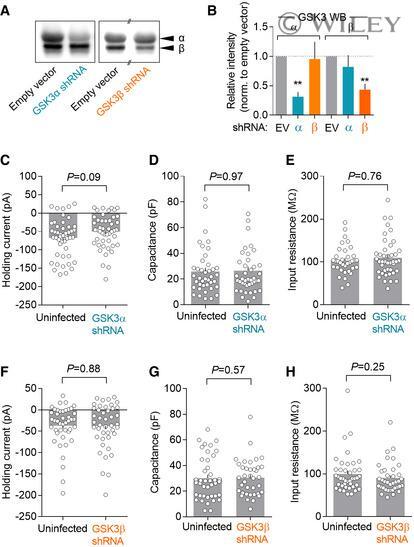
- EV1 Figure shRNA knock-down of GSK3 isoforms A Western blots from whole extracts of primary hippocampal neurons expressing shRNAs against GSK3alpha or GSK3beta, probed with an antibody against GSK3alpha/beta. B Quantification of background-subtracted integrated density of bands in A corresponding to GSK3alpha or GSK3beta, normalised to empty vector ( n = 4-8 independent experiments). In all cases, error bars represent SEM and statistical significance was calculated according to the Mann-Whitney U test. Asterisks (**) denote P < 0.01. C-E Holding current (C), whole-cell capacitance (D) and input resistance (E) from CA1 neurons in organotypic hippocampal slices expressing the shRNA for GSK3alpha. In all cases, error bars represent SEM and statistical significance was calculated according to the Mann-Whitney U test. F-H As (C-E), from neurons expressing the shRNA for GSK3beta. In all cases, error bars represent SEM and statistical significance was calculated according to the Mann-Whitney U test.
- Submitted by
- Invitrogen Antibodies (provider)
- Main image
- Experimental details
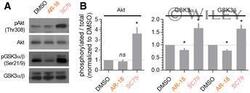
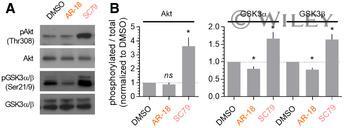
- EV3 Figure GSK3alpha/beta phosphorylation by pharmacological Akt activation A Western blot of whole extracts of acute hippocampal slices treated for 1 h with AR-18 (10 muM), SC79 (20 muM) or DMSO (vehicle control) and probed for phospho-Akt (Thr308), total Akt, phospho-GSK3alpha/beta (Ser21/9) and total GSK3alpha/beta. B Quantification of the ratio of phosphorylated to total protein, normalised to DMSO-treated slices, from n = 4 experiments as the one shown in (A). Error bars represent SEM, and statistical significance was calculated according to the Mann-Whitney U test. Asterisks (*) denote P < 0.05.
- Submitted by
- Invitrogen Antibodies (provider)
- Main image
- Experimental details
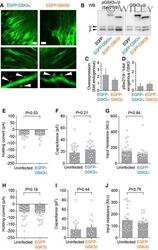
- EV4 Figure Overexpression of EGFP-GSK3 isoforms A Confocal fluorescence microscopy images showing Sindbis virus-mediated expression of EGFP-GSK3alpha (left panels) or EGFP-GSK3beta (right panels) in CA1 of rat organotypic hippocampal slices. Upper and middle panels represent low magnification examples of slices with dense or sparse infection, respectively. Lower panels show examples of high magnification images of dendritic spines (white triangles). Scale bar = 10 um. B Western blots from whole extracts of CA1 of organotypic hippocampal slices infected with Sindbis virus carrying EGFP alone, or expressing EGFP-GSK3alpha or EGFP-GSK3beta and probed with antibodies against phospho-Ser21/9 GSK3alpha/beta or total GSK3alpha/beta. C Quantification of blots shown in B, displaying the extent of overexpression of EGFP-GSK3alpha or EGFP-GSK3beta (exogenous/endogenous). Bars represent mean +- SEM. N = 2 independent experiments. D Quantification of blots shown in B, displaying the extent of serine phosphorylation of overexpressed EGFP-GSK3alpha or EGFP-GSK3beta, relative to total protein level and normalised to the equivalent ratio for the corresponding endogenous isoform. Bars represent mean +- SEM. N = 2 independent experiments. E-G Holding current (E), whole-cell capacitance (F) and input resistance (G) from neurons in organotypic hippocampal slices overexpressing EGFP-GSK3alpha. In all cases, error bars represent SEM and statistical significance was calculated according to the Mann-

- Submitted by
- Invitrogen Antibodies (provider)
- Main image

- Experimental details
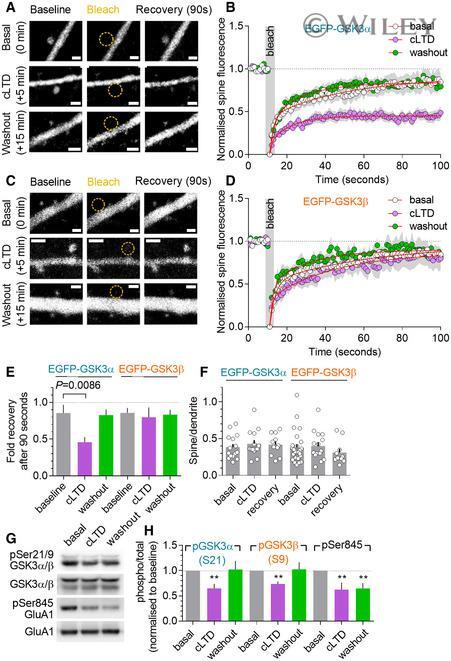
- 6 Figure GSK3a, but not GSK3beta, is transiently anchored in dendritic spines during LTD A Representative confocal images from EGFP-GSK3alpha FRAP experiments. Upper left panel (""Baseline"") shows EGFP-GSK3alpha expression in a dendrite and dendritic spine of organotypic slices cultured from rat hippocampus. The spine was bleached (""Bleach""; yellow dashed circle) and its fluorescence partially recovered 90 s later (""Recovery""). Single dendritic spines were imaged once per second for 10 s prior to, and for 90 s following, spine photobleaching. Such single FRAP experiments were performed on different spines during basal conditions (""basal""; upper panels), immediately after cLTD induction with 20 uM NMDA for 5 min (""cLTD""; middle panels), and immediately following 10 min of washout (""washout""; lower panels). Scale bars = 1 um. B Time course of fluorescence recovery during FRAP experiments described in A. White circles (""basal"") show the average spine/dendrite fluorescence of FRAP on EGFP-GSK3alpha-expressing spines in slices prior to cLTD induction. Pink circles (""cLTD"") show fluorescence in spines in which cLTD had been induced using 20 uM NMDA. Green circles (""washout"") represent the average of spine fluorescence after NMDA washout for 10 min. Recovery trajectories for the three conditions are fitted with two-phase exponential curves (red lines). C, D As (A, B) but for spines expressing EGFP-GSK3beta. Scale bars = 1 um. E Quantification of last 10 s of fluores
- Submitted by
- Invitrogen Antibodies (provider)
- Main image
- Experimental details
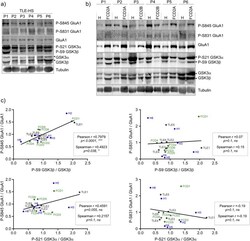
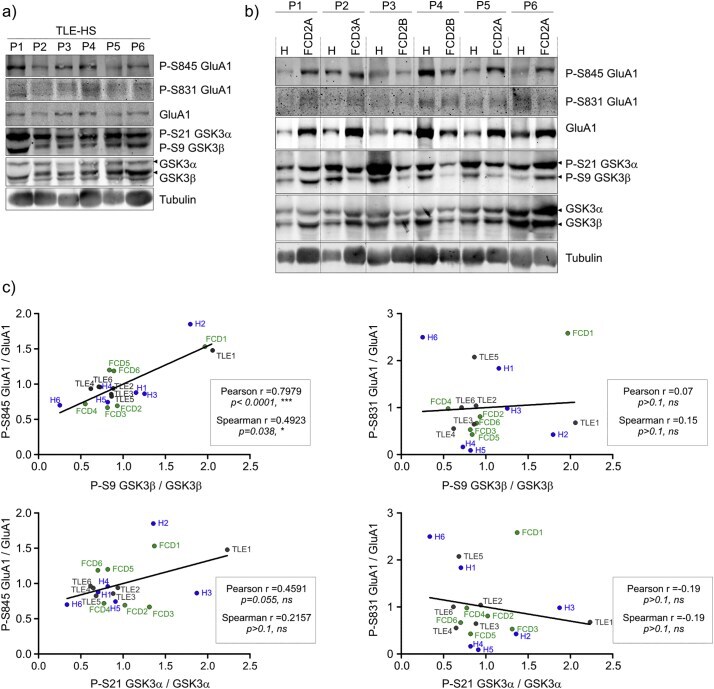
- Fig. 3 GSK3 inhibitory phosphorylation correlates with GluA1 (S845) phosphorylation in temporal lobe epilepsy and focal cortical dysplasia samples. (a,b) Western blot was used to determine the levels P-GluA1 (S845), P-GluA1 (S831), GluA1, P-GSK3alpha (S21), P-GSK3beta (S9), GSK3alpha and GSK3beta in samples from patients with temporal lobe epilepsy with hippocampal sclerosis (TLE-HS) and in clinical malformations of cortical development (FCD and hippocampi adjacent to FCD). Tubulin is shown as a loading control. (c) Correlation analysis of P-GluA1 (S831)/GluA1 or P-GluA1 (S845)/GluA1 and P-GSK3beta (S9)/GSK3beta or P-GSK3alpha (S21)/GSK3alpha. The data were analyzed as Pearson and Spearman correlation coefficients ( r ). Fig. 3
- Submitted by
- Invitrogen Antibodies (provider)
- Main image
- Experimental details
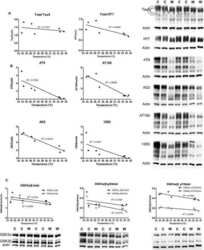
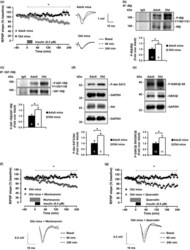
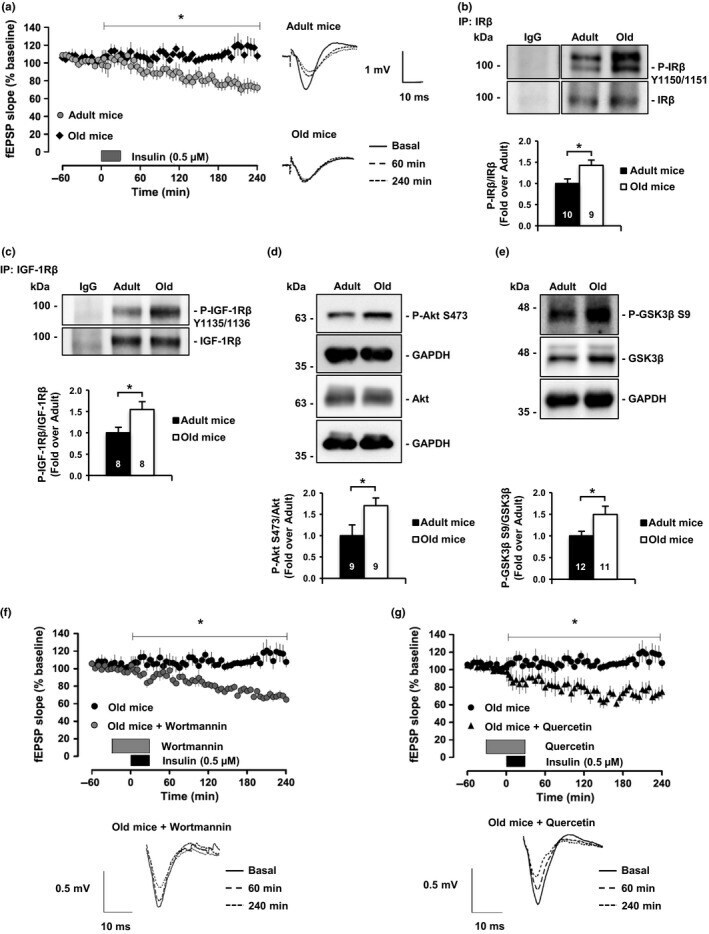
- Figure 1 Insulin signaling is impaired in old mice due to PI3K/Akt hyperactivation. (a) Insulin-LTD is completely abolished in old mice (20-24 months old; n = 7) compared to adult mice (7-12 months old; n = 10). The graphic represents insulin-LTD as fEPSP slope. Gray box indicates the time of insulin application. Representative analogue traces on the right were collected at the indicated time points. (b) Insulin receptor (IR) basal activity levels detected by Western blot using Phospho-Tyrosine 1150/1151 antibody after total protein immunoprecipitation. (c) Western blots reflect IGF-1R Phospho-Tyrosine 1135/1136 basal levels after total protein immunoprecipitation. Old mice hippocampus shows higher basal activity levels of IR and IGF1-R compared to adult mice. (d) Akt Phospho-Serine 473 activating residue detected by Western blot in adult and old mice hippocampus at basal level. (e) Western blot analysis of GSK3beta in hippocampal extracts from adult and old mice. Consistent with Akt hyperactivation, the old hippocampus presents high GSK3beta inhibitory mark (Phospho-Serine 9). (f, g) PI3K/Akt inhibition rescues insulin-LTD in old mice. Graphics showing insulin-LTD induction in hippocampal slices from old mice incubated with Wortmannin (f; 0.5 muM; n = 7) and Quercetin (g; 20 muM; n = 8). Black box indicates time of insulin application. Gray box indicates time of inhibitors application. Representative analogue traces below were collected at the indicated time points. Numbers
- Submitted by
- Invitrogen Antibodies (provider)
- Main image

- Experimental details
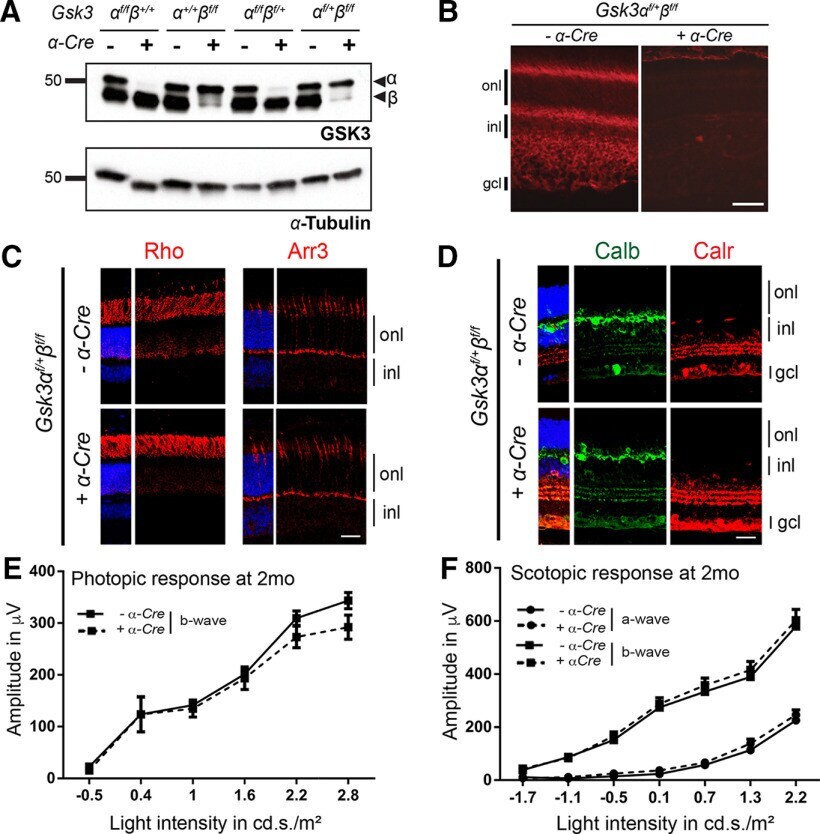
- Figure 2. One allele of either Gsk3alpha or Gsk3beta is sufficient for the development of a functional retina. A , Immunoblot analysis of protein extracts from 2-month-old animals with a different combination of Gsk3alpha and Gsk3beta floxed alleles ( Gsk3alpha f/f beta +/+ , Gsk3alpha +/+ beta f/f , Gsk3alpha f/+ beta f/f , or Gsk3alpha f/f beta f/+ ) with or without Cre recombinase using anti-pan GSK3 antibody (recognizing both isoforms) reveals decreased expression of GSK3alpha or GSK3beta (arrowheads). alpha -Tubulin is used as a loading control. B , IHC on 2-month-old retinal sections from control and Gsk3alpha f/+ beta f/f ; alpha-Cre retinas with or without Cre recombinase using anti-GSK3beta antibody (red) showing ubiquitous Gsk3beta expression in all retinal layers, whereas its expression is lost in the Cre-expressing retina. C , Expression of only one Gsk3 allele ( Gsk3alpha ) is sufficient for proper photoreceptor development. IHC using anti-rhodopsin (Rho; red) and anti-Cone arrestin (Arr3; red) antibodies to label rod and cone photoreceptors, respectively. D , Expression of only one Gsk3 allele ( Gsk3alpha ) is sufficient for proper interneuron development. IHC using anti-Calretinin (Calr; green) and anti-calbindin (Calb; red) antibodies to label horizontal and amacrine cells, respectively. onl, outer nuclear layer; inl, inner nuclear layer; gcl, ganglion cell layer. Scale bar, 20 mum. E , F , ERG recording in 2-month-old Gsk3alpha f/+ beta f/f ;alpha-Cre animals