Explore
 Validate
 Learn
Learn46-9999-42
antibody from Invitrogen Antibodies
Targeting: CXCR4
CD184, D2S201E, fusin, HM89, HSY3RR, LESTR, NPY3R, NPYR, NPYY3R
 Flow cytometry
Antibody data
- Antibody Data
- Antigen structure
- References [9]
- Comments [0]
- Validations
- Flow cytometry [1]
- Other assay [13]
Submit
Validation data
Reference
Comment
Report error
- Product number
- 46-9999-42 - Provider product page

- Provider
- Invitrogen Antibodies
- Product name
- CD184 (CXCR4) Monoclonal Antibody (12G5), PerCP-eFluor™ 710, eBioscience™
- Antibody type
- Monoclonal
- Antigen
- Other
- Description
- Description: The 12G5 monoclonal antibody reacts with human CD184 (CXCR4), also termed Fusin, LESTR, or HUMSTR. CD184 is a member of the G-protein-coupled chemokine receptor family with seven membrane-spanning domains, and functions as a coreceptor for X4 HIV-1 entry into CD4+ cells. CD184 is expressed predominantly on naive T cell subsets of peripheral blood and is rapidly upregulated by PHA and IL-2 stimulation. The 12G5 antibody shows partial inhibition of chemotaxis and calcium influx induced by SDF-1 (the natural ligand of CD184), blocks CD4-independent HIV-2 infection, and blocks CD4-dependent infection by some T-tropic HIV-1 isolates. Applications Reported: This 12G5 antibody has been reported for use in flow cytometric analysis. Applications Tested: This 12G5 antibody has been pre-titrated and tested by flow cytometric analysis of normal human peripheral blood cells. This can be used at 5 µL (0.06 µg) per test. A test is defined as the amount (µg) of antibody that will stain a cell sample in a final volume of 100 µL. Cell number should be determined empirically but can range from 10^5 to 10^8 cells/test. PerCP-eFluor® 710 emits at 710 nm and is excited with the blue laser (488 nm); it can be used in place of PerCP-Cyanine5.5. We recommend using a 710/50 bandpass filter, however, the 695/40 bandpass filter is an acceptable alternative. Please make sure that your instrument is capable of detecting this fluorochrome. Fixation: Samples can be stored in IC Fixation Buffer (Product # 00-822-49) (100 µL of cell sample + 100 µL of IC Fixation Buffer) or 1-step Fix/Lyse Solution (Product # 00-5333-54) for up to 3 days in the dark at 4°C with minimal impact on brightness and FRET efficiency/compensation. Some generalizations regarding fluorophore performance after fixation can be made, but clone specific performance should be determined empirically. Excitation: 488 nm; Emission: 710 nm; Laser: Blue Laser. Filtration: 0.2 µm post-manufacturing filtered.
- Reactivity
- Human
- Host
- Mouse
- Isotype
- IgG
- Antibody clone number
- 12G5
- Vial size
- 100 Tests
- Concentration
- 5 µL/Test
- Storage
- 4° C, store in dark, DO NOT FREEZE!
Submitted references Parallel functional assessment of m(6)A sites in human endodermal differentiation with base editor screens.
Cotargeting of miR-126-3p and miR-221-3p inhibits PIK3R2 and PTEN, reducing lung cancer growth and metastasis by blocking AKT and CXCR4 signalling.
Longitudinal single-cell profiling reveals molecular heterogeneity and tumor-immune evolution in refractory mantle cell lymphoma.
Senescent Tumor Cells Build a Cytokine Shield in Colorectal Cancer.
Dominant extrafollicular B cell responses in severe COVID-19 disease correlate with robust viral-specific antibody production but poor clinical outcomes.
The CXCR4 antagonist plerixafor (AMD3100) promotes proliferation of Ewing sarcoma cell lines in vitro and activates receptor tyrosine kinase signaling.
Modulatory effects of trophoblast-secreted CXCL12 on the migration and invasion of human first-trimester decidual epithelial cells are mediated by CXCR4 rather than CXCR7.
In Vitro Modeling of Alcohol-Induced Liver Injury Using Human-Induced Pluripotent Stem Cells.
ST8SIA4-Dependent Polysialylation is Part of a Developmental Program Required for Germ Layer Formation from Human Pluripotent Stem Cells.
Cheng W, Liu F, Ren Z, Chen W, Chen Y, Liu T, Ma Y, Cao N, Wang J
Nature communications 2022 Jan 25;13(1):478
Nature communications 2022 Jan 25;13(1):478
Cotargeting of miR-126-3p and miR-221-3p inhibits PIK3R2 and PTEN, reducing lung cancer growth and metastasis by blocking AKT and CXCR4 signalling.
Di Paolo D, Pontis F, Moro M, Centonze G, Bertolini G, Milione M, Mensah M, Segale M, Petraroia I, Borzi C, Suatoni P, Brignole C, Perri P, Ponzoni M, Pastorino U, Sozzi G, Fortunato O
Molecular oncology 2021 Nov;15(11):2969-2988
Molecular oncology 2021 Nov;15(11):2969-2988
Longitudinal single-cell profiling reveals molecular heterogeneity and tumor-immune evolution in refractory mantle cell lymphoma.
Zhang S, Jiang VC, Han G, Hao D, Lian J, Liu Y, Zhang R, McIntosh J, Wang R, Dang M, Dai E, Wang Y, Santos D, Badillo M, Leeming A, Chen Z, Hartig K, Bigcal J, Zhou J, Kanagal-Shamanna R, Ok CY, Lee H, Steiner RE, Zhang J, Song X, Nair R, Ahmed S, Rodriquez A, Thirumurthi S, Jain P, Wagner-Bartak N, Hill H, Nomie K, Flowers C, Futreal A, Wang L, Wang M
Nature communications 2021 May 17;12(1):2877
Nature communications 2021 May 17;12(1):2877
Senescent Tumor Cells Build a Cytokine Shield in Colorectal Cancer.
Choi YW, Kim YH, Oh SY, Suh KW, Kim YS, Lee GY, Yoon JE, Park SS, Lee YK, Park YJ, Kim HS, Park SH, Kim JH, Park TJ
Advanced science (Weinheim, Baden-Wurttemberg, Germany) 2021 Feb;8(4):2002497
Advanced science (Weinheim, Baden-Wurttemberg, Germany) 2021 Feb;8(4):2002497
Dominant extrafollicular B cell responses in severe COVID-19 disease correlate with robust viral-specific antibody production but poor clinical outcomes.
Woodruff M, Ramonell R, Cashman K, Nguyen D, Saini A, Haddad N, Ley A, Kyu S, Howell JC, Ozturk T, Lee S, Chen W, Estrada J, Morrison-Porter A, Derrico A, Anam F, Sharma M, Wu H, Le S, Jenks S, Tipton CM, Hu W, Lee FE, Sanz I
medRxiv : the preprint server for health sciences 2020 Jun 22;
medRxiv : the preprint server for health sciences 2020 Jun 22;
The CXCR4 antagonist plerixafor (AMD3100) promotes proliferation of Ewing sarcoma cell lines in vitro and activates receptor tyrosine kinase signaling.
Berning P, Schaefer C, Clemens D, Korsching E, Dirksen U, Potratz J
Cell communication and signaling : CCS 2018 May 18;16(1):21
Cell communication and signaling : CCS 2018 May 18;16(1):21
Modulatory effects of trophoblast-secreted CXCL12 on the migration and invasion of human first-trimester decidual epithelial cells are mediated by CXCR4 rather than CXCR7.
Zheng J, Wang H, Zhou W
Reproductive biology and endocrinology : RB&E 2018 Mar 2;16(1):17
Reproductive biology and endocrinology : RB&E 2018 Mar 2;16(1):17
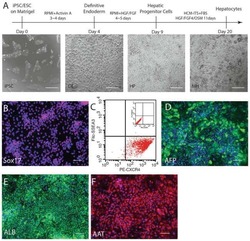
In Vitro Modeling of Alcohol-Induced Liver Injury Using Human-Induced Pluripotent Stem Cells.
Tian L, Prasad N, Jang YY
Methods in molecular biology (Clifton, N.J.) 2016;1353:271-83
Methods in molecular biology (Clifton, N.J.) 2016;1353:271-83
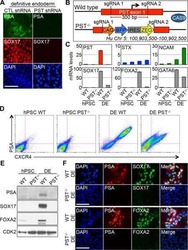
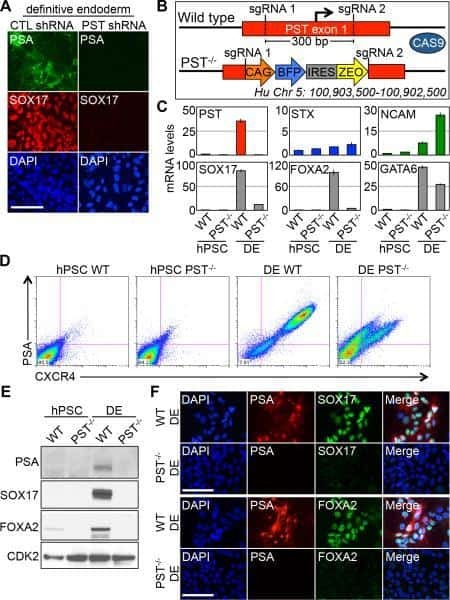
ST8SIA4-Dependent Polysialylation is Part of a Developmental Program Required for Germ Layer Formation from Human Pluripotent Stem Cells.
Berger RP, Sun YH, Kulik M, Lee JK, Nairn AV, Moremen KW, Pierce M, Dalton S
Stem cells (Dayton, Ohio) 2016 Jul;34(7):1742-52
Stem cells (Dayton, Ohio) 2016 Jul;34(7):1742-52
No comments: Submit comment
Supportive validation
- Submitted by
- Invitrogen Antibodies (provider)
- Main image

- Experimental details
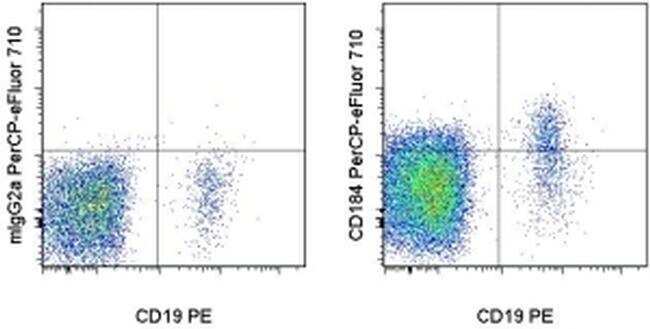
- Staining of normal human peripheral blood cells with Anti-Human CD19 PE (Product # 12-0199-80) and Mouse IgG2a K Isotype Control PerCP-eFluor® 710 (Product # 46-4724-82) (left) or Anti-Human CD184 (CXCR4) PerCP-eFluor® 710 (right). Cells in the lymphocyte gate were used for analysis.
Supportive validation
- Submitted by
- Invitrogen Antibodies (provider)
- Main image
- Experimental details
- NULL
- Submitted by
- Invitrogen Antibodies (provider)
- Main image
- Experimental details
- NULL
- Submitted by
- Invitrogen Antibodies (provider)
- Main image
- Experimental details
- NULL

- Submitted by
- Invitrogen Antibodies (provider)
- Main image
- Experimental details
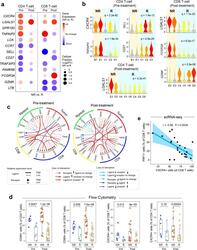
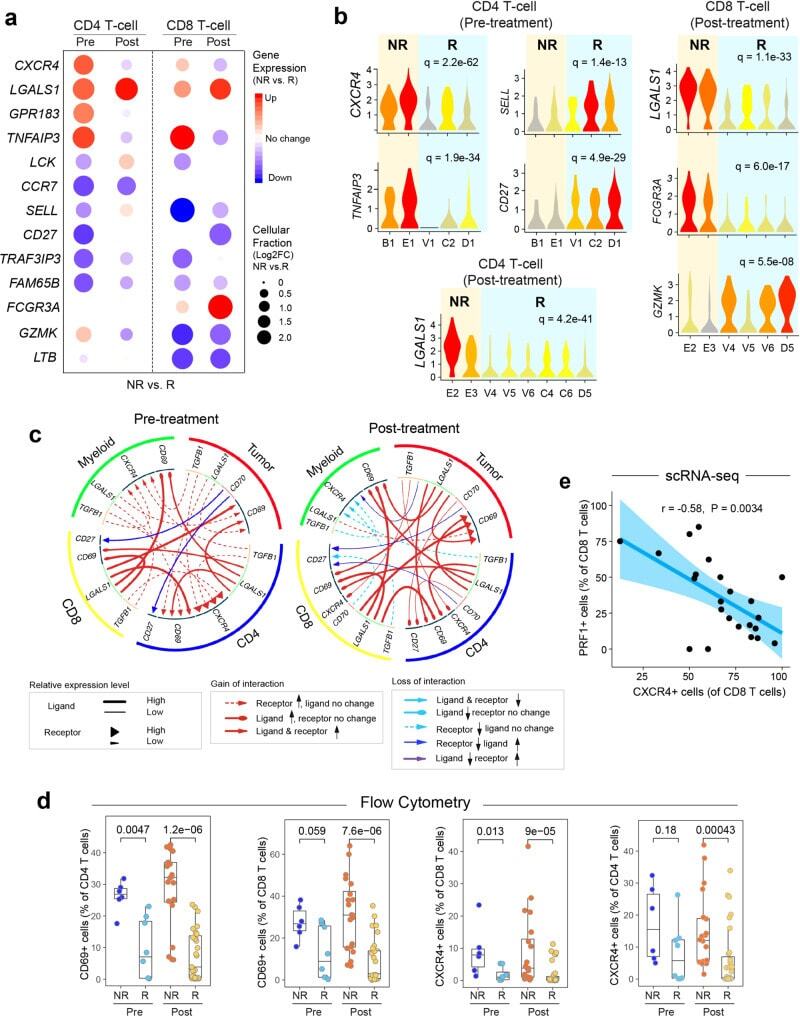
- Fig. 7 Aberrant cell-to-cell communication signaling associated with therapeutic resistance. a Differentially expressed genes (NR vs. R) in CD4+ and CD8+ T-cells pre- and post-ibrutinib treatment, respectively. Filled circle sizes are proportional to the Log2-scaled fold changes of each gene. Upregulated genes are shown in red; downregulated genes are shown in blue. Pre: pre-treatment; Post: post-treatment. b Representative genes are shown in violin plots. c Alterations (NR vs. R) of ligand-receptor-based cell-to-cell communication networks based in pre- and post-treatment samples. d Flow cytometry validation of upregulated CD69 and CXCR4 expression in ibrutinib nonresponders in comparison to the responders in additional patient cohorts ( n = 65 samples collected from 22 patients). The line in the box is the median value. The bottom and top of the box are the 25th and 75th percentiles of the sample. The bottom and top of the whiskers are the minimum and maximum values of the sample. p Values from the two-side Wilcoxon Signed-rank Test are shown. e Reverse correlation between the proportion of PRF1+ CD8 T cells (cytotoxic) and the expression of CXCR4 using scRNA-seq. The bounds of shape correspond to 95% confidence band for the regression line. The Pearson correlation coefficient ( r ) is shown. p Value corresponds to F test of linear regression model.
- Submitted by
- Invitrogen Antibodies (provider)
- Main image

- Experimental details
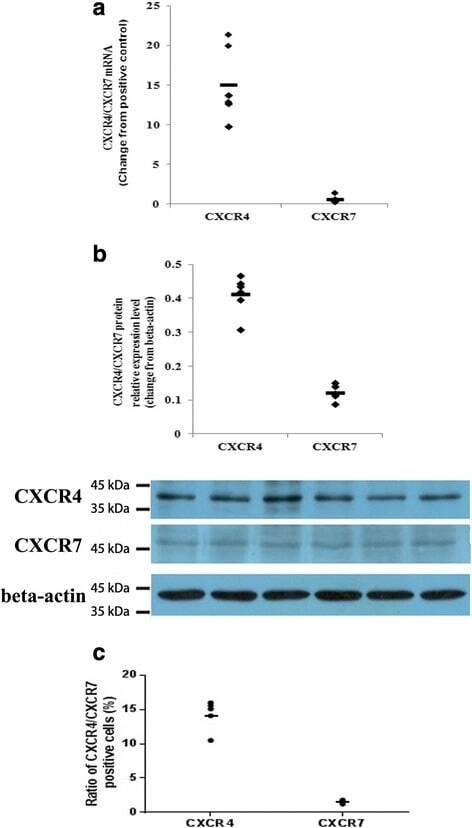
- Fig. 4 Expression levels of CXCR4 and CXCR7 in primary human first-trimester decidual epithelial cell cultures. Expression of the CXCR4 and CXCR7 mRNAs and proteins was detected in primary human first-trimester decidual epithelial cell (DEC) cultures. a The expression of the CXCR4 and CXCR7 genes in DECs was examined by real-time PCR. The level of the CXCR4 or CXCR7 gene was equal to the ratio of the absorbance of the target gene to the control. The transverse line represents the average CXCR4 and CXCR7 levels in DECs. ( n = 6). b The expression of CXCR4 and CXCR7 proteins in DECs was detected by western blotting. ( n = 6). c Flow cytometry results of the expression of CXCR4 and CXCR7 on the membranes human first-trimester DECs ( n = 5). The transverse line represents mean percentage of CXCR4 or CXCR7 positive cells
- Submitted by
- Invitrogen Antibodies (provider)
- Main image
- Experimental details
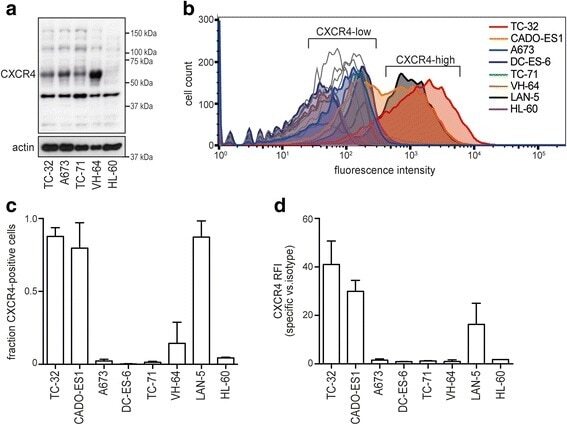
- Fig. 3 Ewing sarcoma cell lines group into CXCR4-high and -low surface expression. a Western blot analysis of total CXCR4 protein reveals multiple isoforms. Cells were grown to 70-80% confluence in standard conditions. Actin served as loading control. ( b )-( d ) CXCR4 surface expression distinguishes CXCR4-high and -low cell lines. Cells were grown as to 70-80% confluence in standard conditions and analyzed for CXCR4 surface expression by flow cytometry. LAN-5 neuroblastoma cells served as CXCR4-high positive control. b Representative flow cytometry plots; open graphs represent isotype-antibody controls. c CXCR4 positive cell populations depicted as mean +- SD of three independent analyses. d Relative fluorescence intensities of CXCR4 positive cell populations in ( c ). Corresponding data in serum-free conditions are provided in Additional file 1
- Submitted by
- Invitrogen Antibodies (provider)
- Main image

- Experimental details
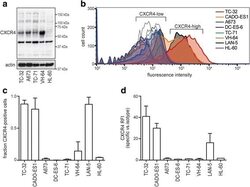
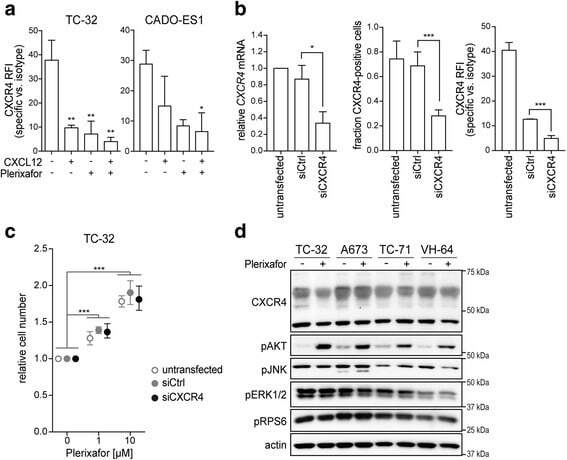
- Fig. 4 Plerixafor-induced proliferation does not require substantial CXCR4 surface expression but is associated with AKT activation. a CXCL12 and plerixafor bind to the CXCR4 receptor. TC-32 and CADO-ES1 cells were grown in standard conditions and treated with CXCL12 (100 ng/ml) and/or plerixafor (1 muM) for 12 h before flow cytometric analysis of CXCR4 signal with a 12G5-CXCR4 antibody. b Significant reduction in CXCR4 mRNA (left panel) and surface protein expression (middle and right panel). Cells were transfected with CXCR4-targeting siRNA (siCXCR4) or non-silencing control (siCtrl) and analyzed by real-time quantitative PCR and flow cytometry after 48 h. c Proliferative plerixafor effects are maintained despite significant reduction in CXCR4 surface expression. 48 h after siRNA transfection, cells from ( b ) were treated with plerixafor for another 72 h. Relative cell number was measured by WST-1 assay. All graphs of this figure represent means +- SD of three independent experiments. d AKT is activated in response to plerixafor in CXCR4-high and -low cell lines. Cells grown in standard conditions were treated with plerixafor (1 muM) for 12 h or remained untreated. Whole cell lysates were analyzed by Western blotting. Actin was loading control
- Submitted by
- Invitrogen Antibodies (provider)
- Main image
- Experimental details
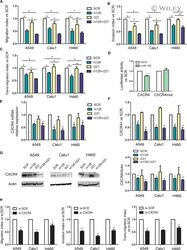
- 4 Fig. miR-126-3p replacement and miR-221 inhibition reduced lung dissemination by inhibiting CXCR4 levels. (A) Migration index after miR-126-3p and miR-221-3p modulation of three lung cancer cells ( n = 5). (B) Invasive capacity of lung cancer cells transfected with miR-126/221 ( n = 4). (C) Number of transmigrated lung cancer cells through endothelial monolayer after miRNA modulation ( n = 3). (D) Luciferase activity for 3'UTR of CXCR4 wild-type and mutated sequence after miR-126 and SCR transfection in A549 cells ( n = 4). CXCR4 levels after miR-126-3p replenishment and miR-221-3p inhibition evaluated by qPCR ( n = 3) (E) and flow cytometry ( n = 3) (F). (G) Representative images and quantification of CXCR4 in all the three cell lines after miRNA modulation ( n = 3). (H) Migration, invasion and transendothelial index of lung cancer cells transient transfected with CXCR4 siRNA and controls ( n = 3 for each cell line). Statistically significant differences were determined with Student's t -test when comparing two groups or ANOVA test for multiple comparisons. * P < 0.05 versus controls. Data are expressed as mean +- S.E.M.

- Submitted by
- Invitrogen Antibodies (provider)
- Main image
- Experimental details
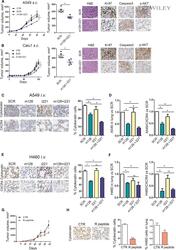
- 5 Fig. Combined replenishment of miR-126-3p and inhibition of miR-221-3p reduced xenograft growth in vivo . (A) A549 transfected with both miR-126-3p mimic (m126) and miR-221-3p inhibitor (i221) showed a reduction in tumour growth in immunodeficient mice compared with SCR and CTR controls. Ki-67, cleaved caspase 3 and phosphor-AKT quantification and representative images in A549 m126+i221 cells compared with controls. Necrosis was evaluated on haematoxylin & eosin (H&E) staining in subcutaneously implanted xenograft after miRNA transfection ( n = 5 for each group) Scale bar: 200 um (B) miR-126-3p replacement and miR-221-3p inhibition reduced tumour growth in subcutaneous Calu1 xenografts in immunodeficient mice. Ki-67, cleaved caspase 3 and phospho-AKT count and staining revealed a reduction in proliferation rate and increase in apoptosis of these cells. Necrosis was evaluated on H&E staining ( n = 5 for each group). Scale bar: 200 um. (C) Pan-cytokeratin and CXCR4 staining and quantification in the lungs of mice treated with A549 transfected miR-126 and/or miR-221 alone or in combination ( n = 4 for each group). Scale bar: 200 um. (D) Quantification of A549 and A549/CXCR4+ cells in the lungs of mice by flow cytometry ( n = 4). (E) Representative images and quantification of pan-cytokeratin and CXCR4 staining of the lungs from H460 transfected with miR-126-3p, miR-221 inhibitors alone or in combination and control ( n = 4 mice for each group). Scale bar: 200 um. (F) Flow cyto
- Submitted by
- Invitrogen Antibodies (provider)
- Main image
- Experimental details
- Figure 4 High concentrations of CXCL12 induce the loss of the plasma membrane CXCR4 in T cells. A) Schematic representation of CD8 + T cell migration in the presence of senescent tumor cells. B) CXCL12 chemogradient was developed using u-slide and then Jurkat T cell migration was analyzed. The migrated T cells were tracked, and the results are presented graphically ( n = 75, each). The red and black lines indicate the tracks of the chemoattracted and chemorepulsed cells, respectively. C) The CXCL12 chemogradient was developed by CXCL12 overexpressing SW480 cells in u-slide, and T cell migration was analyzed. The migrated T cells were tracked, and the result is presented as a line graph (left panel). The migration distances were measured, and the result is presented graphically (lower right panel). The p value was calculated by one-way ANOVA and post hoc analysis. D) Low and high concentrations of rhCXCL12 were treated with u-slide and lamellipodia formation was analyzed with SiR-actin staining. The arrow indicates lamellipodia. E and F) CXCR4 expression in isolated primary CD8 + T cells E) and Jurkat T cells F). Isolated primary CD8 + T or Jurkat cells were treated with 50 or 1000 ng mL -1 of rhCXCL12 for 30 min and analyzed for CD45 by immunocytochemistry and CXCR4 expression by immunocytochemistry, real-time PCR and western blot. G) Jurkat T cells were treated with rhCXCL12 (50 or 1000 ng mL -1 ) for 30 min and analyzed for CXCR4 expression in the plasma membrane by FACS. H

- Submitted by
- Invitrogen Antibodies (provider)
- Main image
- Experimental details
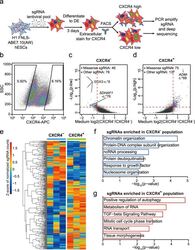
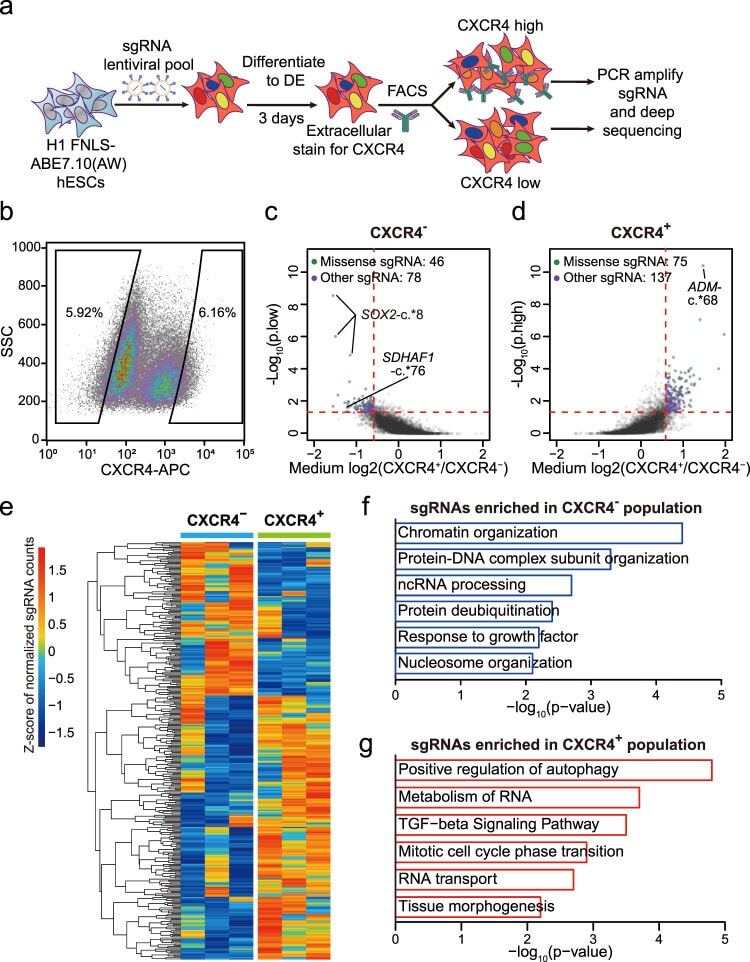
- Fig. 3 FNLS-ABE7.10(AW) base editor-based functional screening of m 6 A sites in H1 hESCs. a Flow chart of ABE-based screening of m 6 A sites is important for endoderm specification. b Representative CXCR4 FACS gating strategy for sorting CXCR4 - and CXCR4 + populations, respectively. SSC side scatter. c , d Scatter plot showing the strategy to determine the sgRNAs significantly enriched in CXCR4 - ( c ) and CXCR4 + ( d ) populations, respectively. e Heatmap showing the normalized counts of sgRNAs enriched in CXCR4 - or CXCR4 + populations for each replicate. f , g GO-enrichment analyses of the genes targeted by the sgRNAs significantly enriched in the CXCR4 - ( f ) or CXCR4 + ( g ) populations, respectively.
- Submitted by
- Invitrogen Antibodies (provider)
- Main image
- Experimental details
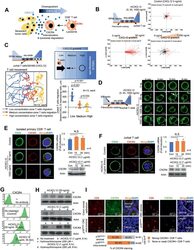
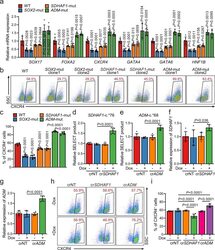
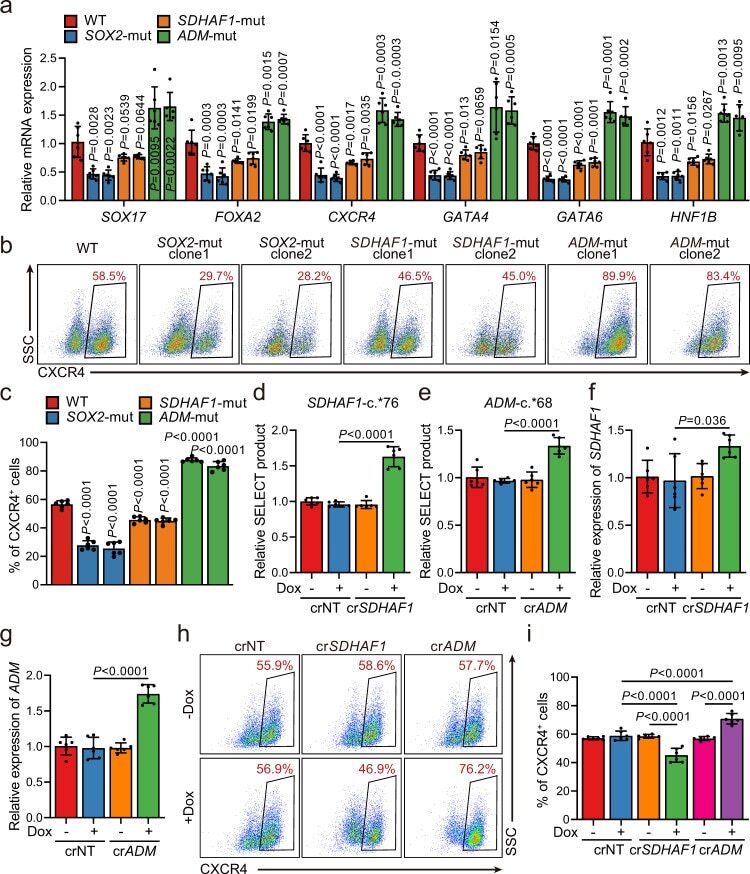
- Fig. 5 Selected m 6 A-disruptive mutations regulate human endodermal specification through m 6 A. a mRNA levels of DE marker genes SOX17 , FOXA2 , CXCR4 , GATA4 , GATA6 , and HNF1B in cultures derived from WT, SOX2 -mut, SDHAF1 -mut, and ADM -mut as well as WT hESCs at day 3 of DE differentiation ( n = 6 biologically independent samples). P -values were calculated vs. WT (two-tailed Student's t -test). b , c Representative ( b ) and quantitative ( c ) flow cytometry analyses of CXCR4 expression in cultures derived from WT, SOX2 -mut, SDHAF1 -mut, and ADM -mut hESCs at day 3 of DE differentiation ( n = 6 biologically independent samples). P -values were calculated vs. WT (one-way ANOVA with Tukey's post hoc test). d , e Measurement of m 6 A levels of SDHAF1 -c. *76 ( d ) and ADM -c. *68 ( e ) after TRME editor induced site-specific m 6 A demethylation by SELECT assay ( n = 6 biologically independent samples). NT non-targeting, Dox doxycycline (one-way ANOVA with Tukey's post hoc test). f , g mRNA expression levels of SDHAF1 ( f ) and ADM ( g ) on day 2 of DE differentiation after TRME editor induced site-specific m 6 A demethylation ( n = 6 biologically independent samples). NT non-targeting, Dox doxycycline (one-way ANOVA with Tukey's post hoc test). h , i Representative ( h ) and quantitative ( i ) flow cytometry analyses of CXCR4 expression in cultures derived from hESCs with or without induced site-specific m 6 A demethylation by TRME editor at day 3 of DE differentiation
- Submitted by
- Invitrogen Antibodies (provider)
- Main image
- Experimental details
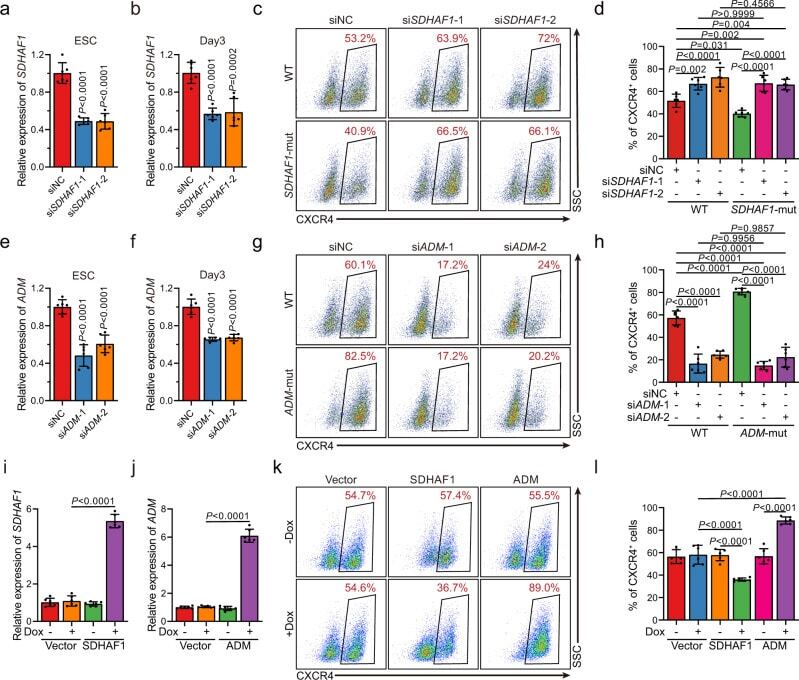
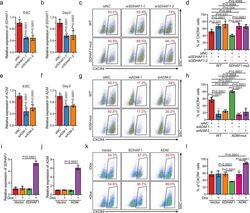
- Fig. 6 The mRNAs of SDHAF1 and ADM mediate the effects of their targeting sgRNAs on DE specification. a , b siRNA knockdown efficiency of SDHAF1 in hESCs ( a ) and at day 3 of DE differentiation ( b ), respectively ( n = 6 biologically independent samples), measured by RT-qPCR. si siRNA, NC non-targeting control. P -values were calculated vs. siNC (one-way ANOVA with Tukey's post hoc test). c , d Representative ( c ) and quantitative ( d ) flow cytometry analyses of CXCR4 expression in cultures derived from WT or SDHAF1- mut hESCs that with NC or SDHAF1 -targeting siRNAs at day 3 of DE differentiation ( n = 6 biologically independent samples). ns non-significant (one-way ANOVA with Tukey's post hoc test). e , f siRNA knockdown efficiency of ADM in hESCs ( e ) and at day 3 of DE differentiation ( f ) respectively ( n = 6 biologically independent samples), measured by RT-qPCR. si siRNA, NC non-targeting control. P -values were calculated vs. siNC (one-way ANOVA with Tukey's post hoc test). g , h Representative ( g ) and quantitative ( h ) flow cytometry analyses of CXCR4 expression in cultures derived from WT or ADM -mut hESCs that with NC or ADM -targeting siRNAs at day 3 of DE differentiation ( n = 6 biologically independent samples). ns non-significant (one-way ANOVA with Tukey's post hoc test). i , j mRNA levels of SDHAF1 ( i ) and ADM ( j ) in overexpressed hESCs ( n = 6 biologically independent samples), measured by RT-qPCR. Dox, doxycycline (one-way ANOVA with Tukey's po