Explore
 Validate
 Learn
Learn Western blot
 Immunocytochemistry
Antibody data
- Antibody Data
- Antigen structure
- References [1]
- Comments [0]
- Validations
- Immunocytochemistry [2]
- Immunohistochemistry [1]
- Other assay [1]
Submit
Validation data
Reference
Comment
Report error
- Product number
- PA5-13181 - Provider product page

- Provider
- Invitrogen Antibodies
- Product name
- MMP12 Polyclonal Antibody
- Antibody type
- Polyclonal
- Antigen
- Synthetic peptide
- Reactivity
- Human, Mouse
- Host
- Rabbit
- Isotype
- IgG
- Vial size
- 400 μL
- Concentration
- 0.5 mg/mL
- Storage
- Store at 4°C short term. For long term storage, store at -20°C, avoiding freeze/thaw cycles.
Submitted references PPARγ activation improves the microenvironment of perivascular adipose tissue and attenuates aortic stiffening in obesity.
Chen JY, Wu YP, Li CY, Jheng HF, Kao LZ, Yang CC, Leu SY, Lien IC, Weng WT, Tai HC, Chiou YW, Tang MJ, Tsai PJ, Tsai YS
Journal of biomedical science 2021 Mar 29;28(1):22
Journal of biomedical science 2021 Mar 29;28(1):22
No comments: Submit comment
Supportive validation
- Submitted by
- Invitrogen Antibodies (provider)
- Main image
- Experimental details
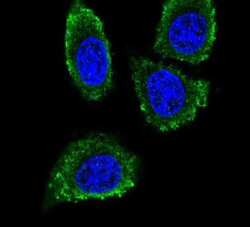
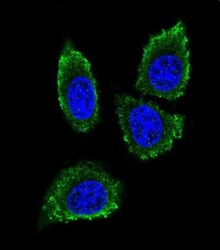
- Immunofluorescent analysis of 293 cells using a MMP12 polyclonal antibody (Product # PA5-13181) at a dilution of 1:10-50, followed by a fluor-conjugated goat anti-rabbit secondary antibody (green). Nuclei were stained with DAPI (blue).
- Submitted by
- Invitrogen Antibodies (provider)
- Main image
- Experimental details
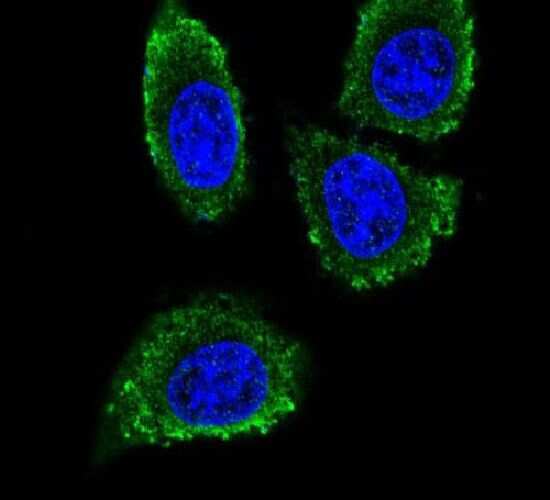
- Immunocytochemistry analysis of MMP12 in 293 cells. Samples were incubated in MMP12 polyclonal antibody (Product # PA5-13181) followed by Alexa Fluor® 488-conjugated goat anti-rabbit lgG (green). DAPI was used to stain the cell nuclear (blue).

Supportive validation
- Submitted by
- Invitrogen Antibodies (provider)
- Main image

- Experimental details
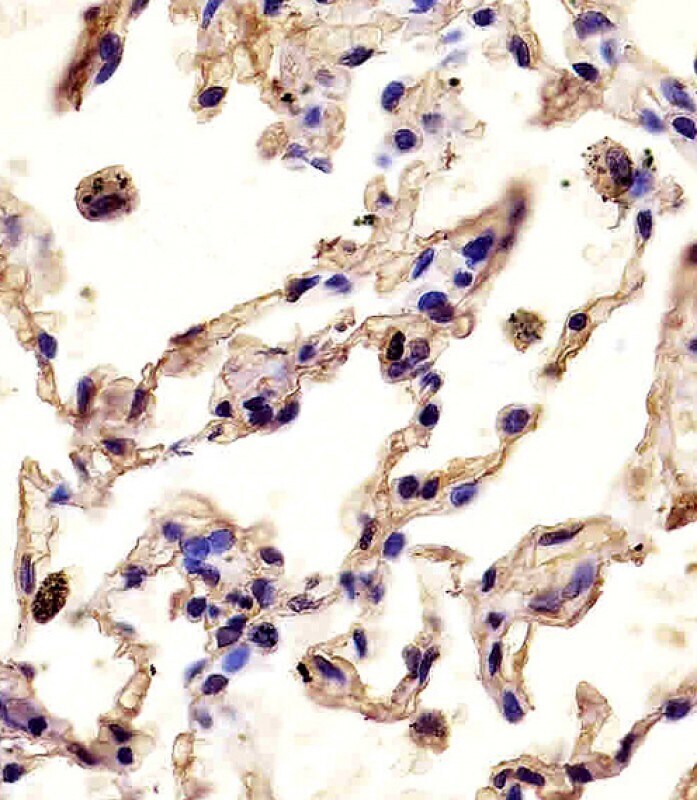
- Immunohistochemistry analysis of MMP12 in paraformaldehyde-fixed, paraffin-embedded human lung tissue sections. Samples were incubated with MMP12 polyclonal antibody (Product # PA5-13181) using a dilution of 1:25 for 1 hours at 37°C followed by an undiluted biotinylated goat polyvalent antibody. Tissue was fixed with formaldehyde and blocked with 3% BSA for 0.5 hour at room temperature; antigen retrieval was by heat mediation with a citrate buffer (pH 6).
Supportive validation
- Submitted by
- Invitrogen Antibodies (provider)
- Main image
- Experimental details
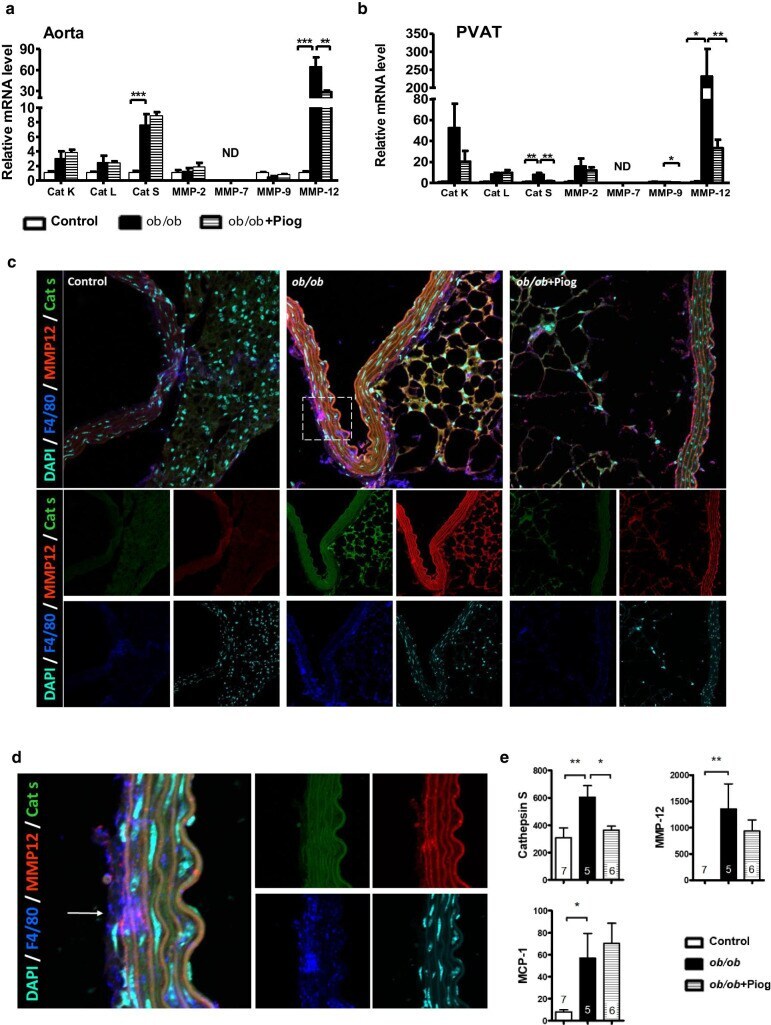
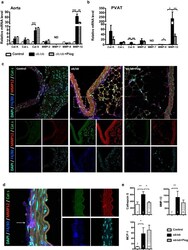
- Fig. 4 Expression and location of elastolytic enzymes in the aorta and PVAT. Expression of genes for cathepsins and MMPs in the a aorta ( n = 7, 5, and 6 for control, ob/ob , and ob/ob + Piog groups respectively) and b PVAT ( n = 3, 5, and 6 for control, ob/ob , ob/ob + Piog groups respectively). mRNA amount is expressed relative to the average expression in control mice. * P < 0.05, ** P < 0.01, and *** P < 0.001. ND, not detectable. c Immunofluorescence staining for CTSS (green), MMP-12 (red) and F4/80 (blue) in the thoracic aorta and PVAT. The DAPI nuclear counterstain appears light blue. Magnification of the square in ( c ) is shown in ( d ). The while arrow indicates the location of elastic fiber break with increased signals of MMP-12 and F4/80. e Plasma levels of CTSS, MMP-12, and MCP-1 by ELISA (n = 7, 5, and 6 for control, ob/ob , and ob/ob + Piog groups respectively). All data are resulted from 3-month-old male mice. Original magnification x 400 for ( c ) and x 1200 for ( d )