Explore
 Validate
 Learn
Learn Flow cytometry
Antibody data
- Antibody Data
- Antigen structure
- References [11]
- Comments [0]
- Validations
- Flow cytometry [1]
- Other assay [7]
Submit
Validation data
Reference
Comment
Report error
- Product number
- 17-9033-42 - Provider product page

- Provider
- Invitrogen Antibodies
- Product name
- Phospho-STAT3 (Tyr705) Monoclonal Antibody (LUVNKLA), APC, eBioscience™
- Antibody type
- Monoclonal
- Antigen
- Other
- Description
- Description: This LUVNKLA monoclonal antibody recognizes human and mouse signal transducer and activator of transcription 3 (STAT3) when phosphorylated on tyrosine 705 (Y705). The STAT family represents seven transcription factors (STATs 1, 2, 3, 4, 5A, 5B, and 6) that are involved in many cellular processes including apoptosis, cell differentiation, and proliferation in a cell type- and cytokine-specific manner. STAT proteins are activated by ligand binding to cytokine receptors that associate with Janus kinase (JAK) family members. Following their phosphorylation by JAKs, STAT proteins translocate to the nucleus where they bind to DNA and regulate transcription of specific genes in a cell type- and cytokine-specific manner. STAT3 is activated downstream of numerous cytokines including interferons, IL-5, IL-6, IL-10, and LIF. STAT3 is important for the differentiation of Th17 cells and mediates a variety of cellular processes including cell growth and survival. The importance of STAT3 is highlighted by both loss-of-function and gain-of-function mutations. Deletion of STAT3 in T cells results in decreased IL-6- and IL-2-mediated proliferation, while deletion of STAT3 in neutrophils and macrophages results in increased susceptibility to LPS-induced endotoxic shock and increased production of the pro-inflammatory cytokines IL-6 and TNF alpha. Hyper STAT3 activity is associated with poor prognosis of many different cancers. Applications Reported: This LUVNKLA antibody has been reported for use in intracellular staining followed by flow cytometric analysis. Applications Tested: This LUVNKLA antibody has been pre-titrated and tested by intracellular staining followed by flow cytometric analysis of stimulated normal human peripheral blood cells. This can be used at 5 µL (0.25 µg) per test. A test is defined as the amount (µg) of antibody that will stain a cell sample in a final volume of 100 µL. Cell number should be determined empirically but can range from 10^5 to 10^8 cells/test. Staining Protocol: We recommend using Protocol C: Two-step protocol: Fixation/Methanol. Protocol A: Two-step protocol: intracellular (cytoplasmic) proteins and Protocol B: One-step protocol: intracellular (nuclear) proteins cannot be used. All Protocols can be found in the Flow Cytometry Protocols: "Staining Intracellular Antigens for Flow Cytometry Protocol" located in the Best Protocols Section under the Resources tab online. Excitation: 633-647 nm; Emission: 660 nm; Laser: Red Laser. Filtration: 0.2 µm post-manufacturing filtered.
- Reactivity
- Human, Mouse
- Host
- Mouse
- Isotype
- IgG
- Antibody clone number
- LUVNKLA
- Vial size
- 100 Tests
- Concentration
- 5 µL/Test
- Storage
- 4° C, store in dark, DO NOT FREEZE!
Submitted references JAK1 signaling in dendritic cells promotes peripheral tolerance in autoimmunity through PD-L1-mediated regulatory T cell induction.
Combinatorial immunotherapy of N-803 (IL-15 superagonist) and dinutuximab with ex vivo expanded natural killer cells significantly enhances in vitro cytotoxicity against GD2(+) pediatric solid tumors and in vivo survival of xenografted immunodeficient NSG mice.
ILC3 deficiency and generalized ILC abnormalities in DOCK8-deficient patients.
Mapping of Signaling Pathways Linked to sIgAD Reveals Impaired IL-21 Driven STAT3 B-Cell Activation.
STING signaling remodels the tumor microenvironment by antagonizing myeloid-derived suppressor cell expansion.
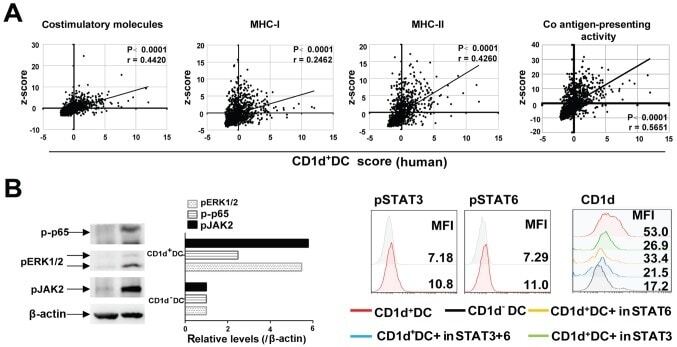
CD1d highly expressed on DCs reduces lung tumor burden by enhancing antitumor immunity.
ATF3 Sustains IL-22-Induced STAT3 Phosphorylation to Maintain Mucosal Immunity Through Inhibiting Phosphatases.
Receptor-mediated dimerization of JAK2 FERM domains is required for JAK2 activation.
STAT3: A Novel Molecular Mediator of Resistance to Chemoradiotherapy.
Loss of STAT3 in CD4+ T cells prevents development of experimental autoimmune diseases.
Critical role for Stat3 in T-dependent terminal differentiation of IgG B cells.
Vogel A, Martin K, Soukup K, Halfmann A, Kerndl M, Brunner JS, Hofmann M, Oberbichler L, Korosec A, Kuttke M, Datler H, Kieler M, Musiejovsky L, Dohnal A, Sharif O, Schabbauer G
Cell reports 2022 Feb 22;38(8):110420
Cell reports 2022 Feb 22;38(8):110420
Combinatorial immunotherapy of N-803 (IL-15 superagonist) and dinutuximab with ex vivo expanded natural killer cells significantly enhances in vitro cytotoxicity against GD2(+) pediatric solid tumors and in vivo survival of xenografted immunodeficient NSG mice.
Chu Y, Nayyar G, Jiang S, Rosenblum JM, Soon-Shiong P, Safrit JT, Lee DA, Cairo MS
Journal for immunotherapy of cancer 2021 Jul;9(7)
Journal for immunotherapy of cancer 2021 Jul;9(7)
ILC3 deficiency and generalized ILC abnormalities in DOCK8-deficient patients.
Eken A, Cansever M, Okus FZ, Erdem S, Nain E, Azizoglu ZB, Haliloglu Y, Karakukcu M, Ozcan A, Devecioglu O, Aksu G, Arikan Ayyildiz Z, Topal E, Karakoc Aydiner E, Kiykim A, Metin A, Cipe F, Kaya A, Artac H, Reisli I, Guner SN, Uygun V, Karasu G, Dönmez Altuntas H, Canatan H, Oukka M, Ozen A, Chatila TA, Keles S, Baris S, Unal E, Patiroglu T
Allergy 2020 Apr;75(4):921-932
Allergy 2020 Apr;75(4):921-932
Mapping of Signaling Pathways Linked to sIgAD Reveals Impaired IL-21 Driven STAT3 B-Cell Activation.
Lemarquis AL, Theodors F, Einarsdottir HK, Ludviksson BR
Frontiers in immunology 2019;10:403
Frontiers in immunology 2019;10:403
STING signaling remodels the tumor microenvironment by antagonizing myeloid-derived suppressor cell expansion.
Zhang CX, Ye SB, Ni JJ, Cai TT, Liu YN, Huang DJ, Mai HQ, Chen QY, He J, Zhang XS, Zeng YX, Li J, Cui J
Cell death and differentiation 2019 Nov;26(11):2314-2328
Cell death and differentiation 2019 Nov;26(11):2314-2328
CD1d highly expressed on DCs reduces lung tumor burden by enhancing antitumor immunity.
Li Y, Zhao C, Liu J, Lu Z, Lu M, Gu J, Liu R
Oncology reports 2019 May;41(5):2679-2688
Oncology reports 2019 May;41(5):2679-2688
ATF3 Sustains IL-22-Induced STAT3 Phosphorylation to Maintain Mucosal Immunity Through Inhibiting Phosphatases.
Glal D, Sudhakar JN, Lu HH, Liu MC, Chiang HY, Liu YC, Cheng CF, Shui JW
Frontiers in immunology 2018;9:2522
Frontiers in immunology 2018;9:2522
Receptor-mediated dimerization of JAK2 FERM domains is required for JAK2 activation.
Ferrao RD, Wallweber HJ, Lupardus PJ
eLife 2018 Jul 25;7
eLife 2018 Jul 25;7
STAT3: A Novel Molecular Mediator of Resistance to Chemoradiotherapy.
Spitzner M, Ebner R, Wolff HA, Ghadimi BM, Wienands J, Grade M
Cancers 2014 Sep 29;6(4):1986-2011
Cancers 2014 Sep 29;6(4):1986-2011
Loss of STAT3 in CD4+ T cells prevents development of experimental autoimmune diseases.
Liu X, Lee YS, Yu CR, Egwuagu CE
Journal of immunology (Baltimore, Md. : 1950) 2008 May 1;180(9):6070-6
Journal of immunology (Baltimore, Md. : 1950) 2008 May 1;180(9):6070-6
Critical role for Stat3 in T-dependent terminal differentiation of IgG B cells.
Fornek JL, Tygrett LT, Waldschmidt TJ, Poli V, Rickert RC, Kansas GS
Blood 2006 Feb 1;107(3):1085-91
Blood 2006 Feb 1;107(3):1085-91
No comments: Submit comment
Supportive validation
- Submitted by
- Invitrogen Antibodies (provider)
- Main image

- Experimental details
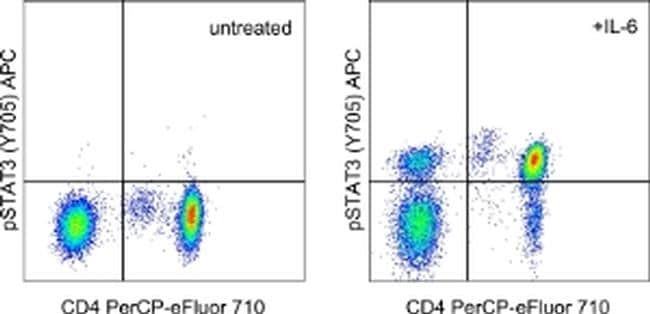
- Intracellular staining of untreated (left) or 15-minute IL-6-treated (right) normal human peripheral blood cells with Anti-Human CD4 PerCP-eFluor® 710 (Product # 46-0047-42) and Anti-Human/Mouse phospho-STAT3 (Y705) APC. Cells in the lymphocyte gate were used for analysis. Cells were stained using the Intracellular Fixation/Methanol protocol.
Supportive validation
- Submitted by
- Invitrogen Antibodies (provider)
- Main image

- Experimental details
- NULL

- Submitted by
- Invitrogen Antibodies (provider)
- Main image

- Experimental details
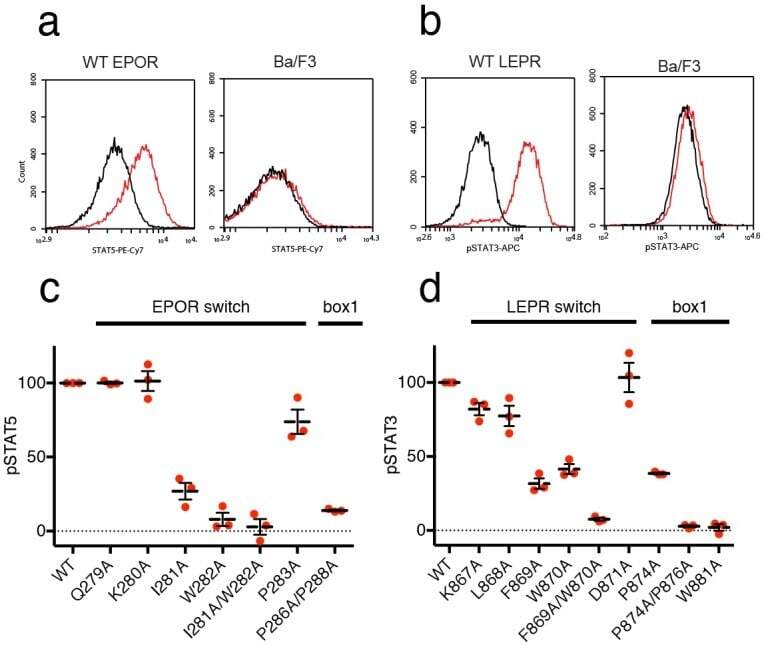
- Figure 5. EPOR and LEPR switch residues are required for Epo and Leptin-induced STAT phosphorylation. ( a,b ) Stable Ba/F3 cell lines expressing wild-type, full length mouse EPOR or LEPR were generated and analyzed for STAT phosphorylation by flow cytometry after stimulation with EPO or leptin. ( a ) Representative plots comparing phospho-STAT5 staining of parental Ba/F3 cells or Ba/F3 cells expressing EPOR. Cells were stimulated with 1 nM mouse EPO for 15 min before fixation, staining, and analysis. ( b ) Representative plots comparing phospho-STAT3 staining of parental Ba/F3 cells or Ba/F3 cells expressing LEPR. Cells were stimulated with 100 pM mouse Leptin for 4 hr prior to fixation, staining, and analysis. ( c ) Analysis of STAT5 phosphorylation by flow cytometry for EPOR wild-type, switch region, and box1 mutants, stimulated with 1 nM EPO as in ( a ). Mean levels of STAT5 phosphorylation were assessed in three separate experiments, with wild-type signal representing 100% in all three experiments. ( d ) Analysis of STAT3 phosphorylation by flow cytometry for LEPR wild-type, switch region, and box1 mutants, stimulated with 100 pM Leptin, as in ( b ). Mean levels of STAT3 phosphorylation was assessed in three separate experiments, with wild-type signal representing 100% in all three experiments. Error bars represent standard error of the mean (SEM). Figure 5--figure supplement 1. Analysis of Ba/F3 stable cell lines expressing EPOR or LEPR mutants. ( a ) Alignment of human
- Submitted by
- Invitrogen Antibodies (provider)
- Main image

- Experimental details
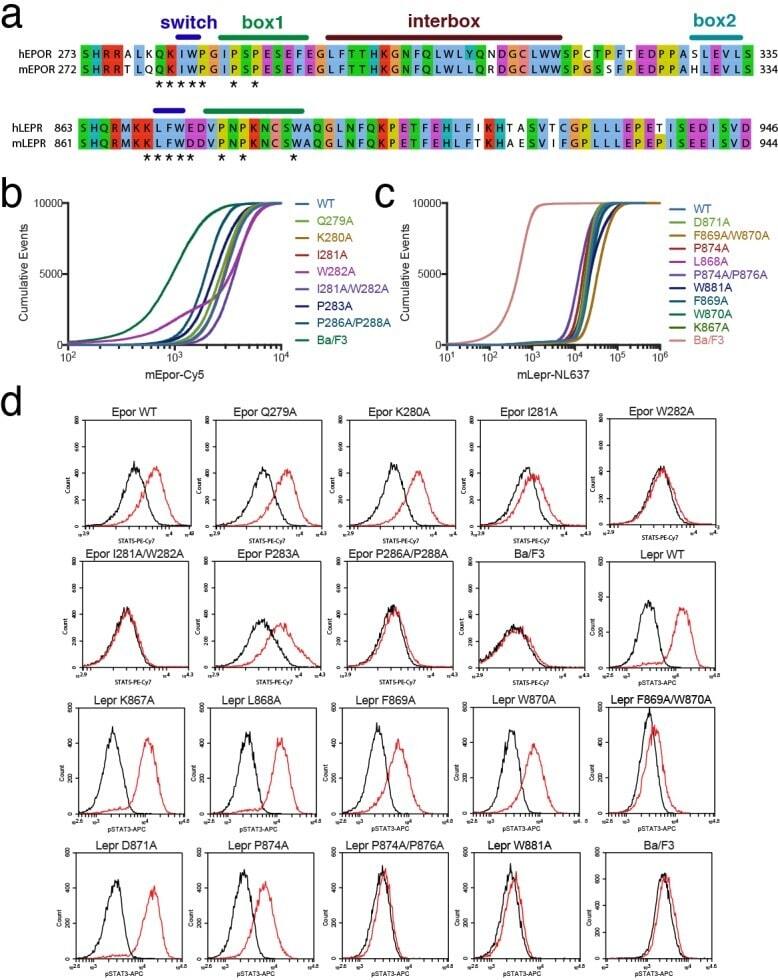
- Figure 5--figure supplement 1. Analysis of Ba/F3 stable cell lines expressing EPOR or LEPR mutants. ( a ) Alignment of human and mouse sequences for EPOR and LEPR. Note the numbering differences for mouse versus human (minus one residue for EPOR and minus two residues for LEPR). Residues in the switch region and box1, which are mutated in our experiments, are completely conserved between human and mouse. ( b-c ) Receptor surface staining for stable cell lines expressing ( b ) EPOR variants and ( c ) LEPR variants. Plots represent cumulative events (Y axis) at or below a given staining level (X axis). ( d ) Representative raw flow cytometry histograms showing the phospho-STAT5 (EPOR) or phospho-STAT3 (LEPR) staining in unstimulated cells (black trace) or cells stimulated with cytokine (red trace) as described in Materials and methods.
- Submitted by
- Invitrogen Antibodies (provider)
- Main image
- Experimental details
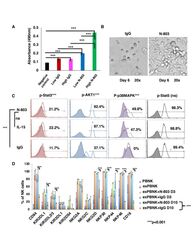
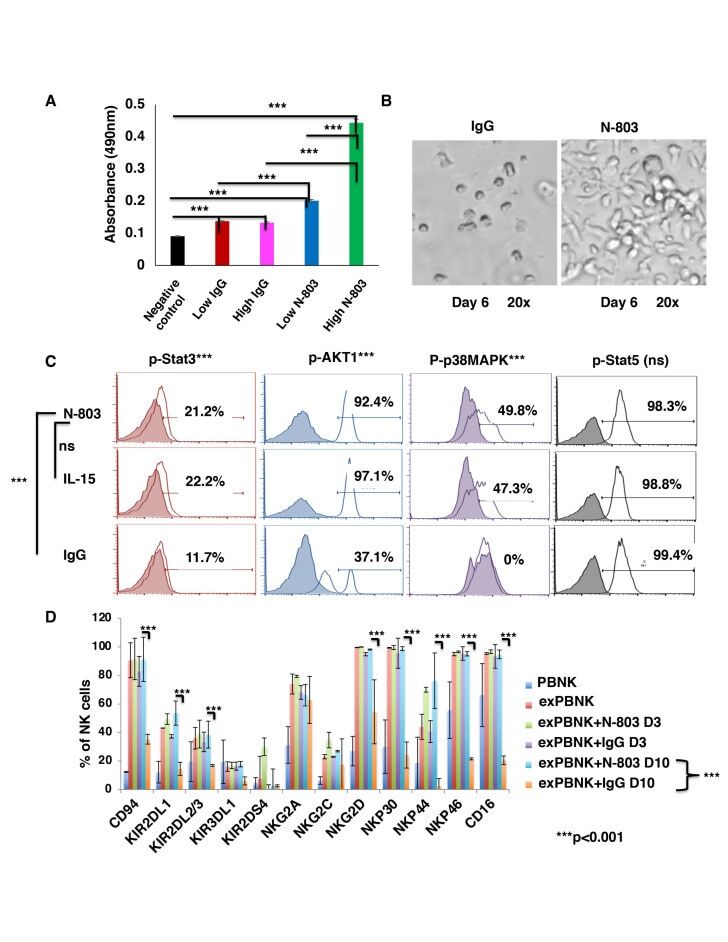
- Figure 1 N-803 increased the viability and proliferation of exPBNK with enhanced p-Stat3, p-Stat5, pAKT, p-p38MAPK and NK activating receptors. PBMNCs were stimulated with irradiated genetically modified K562-mbIL21-41BBL cells for 2-3 weeks. (A) Purified exPBNK cells were cultured in complete medium with 0.35 ng/mL (low) or 3.5 ng/mL (high) N-803 or molar equivalent dose of IgG for 3 days. NK viability and proliferation were monitored by MTS assays. The amount of 490 nm absorbance is directly proportional to the number of living exPBNK cells in the culture. The exPBNK cells with N-803 at 0.35 ng/mL or 3.5 ng/mL have significantly higher viability as compared with IgG or medium controls (p
- Submitted by
- Invitrogen Antibodies (provider)
- Main image
- Experimental details
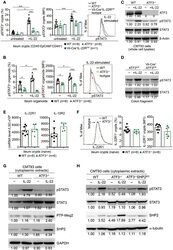
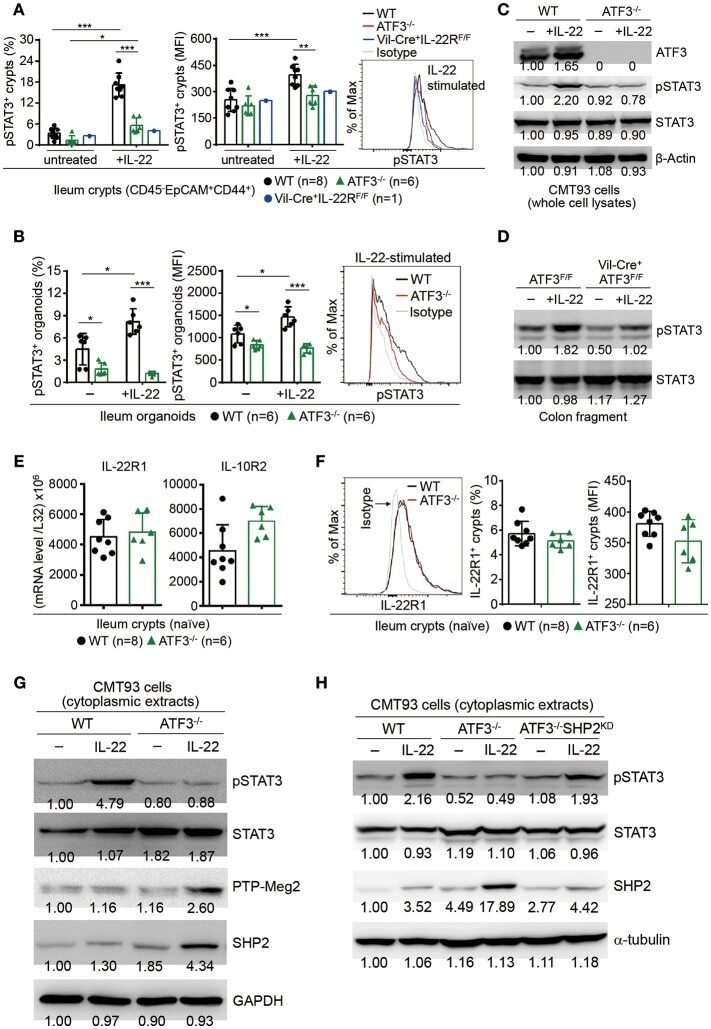
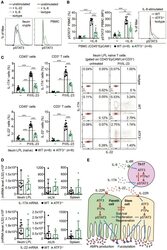
- Figure 7 ATF3 promotes IL-22-induced STAT3 phosphorylation by suppressing phosphatases. (A) Freshly isolated ileum crypts, or (B) ileum organoids at day 6 of culture, were stimulated with IL-22, followed by fixation and intracellular staining of phospho-STAT3, and analyzed by flow cytometry. Western blot analysis of (C) IL-22-stimulated CMT93 cells, or (D) IL-22-stimuated colon fragments isolated from the indicated mice, for the expression of the indicated proteins. (E) Quantitative real-time PCR analysis of IL-22R1 and IL-10R2 mRNA levels in freshly isolated ileum crypts from mice. (F) Flow cytometry analysis of IL-22R1 in freshly isolated ileum crypt cells gated on the CD45 - EpCAM + population. (G,H) Western blot analysis of unstimulated or IL-22-stimulated CMT93 cells for the indicated proteins. ATF3 -/- CMT93 cells with SHP2 knockdown (ATF3 -/- SHP2 KD ) were indicated. Images were representative of four independent experiments (G-H) . Results were from two independent experiments (A-F) . ""n"" refers to the number of mice analyzed (A,B,E,F) . Statistical analysis was done by multiple comparison in Two-way ANOVA test using Prism software. * P < 0.05, ** P < 0.005, *** P < 0.0005.
- Submitted by
- Invitrogen Antibodies (provider)
- Main image
- Experimental details
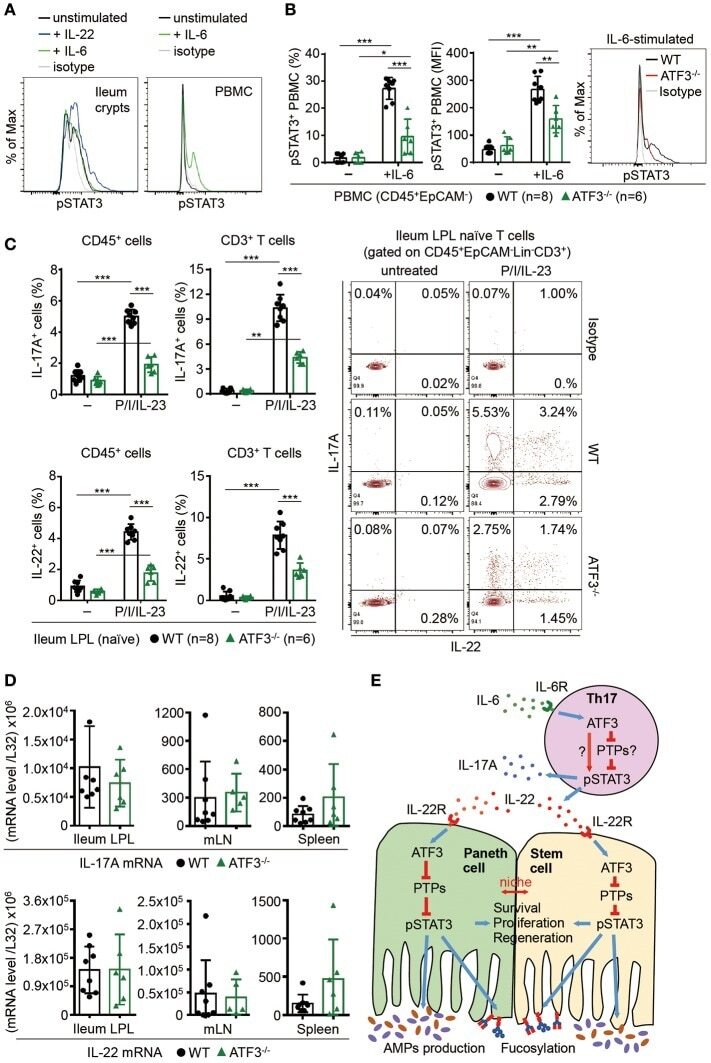
- Figure 8 ATF3 regulates IL-6-pSTAT3 signaling in intestinal Th17 cells. Flow cytometry analysis of phospho-STAT3 in (A) IL-6 or IL-22 stimulated freshly isolated ileum crypts or IL-6-stimulated peripheral blood mononuclear cell (PBMC) from wild-type mice, or in (B) IL-6-stimulated PBMC from wild-type and ATF3-deficient mice. (C) Flow cytometry analysis of intracellular IL-17A and IL-22 expression in naive lamina propria T cells from the indicated mice. Cells were treated with PMA, ionomycin and IL-23 in the presence of BFA for 4 h before analysis and gated on live CD45 + EpCAM - Lin - CD3 + population as shown. (D) Quantitative real-time PCR analysis of IL-17A and IL-22 mRNA levels in freshly isolated lamina propria (LPL) cells, mesenteric lymph nodes (mLN), or splenocytes. (E) Model of ATF3-mediated mucosal immunity via cross-regulation between IL-22-pSTAT3 signaling in epithelium (associated with AMP production and epithelial fucosylation) and IL-6-pSTAT3 signaling in Th17 cells (associated with signature IL-17A and IL-22 production). ""n"" refers to the number of mice analyzed. Statistical analysis was done by multiple comparison in Two-way ANOVA test using Prism software. * P < 0.05, ** P < 0.005, *** P < 0.0005.
- Submitted by
- Invitrogen Antibodies (provider)
- Main image

- Experimental details
- Figure 5. (A) The correlation analysis between CD1d + DC cell score and Co antigen-presenting activity score. The costimulatory molecule scores were calculated by combining the expression levels of CD40, CD80 and CD86; the MHC-I score was calculated by combining the expression levels of HLA-A/B/C; and the MHC-II score was calculated by combining the expression levels of HLA-DMA/DOA/DQA1/DRA. The co antigen-presenting activity score was calculated by combining the expression levels of CD40, CD80, CD86 and MHC-I/II. Pearsons correlation coefficient was performed. (B) Protein levels of pp65, pERK1/2 and pJAK2 in CD1d + DC cells and CD1d - DC cells were detected via western blot analysis. FACS analysis of pSTAT6 and pSTAT3 in CD1d + DC cells and CD1d - DC cells. CD1d + DC cells were treated with inhibitors of pSTAT3 (10 nM) and pSTAT6 (10 nM), and then expression levels of CD1d were detected by FACS. DC, dendritic cells; MFI, median fluorescence intensity; FACS, fluorescence-activated cell sorter.