Explore
 Validate
 Learn
Learn Flow cytometry
Antibody data
- Antibody Data
- Antigen structure
- References [3]
- Comments [0]
- Validations
- Flow cytometry [1]
- Other assay [4]
Submit
Validation data
Reference
Comment
Report error
- Product number
- 46-9013-42 - Provider product page

- Provider
- Invitrogen Antibodies
- Product name
- Phospho-STAT6 (Tyr641) Monoclonal Antibody (CHI2S4N), PerCP-eFluor™ 710, eBioscience™
- Antibody type
- Monoclonal
- Antigen
- Other
- Description
- Description: This CHI2S4N monoclonal antibody recognizes human and mouse signal transducer and activator of transcription 6 (STAT6) when phosphorylated on tyrosine 641. Following their phosphorylation by JAKs, STAT proteins translocate to the nucleus where they bind to DNA and regulate transcription of specific genes in a cell type- and cytokine-specific manner. In response to IL-4, STAT6 is phosphorylated on tyrosine 641 by JAK1 and JAK3. STAT6 signaling downstream of the IL-4 receptor promotes T cell growth and B cell production of IgE. Specificity of this CHI2S4N clone was determined by ELISA and flow cytometry. Applications Reported: This CHI2S4N antibody has been reported for use in intracellular staining followed by flow cytometric analysis. Applications Tested: This CHI2S4N antibody has been pre-titrated and tested by intracellular staining followed by flow cytometric analysis of stimulated normal human peripheral blood cells. This can be used at 5 µL (0.03 µg) per test. A test is defined as the amount (µg) of antibody that will stain a cell sample in a final volume of 100 µL. Cell number should be determined empirically but can range from 10^5 to 10^8 cells/test. Staining Protocol: We recommend using Protocol C: Two-step protocol: Fixation/Methanol. Protocol A: Two-step protocol: intracellular (cytoplasmic) proteins and Protocol B: One-step protocol: intracellular (nuclear) proteins cannot be used. All Protocols can be found in the Flow Cytometry Protocols: "Staining Intracellular Antigens for Flow Cytometry Protocol" located in the Best Protocols Section under the Resources tab online. PerCP-eFluor® 710 emits at 710 nm and is excited with the blue laser (488 nm); it can be used in place of PerCP-Cyanine5.5. We recommend using a 710/50 bandpass filter, however, the 695/40 bandpass filter is an acceptable alternative. Please make sure that your instrument is capable of detecting this fluorochrome. Light sensitivity: This tandem dye is sensitive to photo-induced oxidation. Please protect this vial and stained samples from light. Fixation: Samples can be stored in IC Fixation Buffer (Product # 00-8222) (100 µL of cell sample + 100 µL of IC Fixation Buffer) or 1-step Fix/Lyse Solution (Product # 00-5333) for up to 3 days in the dark at 4°C with minimal impact on brightness and FRET efficiency/compensation. Some generalizations regarding fluorophore performance after fixation can be made, but clone specific performance should be determined empirically. Excitation: 488 nm; Emission: 710 nm; Laser: Blue Laser. Filtration: 0.2 µm post-manufacturing filtered.
- Reactivity
- Human, Mouse
- Host
- Mouse
- Isotype
- IgG
- Antibody clone number
- CHI2S4N
- Vial size
- 100 Tests
- Concentration
- 5 µL/Test
- Storage
- 4° C, store in dark, DO NOT FREEZE!
Submitted references Neutrophil extracellular traps and their histones promote Th17 cell differentiation directly via TLR2.
The Toxoplasma gondii virulence factor ROP16 acts in cis and trans, and suppresses T cell responses.
CD1d highly expressed on DCs reduces lung tumor burden by enhancing antitumor immunity.
Wilson AS, Randall KL, Pettitt JA, Ellyard JI, Blumenthal A, Enders A, Quah BJ, Bopp T, Parish CR, Brüstle A
Nature communications 2022 Jan 26;13(1):528
Nature communications 2022 Jan 26;13(1):528
The Toxoplasma gondii virulence factor ROP16 acts in cis and trans, and suppresses T cell responses.
Chen L, Christian DA, Kochanowsky JA, Phan AT, Clark JT, Wang S, Berry C, Oh J, Chen X, Roos DS, Beiting DP, Koshy AA, Hunter CA
The Journal of experimental medicine 2020 Mar 2;217(3)
The Journal of experimental medicine 2020 Mar 2;217(3)
CD1d highly expressed on DCs reduces lung tumor burden by enhancing antitumor immunity.
Li Y, Zhao C, Liu J, Lu Z, Lu M, Gu J, Liu R
Oncology reports 2019 May;41(5):2679-2688
Oncology reports 2019 May;41(5):2679-2688
No comments: Submit comment
Supportive validation
- Submitted by
- Invitrogen Antibodies (provider)
- Main image

- Experimental details
- Intracellular staining of unstimulated (orange histogram) or 15-minute IL-4-stimulated (purple histogram) Th2-polarized CD4+ T cells with Anti-Human/Mouse phospho-STAT6 (Y641) PerCP-eFluor® 710. Cells in the lymphocyte gate were used for analysis.

Supportive validation
- Submitted by
- Invitrogen Antibodies (provider)
- Main image

- Experimental details
- NULL

- Submitted by
- Invitrogen Antibodies (provider)
- Main image
- Experimental details
- NULL

- Submitted by
- Invitrogen Antibodies (provider)
- Main image

- Experimental details
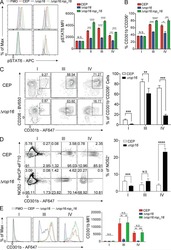
- Fig. 6 Histones induce rapid phosphorylation of STAT3 in a MyD88-, TLR2-dependent manner. a Histogram showing the geometric mean of fluorescence intensity (gMFI) and b quantification of the change in (Delta) the gMFI of tyrosine 705 phosphorylation of STAT3 (pSTAT3) after 5 min incubation with histones (10 ug/mL, gray line) or IL-6 (black line) compared to controls (dashed black line) n = 3. c Relative gMFI of pSTAT3 compared to matched 0 ug/mL control over time, n = 4-6 mice per time point. d Phosphorylation of STAT3 and STAT6 after 5 min of stimulation analyzed by imaging flow cytometry with images shown representative of the mean pSTAT3 fluorescence intensity after stimulation. e Relative gMFI of treated cells from Myd88 -/- and Tlr2 -/- mice after 5 min n (WT) = 8, n ( My88 -/- , Tlr2 -/- ) = 3. Data bars show mean +- SEM. ""ns"" (not significant), p > 0.05; ""*/ # "" p < 0.05; ""**"" p < 0.01; "" ### "" p < 0.001; "" #### "" p < 0.0001. Where significance is not indicated, differences were ns. b One-way ANOVA with Dunnett's multiple comparisons test, c mixed-effects model (REML) (where * denotes differences between 10 and 0 ug/mL controls, # denotes significance between IL-6 and 0 ug controls), e two-way ANOVA with Dunnet's multiple comparisons test. All data are representative of a minimum of two independent experiments. Source data are provided as a Source Data file.

- Submitted by
- Invitrogen Antibodies (provider)
- Main image

- Experimental details
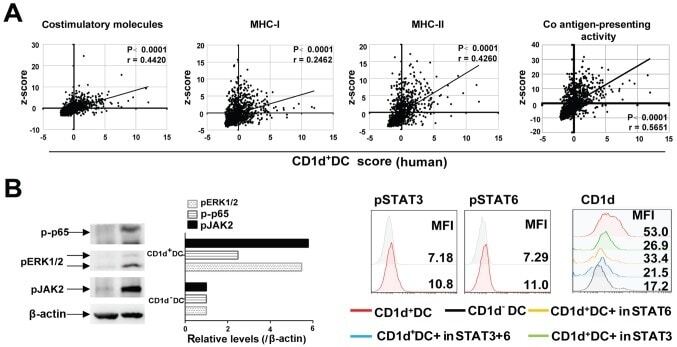
- Figure 5. (A) The correlation analysis between CD1d + DC cell score and Co antigen-presenting activity score. The costimulatory molecule scores were calculated by combining the expression levels of CD40, CD80 and CD86; the MHC-I score was calculated by combining the expression levels of HLA-A/B/C; and the MHC-II score was calculated by combining the expression levels of HLA-DMA/DOA/DQA1/DRA. The co antigen-presenting activity score was calculated by combining the expression levels of CD40, CD80, CD86 and MHC-I/II. Pearsons correlation coefficient was performed. (B) Protein levels of pp65, pERK1/2 and pJAK2 in CD1d + DC cells and CD1d - DC cells were detected via western blot analysis. FACS analysis of pSTAT6 and pSTAT3 in CD1d + DC cells and CD1d - DC cells. CD1d + DC cells were treated with inhibitors of pSTAT3 (10 nM) and pSTAT6 (10 nM), and then expression levels of CD1d were detected by FACS. DC, dendritic cells; MFI, median fluorescence intensity; FACS, fluorescence-activated cell sorter.