 Explore
 Validate
 Learn
Learn Flow cytometry
Antibody data
- Antibody Data
- Antigen structure
- References [3]
- Comments [0]
- Validations
- Flow cytometry [1]
- Other assay [1]
Submit
Validation data
Reference
Comment
Report error
- Product number
- 12-9008-42 - Provider product page

- Provider
- Invitrogen Antibodies
- Product name
- Phospho-STAT1 (Tyr701) Monoclonal Antibody (KIKSI0803), PE, eBioscience™
- Antibody type
- Monoclonal
- Antigen
- Other
- Description
- Description: This KIKSI0803 monoclonal antibody recognizes signal transducer and activator of transcription 1 (STAT1) when phosphorylated on tyrosine 701. STAT proteins are activated by ligand binding to receptors, such as cytokine receptors, that associate with Janus kinase (JAK) family members. Following their phosphorylation by JAKs, STAT proteins translocate to the nucleus where they bind to DNA and regulate transcription of specific genes in a cell type- and cytokine-specific manner. Phosphorylation of STAT1 on tyrosine 701 by JAK1 and JAK2 is essential for STAT1 dimer formation, nuclear translocation, and DNA binding activity. In response to IFN gamma stimulation, STAT1 homodimerizes or forms heterodimers with STAT3 that can bind to GAS (IFN gamma-activated sequence) promoter elements. In response to either IFN alpha or IFN beta stimulation, STAT1 forms a heterodimer with STAT2 that can bind ISRE (IFN-stimulated response element) promoter elements. Specificity of this KIKSI0803 clone was determined by ELISA, flow cytometry, and western blotting. Applications Reported: This KIKSI0803 antibody has been reported for use in intracellular staining followed by flow cytometric analysis. Applications Tested: This KIKSI0803 antibody has been pre-titrated and tested by intracellular staining followed by flow cytometric analysis of normal human peripheral blood cells. This can be used at 5 µL (0.06 µg) per test. A test is defined as the amount (µg) of antibody that will stain a cell sample in a final volume of 100 µL. Cell number should be determined empirically but can range from 10^5 to 10^8 cells/test. Staining Protocol: We recommend using Protocol C: Two-step protocol: Fixation/Methanol. Protocol A: Two-step protocol: intracellular (cytoplasmic) proteins and Protocol B: One-step protocol: intracellular (nuclear) proteins cannot be used. All Protocols can be found in the Flow Cytometry Protocols: "Staining Intracellular Antigens for Flow Cytometry Protocol" located in the Best Protocols Section under the Resources tab online. Excitation: 488-561 nm; Emission: 578 nm; Laser: Blue Laser, Green Laser, Yellow-Green Laser. Filtration: 0.2 µm post-manufacturing filtered.
- Reactivity
- Human
- Host
- Mouse
- Conjugate
- Yellow dye
- Isotype
- IgG
- Antibody clone number
- KIKSI0803
- Vial size
- 100 Tests
- Concentration
- 5 µL/Test
- Storage
- 4° C, store in dark, DO NOT FREEZE!
Submitted references Hematopoietic stem cell heterogeneity is linked to the initiation and therapeutic response of myeloproliferative neoplasms.
Mapping of Signaling Pathways Linked to sIgAD Reveals Impaired IL-21 Driven STAT3 B-Cell Activation.
Autoimmunity, hypogammaglobulinemia, lymphoproliferation, and mycobacterial disease in patients with activating mutations in STAT3.
Tong J, Sun T, Ma S, Zhao Y, Ju M, Gao Y, Zhu P, Tan P, Fu R, Zhang A, Wang D, Wang D, Xiao Z, Zhou J, Yang R, Loughran SJ, Li J, Green AR, Bresnick EH, Wang D, Cheng T, Zhang L, Shi L
Cell stem cell 2021 Apr 1;28(4):780
Cell stem cell 2021 Apr 1;28(4):780
Mapping of Signaling Pathways Linked to sIgAD Reveals Impaired IL-21 Driven STAT3 B-Cell Activation.
Lemarquis AL, Theodors F, Einarsdottir HK, Ludviksson BR
Frontiers in immunology 2019;10:403
Frontiers in immunology 2019;10:403
Autoimmunity, hypogammaglobulinemia, lymphoproliferation, and mycobacterial disease in patients with activating mutations in STAT3.
Haapaniemi EM, Kaustio M, Rajala HL, van Adrichem AJ, Kainulainen L, Glumoff V, Doffinger R, Kuusanmäki H, Heiskanen-Kosma T, Trotta L, Chiang S, Kulmala P, Eldfors S, Katainen R, Siitonen S, Karjalainen-Lindsberg ML, Kovanen PE, Otonkoski T, Porkka K, Heiskanen K, Hänninen A, Bryceson YT, Uusitalo-Seppälä R, Saarela J, Seppänen M, Mustjoki S, Kere J
Blood 2015 Jan 22;125(4):639-48
Blood 2015 Jan 22;125(4):639-48
No comments: Submit comment
Supportive validation
- Submitted by
- Invitrogen Antibodies (provider)
- Main image
- Experimental details
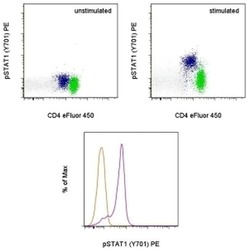
- TOP: Intracellular staining of unstimulated (left) or 15-minute IFN gamma-stimulated (right) normal human peripheral blood cells with Anti-Human CD4 eFluor® 450 (Product # 48-0047-42) and Anti-Human phospho-STAT1 (Y701) PE using the Fixation/Methanol Protocol. Monocytes are defined in blue, CD4+ T cells are defined in green. BOTTOM: Intracellular staining of unstimulated (orange histogram) or 15-minute IFN gamma-stimulated (purple histogram) normal human peripheral blood cells with Anti-Human phospho-STAT1 (Y701) PE. CD14+ CD4 low monocytes were used for analysis.
- Conjugate
- Yellow dye

Supportive validation
- Submitted by
- Invitrogen Antibodies (provider)
- Main image

- Experimental details
- Figure 1 ET HSCs Exhibit Prominent Mk Lineage Priming and Elevated Interferon (IFN) Signaling (A) Representative flow cytometry profiles for HSC isolation from bone marrow mononuclear cells (BM-MNCs) ( Table S1 ). (B) t-SNE analysis of transcriptomic profiles of HSCs from individuals with JAK2V617F + ET and PV and normal controls (NCs). (C) Selected feature genes from ET, PV, and NC HSCs. The percentage of expressing samples (Per.Exp) and average expression values (Aver.Exp) are shown. (D) GSEA of Mk-primed HSC gene sets in HSCs of affected individuals and NCs ( Table S2 ). Normalized enrichment score (NES), p value, and false discovery rate (FDR) are shown. (E) GSEA of various lineage-restricted or primed gene sets in pre-granulocytes and monocytes (pre-GMs), Mk and erythroid precursors (MegEs), and erythroid precursors (Erys) ( Table S2 ). (F) Strategy and representative flow cytometry of vWF + and CD41a + HSC subpopulations. (G) Proportions of vWF + and CD41a + HSC subpopulations shown in (F). (H) GSEA of the HALLMARK IFNalpha response gene set in HSCs of affected individuals and NCs. (I) STAT gene expression in ET, PV, and NC HSCs. Log 2 -transformed (fragments per kilobase million [FPKM]+1) are shown for individuals. Thick horizontal lines indicate median expression levels, and boxes represent the first and third quartiles. (J) Strategy and representative flow cytometry for measurement of phosphorylated STAT1 (p-STAT1), p-STAT3, and p-STAT5 levels. (K) Relative fluoresce
- Conjugate
- Yellow dye
