 Explore
 Validate
 Learn
Learn Western blot
Antibody data
- Antibody Data
- Antigen structure
- References [53]
- Comments [0]
- Validations
- Western blot [2]
- Immunocytochemistry [1]
- Other assay [42]
Submit
Validation data
Reference
Comment
Report error
- Product number
- 44-625G - Provider product page

- Provider
- Invitrogen Antibodies
- Product name
- Phospho-FAK (Tyr397) Monoclonal Antibody (141-9)
- Antibody type
- Monoclonal
- Antigen
- Synthetic peptide
- Description
- This antibody will cross-react with the corresponding autophosphorylation site on Proline-rich/Ca2+- activated tyrosine kinase (Pyk2), [pY402]. FAK [pY397] polyclonal antibody (Cat. No. 44-624G) does not cross-react with Pyk2. The antibody has been used in western blotting. Previous lots of this antibody have been used in immunocytochemistry. For western blotting applications, we recommend using the antibody at a 1:1,000 starting dilution. For immunofluorecence staining applications, we recommend a 1:50 starting dilution. Positive control used: Primary chicken embryo fibroblasts expressing human FAK and plated on fibronectin. We recommend a brief centrifugation before opening to settle vial contents. Then, apportion into working aliquots and store at -20° C. For shipment or short-term storage (up to one week), 2-8° C is sufficient. Expires one year from date of receipt when stored as instructed.
- Reactivity
- Human, Mouse, Rat, Chicken/Avian, Drosophila, Xenopus
- Host
- Rabbit
- Isotype
- IgG
- Antibody clone number
- 141-9
- Vial size
- 10 blots
- Concentration
- 0.5 mg/mL
- Storage
- -20°C
Submitted references Intravital imaging technology guides FAK-mediated priming in pancreatic cancer precision medicine according to Merlin status.
Integrin-linked kinase tunes cell-cell and cell-matrix adhesions to regulate the switch between apoptosis and EMT downstream of TGFβ1.
Inhibiting FAK-Paxillin Interaction Reduces Migration and Invadopodia-Mediated Matrix Degradation in Metastatic Melanoma Cells.
Cell adhesion is regulated by CDK1 during the cell cycle.
SCARA5 plays a critical role in the commitment of mesenchymal stem cells to adipogenesis.
Neural-specific deletion of the focal adhesion adaptor protein paxillin slows migration speed and delays cortical layer formation.
Integrin-mediated traction force enhances paxillin molecular associations and adhesion dynamics that increase the invasiveness of tumor cells into a three-dimensional extracellular matrix.
Targeting CXCR4 and FAK reverses doxorubicin resistance and suppresses invasion in non-small cell lung carcinoma.
Angiopoietin-1 deficiency increases tumor metastasis in mice.
Endothelin-1 mediated induction of extracellular matrix genes in strial marginal cells underlies strial pathology in Alport mice.
Tumor Cell-Driven Extracellular Matrix Remodeling Drives Haptotaxis during Metastatic Progression.
Genotype tunes pancreatic ductal adenocarcinoma tissue tension to induce matricellular fibrosis and tumor progression.
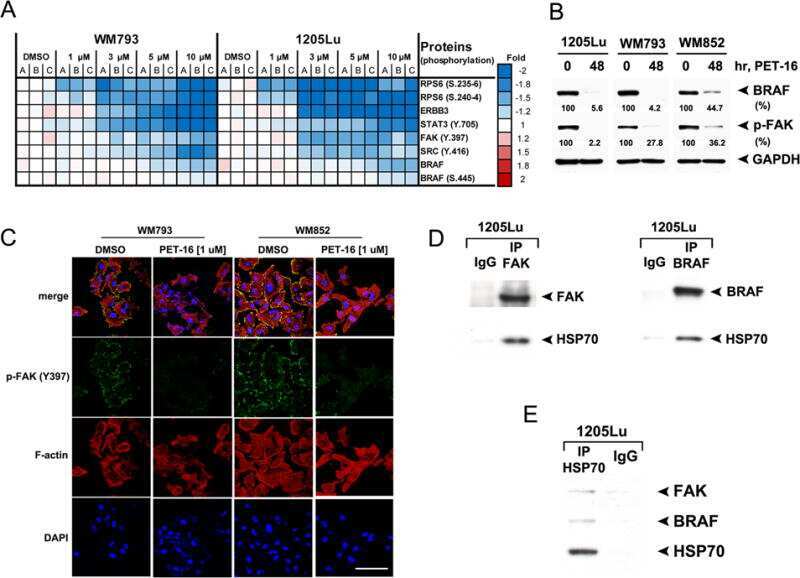
HSP70 Inhibition Limits FAK-Dependent Invasion and Enhances the Response to Melanoma Treatment with BRAF Inhibitors.
Integrin signalling regulates the expansion of neuroepithelial progenitors and neurogenesis via Wnt7a and Decorin.
Modulation of FAK and Src adhesion signaling occurs independently of adhesion complex composition.
β-Arrestin1 and Signal-transducing Adaptor Molecule 1 (STAM1) Cooperate to Promote Focal Adhesion Kinase Autophosphorylation and Chemotaxis via the Chemokine Receptor CXCR4.
Quantitative Proteomics Reveals the Dynamics of Protein Phosphorylation in Human Bronchial Epithelial Cells during Internalization, Phagosomal Escape, and Intracellular Replication of Staphylococcus aureus.
Krüppel-like factor 8 activates the transcription of C-X-C cytokine receptor type 4 to promote breast cancer cell invasion, transendothelial migration and metastasis.
A multi-omics approach identifies key hubs associated with cell type-specific responses of airway epithelial cells to staphylococcal alpha-toxin.
Actin-bundling protein plastin 3 is a regulator of ectoplasmic specialization dynamics during spermatogenesis in the rat testis.
Doxycycline inhibits leukemic cell migration via inhibition of matrix metalloproteinases and phosphorylation of focal adhesion kinase.
Macrolide analog F806 suppresses esophageal squamous cell carcinoma (ESCC) by blocking β1 integrin activation.
Focal adhesion kinase is involved in rabies virus infection through its interaction with viral phosphoprotein P.
Understanding the roles of FAK in cancer: inhibitors, genetic models, and new insights.
The adhesion GPCR GPR126 has distinct, domain-dependent functions in Schwann cell development mediated by interaction with laminin-211.
Defining the phospho-adhesome through the phosphoproteomic analysis of integrin signalling.
Definition of a consensus integrin adhesome and its dynamics during adhesion complex assembly and disassembly.
Focal adhesion kinase-dependent focal adhesion recruitment of SH2 domains directs SRC into focal adhesions to regulate cell adhesion and migration.
A novel regulatory pathway in granulosa cells, the LH/human chorionic gonadotropin-microRNA-125a-3p-Fyn pathway, is required for ovulation.
Low molecular weight protein tyrosine phosphatase (LMWPTP) upregulation mediates malignant potential in colorectal cancer.
MicroRNA miR-125a-3p modulates molecular pathway of motility and migration in prostate cancer cells.
Herpes simplex virus type 2 glycoprotein H interacts with integrin αvβ3 to facilitate viral entry and calcium signaling in human genital tract epithelial cells.
Force engages vinculin and promotes tumor progression by enhancing PI3K activation of phosphatidylinositol (3,4,5)-triphosphate.
KLF8 and FAK cooperatively enrich the active MMP14 on the cell surface required for the metastatic progression of breast cancer.
Kindlin-1 regulates mitotic spindle formation by interacting with integrins and Plk-1.
Palladin is a regulator of actin filament bundles at the ectoplasmic specialization in adult rat testes.
Colon cancer cells adopt an invasive phenotype without mesenchymal transition in 3-D but not 2-D culture upon combined stimulation with EGF and crypt growth factors.
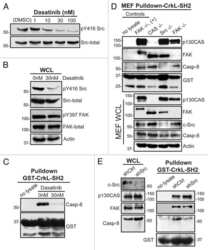
Src-inducible association of CrkL with procaspase-8 promotes cell migration.
microRNA-125a-3p reduces cell proliferation and migration by targeting Fyn.
Intercellular adhesion molecule-2 is involved in apical ectoplasmic specialization dynamics during spermatogenesis in the rat.
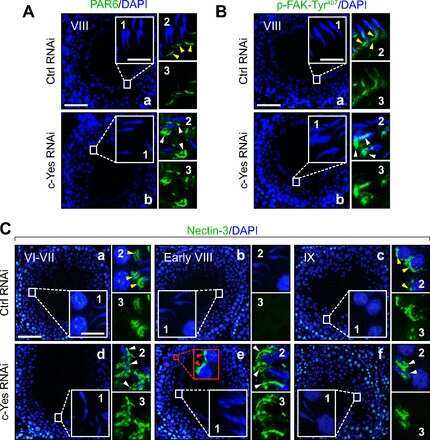
c-Yes regulates cell adhesion at the apical ectoplasmic specialization-blood-testis barrier axis via its effects on protein recruitment and distribution.
Cortactin as a target for FAK in the regulation of focal adhesion dynamics.
Nuclear-localized focal adhesion kinase regulates inflammatory VCAM-1 expression.
Focal adhesion kinase-Tyr407 and -Tyr397 exhibit antagonistic effects on blood-testis barrier dynamics in the rat.
Specific β-containing integrins exert differential control on proliferation and two-dimensional collective cell migration in mammary epithelial cells.
FAK promotes recruitment of talin to nascent adhesions to control cell motility.
Filamin C plays an essential role in the maintenance of the structural integrity of cardiac and skeletal muscles, revealed by the medaka mutant zacro.
Perisynaptic chondroitin sulfate proteoglycans restrict structural plasticity in an integrin-dependent manner.
Synthetic heparan sulfate oligosaccharides inhibit endothelial cell functions essential for angiogenesis.
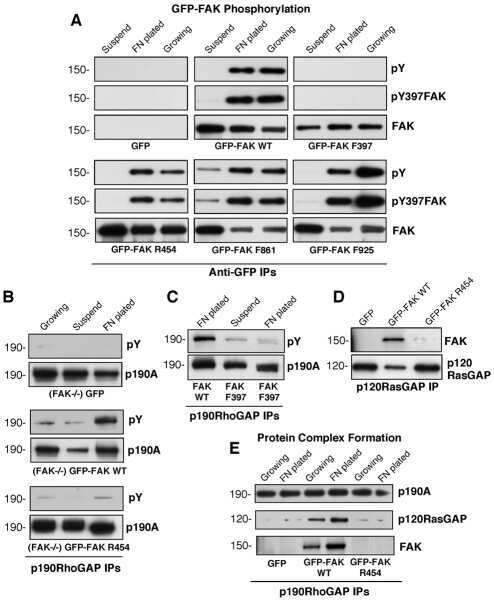
A FAK-p120RasGAP-p190RhoGAP complex regulates polarity in migrating cells.
An adaptor role for cytoplasmic Sam68 in modulating Src activity during cell polarization.
Increased expression and phosphorylation of focal adhesion kinase correlates with dysfunction in the volume-overloaded human heart.
Analyzing FAK and Pyk2 in early integrin signaling events.
Murphy KJ, Reed DA, Vennin C, Conway JRW, Nobis M, Yin JX, Chambers CR, Pereira BA, Lee V, Filipe EC, Trpceski M, Ritchie S, Lucas MC, Warren SC, Skhinas JN, Magenau A, Metcalf XL, Stoehr J, Major G, Parkin A, Bidanel R, Lyons RJ, Zaratzian A, Tayao M, Da Silva A, Abdulkhalek L, Australian Pancreatic Genome Initiative (APGI), Australian Pancreatic Cancer Matrix Atlas (APMA), Gill AJ, Johns AL, Biankin AV, Samra J, Grimmond SM, Chou A, Goetz JG, Samuel MS, Lyons JG, Burgess A, Caldon CE, Horvath LG, Daly RJ, Gadegaard N, Wang Y, Sansom OJ, Morton JP, Cox TR, Pajic M, Herrmann D, Timpson P
Science advances 2021 Oct;7(40):eabh0363
Science advances 2021 Oct;7(40):eabh0363
Integrin-linked kinase tunes cell-cell and cell-matrix adhesions to regulate the switch between apoptosis and EMT downstream of TGFβ1.
Kilinc AN, Han S, Barrett LA, Anandasivam N, Nelson CM
Molecular biology of the cell 2021 Mar 1;32(5):402-412
Molecular biology of the cell 2021 Mar 1;32(5):402-412
Inhibiting FAK-Paxillin Interaction Reduces Migration and Invadopodia-Mediated Matrix Degradation in Metastatic Melanoma Cells.
Mousson A, Legrand M, Steffan T, Vauchelles R, Carl P, Gies JP, Lehmann M, Zuber G, De Mey J, Dujardin D, Sick E, Rondé P
Cancers 2021 Apr 14;13(8)
Cancers 2021 Apr 14;13(8)
Cell adhesion is regulated by CDK1 during the cell cycle.
Jones MC, Askari JA, Humphries JD, Humphries MJ
The Journal of cell biology 2018 Sep 3;217(9):3203-3218
The Journal of cell biology 2018 Sep 3;217(9):3203-3218
SCARA5 plays a critical role in the commitment of mesenchymal stem cells to adipogenesis.
Lee H, Lee YJ, Choi H, Seok JW, Yoon BK, Kim D, Han JY, Lee Y, Kim HJ, Kim JW
Scientific reports 2017 Nov 1;7(1):14833
Scientific reports 2017 Nov 1;7(1):14833
Neural-specific deletion of the focal adhesion adaptor protein paxillin slows migration speed and delays cortical layer formation.
Rashid M, Belmont J, Carpenter D, Turner CE, Olson EC
Development (Cambridge, England) 2017 Nov 1;144(21):4002-4014
Development (Cambridge, England) 2017 Nov 1;144(21):4002-4014
Integrin-mediated traction force enhances paxillin molecular associations and adhesion dynamics that increase the invasiveness of tumor cells into a three-dimensional extracellular matrix.
Mekhdjian AH, Kai F, Rubashkin MG, Prahl LS, Przybyla LM, McGregor AL, Bell ES, Barnes JM, DuFort CC, Ou G, Chang AC, Cassereau L, Tan SJ, Pickup MW, Lakins JN, Ye X, Davidson MW, Lammerding J, Odde DJ, Dunn AR, Weaver VM
Molecular biology of the cell 2017 Jun 1;28(11):1467-1488
Molecular biology of the cell 2017 Jun 1;28(11):1467-1488
Targeting CXCR4 and FAK reverses doxorubicin resistance and suppresses invasion in non-small cell lung carcinoma.
Dragoj M, Milosevic Z, Bankovic J, Tanic N, Pesic M, Stankovic T
Cellular oncology (Dordrecht) 2017 Feb;40(1):47-62
Cellular oncology (Dordrecht) 2017 Feb;40(1):47-62
Angiopoietin-1 deficiency increases tumor metastasis in mice.
Michael IP, Orebrand M, Lima M, Pereira B, Volpert O, Quaggin SE, Jeansson M
BMC cancer 2017 Aug 11;17(1):539
BMC cancer 2017 Aug 11;17(1):539
Endothelin-1 mediated induction of extracellular matrix genes in strial marginal cells underlies strial pathology in Alport mice.
Meehan DT, Delimont D, Dufek B, Zallocchi M, Phillips G, Gratton MA, Cosgrove D
Hearing research 2016 Nov;341:100-108
Hearing research 2016 Nov;341:100-108
Tumor Cell-Driven Extracellular Matrix Remodeling Drives Haptotaxis during Metastatic Progression.
Oudin MJ, Jonas O, Kosciuk T, Broye LC, Guido BC, Wyckoff J, Riquelme D, Lamar JM, Asokan SB, Whittaker C, Ma D, Langer R, Cima MJ, Wisinski KB, Hynes RO, Lauffenburger DA, Keely PJ, Bear JE, Gertler FB
Cancer discovery 2016 May;6(5):516-31
Cancer discovery 2016 May;6(5):516-31
Genotype tunes pancreatic ductal adenocarcinoma tissue tension to induce matricellular fibrosis and tumor progression.
Laklai H, Miroshnikova YA, Pickup MW, Collisson EA, Kim GE, Barrett AS, Hill RC, Lakins JN, Schlaepfer DD, Mouw JK, LeBleu VS, Roy N, Novitskiy SV, Johansen JS, Poli V, Kalluri R, Iacobuzio-Donahue CA, Wood LD, Hebrok M, Hansen K, Moses HL, Weaver VM
Nature medicine 2016 May;22(5):497-505
Nature medicine 2016 May;22(5):497-505
HSP70 Inhibition Limits FAK-Dependent Invasion and Enhances the Response to Melanoma Treatment with BRAF Inhibitors.
Budina-Kolomets A, Webster MR, Leu JI, Jennis M, Krepler C, Guerrini A, Kossenkov AV, Xu W, Karakousis G, Schuchter L, Amaravadi RK, Wu H, Yin X, Liu Q, Lu Y, Mills GB, Xu X, George DL, Weeraratna AT, Murphy ME
Cancer research 2016 May 1;76(9):2720-30
Cancer research 2016 May 1;76(9):2720-30
Integrin signalling regulates the expansion of neuroepithelial progenitors and neurogenesis via Wnt7a and Decorin.
Long K, Moss L, Laursen L, Boulter L, Ffrench-Constant C
Nature communications 2016 Feb 3;7:10354
Nature communications 2016 Feb 3;7:10354
Modulation of FAK and Src adhesion signaling occurs independently of adhesion complex composition.
Horton ER, Humphries JD, Stutchbury B, Jacquemet G, Ballestrem C, Barry ST, Humphries MJ
The Journal of cell biology 2016 Feb 1;212(3):349-64
The Journal of cell biology 2016 Feb 1;212(3):349-64
β-Arrestin1 and Signal-transducing Adaptor Molecule 1 (STAM1) Cooperate to Promote Focal Adhesion Kinase Autophosphorylation and Chemotaxis via the Chemokine Receptor CXCR4.
Alekhina O, Marchese A
The Journal of biological chemistry 2016 Dec 9;291(50):26083-26097
The Journal of biological chemistry 2016 Dec 9;291(50):26083-26097
Quantitative Proteomics Reveals the Dynamics of Protein Phosphorylation in Human Bronchial Epithelial Cells during Internalization, Phagosomal Escape, and Intracellular Replication of Staphylococcus aureus.
Richter E, Harms M, Ventz K, Nölker R, Fraunholz MJ, Mostertz J, Hochgräfe F
Journal of proteome research 2016 Dec 2;15(12):4369-4386
Journal of proteome research 2016 Dec 2;15(12):4369-4386
Krüppel-like factor 8 activates the transcription of C-X-C cytokine receptor type 4 to promote breast cancer cell invasion, transendothelial migration and metastasis.
Mukherjee D, Lu H, Yu L, He C, Lahiri SK, Li T, Zhao J
Oncotarget 2016 Apr 26;7(17):23552-68
Oncotarget 2016 Apr 26;7(17):23552-68
A multi-omics approach identifies key hubs associated with cell type-specific responses of airway epithelial cells to staphylococcal alpha-toxin.
Richter E, Harms M, Ventz K, Gierok P, Chilukoti RK, Hildebrandt JP, Mostertz J, Hochgräfe F
PloS one 2015;10(3):e0122089
PloS one 2015;10(3):e0122089
Actin-bundling protein plastin 3 is a regulator of ectoplasmic specialization dynamics during spermatogenesis in the rat testis.
Li N, Mruk DD, Wong CK, Lee WM, Han D, Cheng CY
FASEB journal : official publication of the Federation of American Societies for Experimental Biology 2015 Sep;29(9):3788-805
FASEB journal : official publication of the Federation of American Societies for Experimental Biology 2015 Sep;29(9):3788-805
Doxycycline inhibits leukemic cell migration via inhibition of matrix metalloproteinases and phosphorylation of focal adhesion kinase.
Wang C, Xiang R, Zhang X, Chen Y
Molecular medicine reports 2015 Sep;12(3):3374-3380
Molecular medicine reports 2015 Sep;12(3):3374-3380
Macrolide analog F806 suppresses esophageal squamous cell carcinoma (ESCC) by blocking β1 integrin activation.
Li LY, Jiang H, Xie YM, Liao LD, Cao HH, Xu XE, Chen B, Zeng FM, Zhang YL, Du ZP, Chen H, Huang W, Jia W, Zheng W, Xie JJ, Li EM, Xu LY
Oncotarget 2015 Jun 30;6(18):15940-52
Oncotarget 2015 Jun 30;6(18):15940-52
Focal adhesion kinase is involved in rabies virus infection through its interaction with viral phosphoprotein P.
Fouquet B, Nikolic J, Larrous F, Bourhy H, Wirblich C, Lagaudrière-Gesbert C, Blondel D
Journal of virology 2015 Feb;89(3):1640-51
Journal of virology 2015 Feb;89(3):1640-51
Understanding the roles of FAK in cancer: inhibitors, genetic models, and new insights.
Yoon H, Dehart JP, Murphy JM, Lim ST
The journal of histochemistry and cytochemistry : official journal of the Histochemistry Society 2015 Feb;63(2):114-28
The journal of histochemistry and cytochemistry : official journal of the Histochemistry Society 2015 Feb;63(2):114-28
The adhesion GPCR GPR126 has distinct, domain-dependent functions in Schwann cell development mediated by interaction with laminin-211.
Petersen SC, Luo R, Liebscher I, Giera S, Jeong SJ, Mogha A, Ghidinelli M, Feltri ML, Schöneberg T, Piao X, Monk KR
Neuron 2015 Feb 18;85(4):755-69
Neuron 2015 Feb 18;85(4):755-69
Defining the phospho-adhesome through the phosphoproteomic analysis of integrin signalling.
Robertson J, Jacquemet G, Byron A, Jones MC, Warwood S, Selley JN, Knight D, Humphries JD, Humphries MJ
Nature communications 2015 Feb 13;6:6265
Nature communications 2015 Feb 13;6:6265
Definition of a consensus integrin adhesome and its dynamics during adhesion complex assembly and disassembly.
Horton ER, Byron A, Askari JA, Ng DHJ, Millon-Frémillon A, Robertson J, Koper EJ, Paul NR, Warwood S, Knight D, Humphries JD, Humphries MJ
Nature cell biology 2015 Dec;17(12):1577-1587
Nature cell biology 2015 Dec;17(12):1577-1587
Focal adhesion kinase-dependent focal adhesion recruitment of SH2 domains directs SRC into focal adhesions to regulate cell adhesion and migration.
Wu JC, Chen YC, Kuo CT, Wenshin Yu H, Chen YQ, Chiou A, Kuo JC
Scientific reports 2015 Dec 18;5:18476
Scientific reports 2015 Dec 18;5:18476
A novel regulatory pathway in granulosa cells, the LH/human chorionic gonadotropin-microRNA-125a-3p-Fyn pathway, is required for ovulation.
Grossman H, Chuderland D, Ninio-Many L, Hasky N, Kaplan-Kraicer R, Shalgi R
FASEB journal : official publication of the Federation of American Societies for Experimental Biology 2015 Aug;29(8):3206-16
FASEB journal : official publication of the Federation of American Societies for Experimental Biology 2015 Aug;29(8):3206-16
Low molecular weight protein tyrosine phosphatase (LMWPTP) upregulation mediates malignant potential in colorectal cancer.
Hoekstra E, Kodach LL, Das AM, Ruela-de-Sousa RR, Ferreira CV, Hardwick JC, van der Woude CJ, Peppelenbosch MP, Ten Hagen TL, Fuhler GM
Oncotarget 2015 Apr 10;6(10):8300-12
Oncotarget 2015 Apr 10;6(10):8300-12
MicroRNA miR-125a-3p modulates molecular pathway of motility and migration in prostate cancer cells.
Ninio-Many L, Grossman H, Levi M, Zilber S, Tsarfaty I, Shomron N, Tuvar A, Chuderland D, Stemmer SM, Ben-Aharon I, Shalgi R
Oncoscience 2014;1(4):250-261
Oncoscience 2014;1(4):250-261
Herpes simplex virus type 2 glycoprotein H interacts with integrin αvβ3 to facilitate viral entry and calcium signaling in human genital tract epithelial cells.
Cheshenko N, Trepanier JB, González PA, Eugenin EA, Jacobs WR Jr, Herold BC
Journal of virology 2014 Sep 1;88(17):10026-38
Journal of virology 2014 Sep 1;88(17):10026-38
Force engages vinculin and promotes tumor progression by enhancing PI3K activation of phosphatidylinositol (3,4,5)-triphosphate.
Rubashkin MG, Cassereau L, Bainer R, DuFort CC, Yui Y, Ou G, Paszek MJ, Davidson MW, Chen YY, Weaver VM
Cancer research 2014 Sep 1;74(17):4597-611
Cancer research 2014 Sep 1;74(17):4597-611
KLF8 and FAK cooperatively enrich the active MMP14 on the cell surface required for the metastatic progression of breast cancer.
Lu H, Hu L, Yu L, Wang X, Urvalek AM, Li T, Shen C, Mukherjee D, Lahiri SK, Wason MS, Zhao J
Oncogene 2014 May 29;33(22):2909-17
Oncogene 2014 May 29;33(22):2909-17
Kindlin-1 regulates mitotic spindle formation by interacting with integrins and Plk-1.
Patel H, Zich J, Serrels B, Rickman C, Hardwick KG, Frame MC, Brunton VG
Nature communications 2013;4:2056
Nature communications 2013;4:2056
Palladin is a regulator of actin filament bundles at the ectoplasmic specialization in adult rat testes.
Qian X, Mruk DD, Wong EW, Lie PP, Cheng CY
Endocrinology 2013 May;154(5):1907-20
Endocrinology 2013 May;154(5):1907-20
Colon cancer cells adopt an invasive phenotype without mesenchymal transition in 3-D but not 2-D culture upon combined stimulation with EGF and crypt growth factors.
Ludwig K, Tse ES, Wang JY
BMC cancer 2013 May 2;13:221
BMC cancer 2013 May 2;13:221
Src-inducible association of CrkL with procaspase-8 promotes cell migration.
Graf R, Barbero S, Keller N, Chen L, Uryu S, Schlaepfer D, Stupack D
Cell adhesion & migration 2013 Jul-Aug;7(4):362-9
Cell adhesion & migration 2013 Jul-Aug;7(4):362-9
microRNA-125a-3p reduces cell proliferation and migration by targeting Fyn.
Ninio-Many L, Grossman H, Shomron N, Chuderland D, Shalgi R
Journal of cell science 2013 Jul 1;126(Pt 13):2867-76
Journal of cell science 2013 Jul 1;126(Pt 13):2867-76
Intercellular adhesion molecule-2 is involved in apical ectoplasmic specialization dynamics during spermatogenesis in the rat.
Xiao X, Cheng CY, Mruk DD
The Journal of endocrinology 2013 Jan;216(1):73-86
The Journal of endocrinology 2013 Jan;216(1):73-86
c-Yes regulates cell adhesion at the apical ectoplasmic specialization-blood-testis barrier axis via its effects on protein recruitment and distribution.
Xiao X, Mruk DD, Cheng CY
American journal of physiology. Endocrinology and metabolism 2013 Jan 15;304(2):E145-59
American journal of physiology. Endocrinology and metabolism 2013 Jan 15;304(2):E145-59
Cortactin as a target for FAK in the regulation of focal adhesion dynamics.
Tomar A, Lawson C, Ghassemian M, Schlaepfer DD
PloS one 2012;7(8):e44041
PloS one 2012;7(8):e44041
Nuclear-localized focal adhesion kinase regulates inflammatory VCAM-1 expression.
Lim ST, Miller NL, Chen XL, Tancioni I, Walsh CT, Lawson C, Uryu S, Weis SM, Cheresh DA, Schlaepfer DD
The Journal of cell biology 2012 Jun 25;197(7):907-19
The Journal of cell biology 2012 Jun 25;197(7):907-19
Focal adhesion kinase-Tyr407 and -Tyr397 exhibit antagonistic effects on blood-testis barrier dynamics in the rat.
Lie PP, Mruk DD, Mok KW, Su L, Lee WM, Cheng CY
Proceedings of the National Academy of Sciences of the United States of America 2012 Jul 31;109(31):12562-7
Proceedings of the National Academy of Sciences of the United States of America 2012 Jul 31;109(31):12562-7
Specific β-containing integrins exert differential control on proliferation and two-dimensional collective cell migration in mammary epithelial cells.
Jeanes AI, Wang P, Moreno-Layseca P, Paul N, Cheung J, Tsang R, Akhtar N, Foster FM, Brennan K, Streuli CH
The Journal of biological chemistry 2012 Jul 13;287(29):24103-12
The Journal of biological chemistry 2012 Jul 13;287(29):24103-12
FAK promotes recruitment of talin to nascent adhesions to control cell motility.
Lawson C, Lim ST, Uryu S, Chen XL, Calderwood DA, Schlaepfer DD
The Journal of cell biology 2012 Jan 23;196(2):223-32
The Journal of cell biology 2012 Jan 23;196(2):223-32
Filamin C plays an essential role in the maintenance of the structural integrity of cardiac and skeletal muscles, revealed by the medaka mutant zacro.
Fujita M, Mitsuhashi H, Isogai S, Nakata T, Kawakami A, Nonaka I, Noguchi S, Hayashi YK, Nishino I, Kudo A
Developmental biology 2012 Jan 1;361(1):79-89
Developmental biology 2012 Jan 1;361(1):79-89
Perisynaptic chondroitin sulfate proteoglycans restrict structural plasticity in an integrin-dependent manner.
Orlando C, Ster J, Gerber U, Fawcett JW, Raineteau O
The Journal of neuroscience : the official journal of the Society for Neuroscience 2012 Dec 12;32(50):18009-17, 18017a
The Journal of neuroscience : the official journal of the Society for Neuroscience 2012 Dec 12;32(50):18009-17, 18017a
Synthetic heparan sulfate oligosaccharides inhibit endothelial cell functions essential for angiogenesis.
Cole CL, Hansen SU, Baráth M, Rushton G, Gardiner JM, Avizienyte E, Jayson GC
PloS one 2010 Jul 21;5(7):e11644
PloS one 2010 Jul 21;5(7):e11644
A FAK-p120RasGAP-p190RhoGAP complex regulates polarity in migrating cells.
Tomar A, Lim ST, Lim Y, Schlaepfer DD
Journal of cell science 2009 Jun 1;122(Pt 11):1852-62
Journal of cell science 2009 Jun 1;122(Pt 11):1852-62
An adaptor role for cytoplasmic Sam68 in modulating Src activity during cell polarization.
Huot ME, Brown CM, Lamarche-Vane N, Richard S
Molecular and cellular biology 2009 Apr;29(7):1933-43
Molecular and cellular biology 2009 Apr;29(7):1933-43
Increased expression and phosphorylation of focal adhesion kinase correlates with dysfunction in the volume-overloaded human heart.
Lopes MM, Ribeiro GC, Tornatore TF, Clemente CF, Teixeira VP, Franchini KG
Clinical science (London, England : 1979) 2007 Aug;113(4):195-204
Clinical science (London, England : 1979) 2007 Aug;113(4):195-204
Analyzing FAK and Pyk2 in early integrin signaling events.
Bernard-Trifilo JA, Lim ST, Hou S, Schlaepfer DD, Ilic D
Current protocols in cell biology 2006 Apr;Chapter 14:Unit 14.7
Current protocols in cell biology 2006 Apr;Chapter 14:Unit 14.7
No comments: Submit comment
Supportive validation
- Submitted by
- Invitrogen Antibodies (provider)
- Main image

- Experimental details
- Western Blot analysis using Rabbit anti-FAK (pY397) monoclonal antibody (Product # 44-625G).

- Submitted by
- Invitrogen Antibodies (provider)
- Main image

- Experimental details
- Up-regulation and Antibody-Peptide Competition. Peptide Competition Experiment. Extracts of vanadate-treated (50 µM, 16 hours) primary chicken embryo fibroblasts plated on fibronectin and expressing either FAK Y397F mutant protein (lane 1) or FAK wildtype protein (lanes 2-6) were resolved by SDS-PAGE on a 10% Tris-glycine gel and transferred to PVDF. The membrane was blocked with a 5% BSA-TBST buffer for 1 hour at room temperature, then incubated with the FAK (pY397) monoclonal antibody for two hours at room temperature in a 3% BSA-TBST buffer, following prior incubation with: no peptide (lanes 1 and 2), the non-phosphopeptide corresponding to the phosphopeptide immunogen (lane 3), a generic phosphotyrosine-containing peptide (lane 4), or the phosphopeptide immunogen (5). After washing, the membrane was incubated with goat F (ab’)2 anti-rabbit IgG HRP-conjugate (Product # ALI4404) and signals were detected using the Pierce SuperSignal™ method. The data demonstrate the specificity of the antibody by mutant analysis and by peptide competition. Immunofluorescence Staining HeLa cells were fixed prior to immunostaining with the FAK (pY397) monoclonal antibody. Signals were detected with an anti-rabbit FITC conjugated secondary antibody. The data show that the antibody detected phosphorylated FAK localized at focal adhesions. Cells were counterstained with DAPI.

Supportive validation
- Submitted by
- Invitrogen Antibodies (provider)
- Main image
- Experimental details
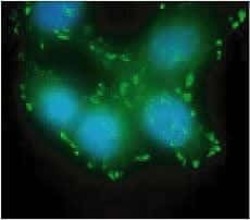
- HeLa cells were fixed prior to immunostaining with the Rabbit anti-FAK (pY397) monoclonal antibody. The signal was detected with an anti-rabbit FITC conjugated secondary antibody. The data shows that the antibody detected phosphorylated FAK localized at focal adhesions. Cells were counterstained with DAPI. (Product # 44-625G)

Supportive validation
- Submitted by
- Invitrogen Antibodies (provider)
- Main image
- Experimental details
- NULL
- Submitted by
- Invitrogen Antibodies (provider)
- Main image
- Experimental details
- NULL
- Submitted by
- Invitrogen Antibodies (provider)
- Main image

- Experimental details
- NULL

- Submitted by
- Invitrogen Antibodies (provider)
- Main image

- Experimental details
- NULL

- Submitted by
- Invitrogen Antibodies (provider)
- Main image

- Experimental details
- NULL
- Submitted by
- Invitrogen Antibodies (provider)
- Main image

- Experimental details
- NULL

- Submitted by
- Invitrogen Antibodies (provider)
- Main image

- Experimental details
- NULL

- Submitted by
- Invitrogen Antibodies (provider)
- Main image

- Experimental details
- NULL
- Submitted by
- Invitrogen Antibodies (provider)
- Main image

- Experimental details
- NULL

- Submitted by
- Invitrogen Antibodies (provider)
- Main image
- Experimental details
- NULL

- Submitted by
- Invitrogen Antibodies (provider)
- Main image

- Experimental details
- NULL

- Submitted by
- Invitrogen Antibodies (provider)
- Main image
- Experimental details
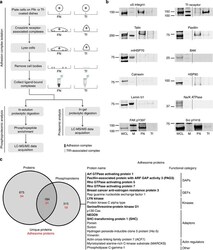
- Figure 1 Combined proteomic and phosphoproteomic analysis of isolated adhesion complexes. ( a ) Schematic workflow for the isolation and proteomic/phosphoproteomic analysis of adhesion complexes. Cells were allowed to spread on FN or, as a control, Tf and complexes were isolated by a combination of crosslinking, cell lysis and a high-pressure wash to remove cell bodies. Collected complexes were analysed using either a proteomic or phosphoproteomic workflow, after which the FN-specific proteins and phosphoproteins were identified by performing a subtractive comparison with controls. ( b ) Immunoblot analysis of complexes isolated from cells spread on FN and Tf, as well as the WCLs of cells spread on FN. M, MW markers (kDa; values displayed to the left of each blot). Dashed lines indicate where images have been cropped for display purposes. ( c ) A Venn diagram showing the overlap between the FN-specific proteins (left circle) and phosphoproteins (right circle) identified by proteomic and phosphoproteomic analyses of isolated complexes, respectively. In addition to the total number of proteins (black text), the number of adhesome proteins identified in each data set is also displayed (red text). To the right of the panel, all 19 adhesome components identified exclusively by the phosphoproteomic analysis are displayed. Proteins in bold text were not identified by any other proteomic analyses of isolated FN-induced adhesion complexes.
- Submitted by
- Invitrogen Antibodies (provider)
- Main image

- Experimental details
- Figure 4. FAK E1015A expression inhibits talin binding and recruitment to nascent adhesions. (A) Cell lysates were prepared from FAK -/- MEFs stably re-expressing GFP, GFP-FAK WT, or GFP-FAK E1015A after replating on FN for 15 min. Anti-GFP immunoprecipitates were analyzed for endogenous talin and paxillin association. Lysates were also analyzed for talin, GFP-FAK, paxillin, and actin expression. (B) GFP-FAK WT and GFP-FAK E1015A MEFs were plated on FN for 15 min and analyzed for GPP-FAK (green) and paxillin (red) staining ( Fig. S3 A ). (C and D) In parallel, cells were analyzed for GPP-FAK (green) and talin (red) staining. Co-localization analyses and box and whisker plots are described in the legend for Fig. 1 . Representative images of FN-replated GFP-FAK WT and GFP-FAK E1015A MEFs are shown. The merged images show colocalization (yellow). Inset, enlarged area of peripheral adhesion staining (circled). Bars, 10 um. (E) FAK -/- MEFs expressing GFP, GFP-FAK WT, or GFP-FAK E1015A were serum starved, suspended (S), and FN replated for the indicated times. Anti-pY397 FAK immunoblotting shows FN-stimulated FAK activation with respect to total FAK and actin levels. Molecular mass is indicated next to the gel blots in kilodaltons. (F and G) Adhesion number (F) and size (G) were determined in the indicated cells at 60 min on FN by anti-paxillin staining in at least 10 cells per experimental group. Box and whisker plots are described in the legend to Fig. 1 (**, P < 0.01; *, P < 0.

- Submitted by
- Invitrogen Antibodies (provider)
- Main image

- Experimental details
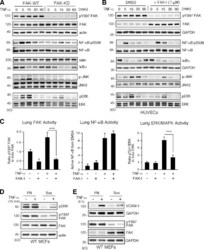
- Figure 1. TNF-alpha-induced VCAM-1 expression within heart-associated ECs in vivo is dependent on FAK activity. PBS or TNF-alpha (0.02 mg/kg) was tail vein injected into mice, and, after 6 h, tissues were analyzed by immunoblotting or staining. Where indicated, FAK-I (100 mg/kg, PND-1186) was administered 3 h before starting experiments. (A) Immunoblotting of heart lysates shows increased VCAM-1 expression and FAK Y397 or FAK Y576 phosphorylation upon TNF-alpha stimulation in vivo. FAK-I addition prevents VCAM-1 production and FAK tyrosine phosphorylation but no change in FAK expression. Internal loading controls for each gel are shown by anti-actin immunoblotting. (B) Heart-associated VCAM-1 or FAK activation (pY397) was determined by immunoblotting (see Fig. S1 ) and expressed as a ratio to actin or total FAK, as determined by densitometry, respectively. Values are means (+-SD) from six mice, representing two independent experiments (***, P < 0.001). (C) In vivo signaling assays were performed as in A, and heart sections were analyzed by combined staining for activated FAK (pY576) and ECs (CD31). Bar, 20 um. (D) Mean correlation of pixel intensities from anti-pY576 FAK and anti-CD31 staining of heart sections, as shown in C. (E) Visualization of EC-associated VCAM-1 expression. Heart sections were analyzed by combined staining for VCAM-1 and ECs (CD31). A merged image is shown. Bar, 20 um. (F) Mean correlation of pixel intensities from anti-VCAM-1 and anti-CD31 staining of

- Submitted by
- Invitrogen Antibodies (provider)
- Main image

- Experimental details
- Figure 2. FAK activity controls developmental VCAM-1 expression. (A) FAK-KD embryos at E9.5 exhibit an enlarged and unfused allantois (arrow) compared with normal FAK-WT embryos where chorioallantoic fusion has occurred. (B) Treatment of pregnant female mice with FAK-I (100 mg/kg, PND-1186 from E7.5 to E9.5) but not vehicle (water) results in lethality of embryos (E9.5), exhibiting defective allantois formation (arrow). (C) Sagittal sections of E9.5 WT and FAK-KD embryos. FAK-KD embryos do not form somites (S) and display gross defects in head, heart (H), and allantois (Al). The arrow indicates the chorion (Ch) membrane. G, gut; N, neural cell. (D) Whole-mount anti-VCAM-1 staining of embryos at E9.5 reveals no VCAM-1 expression in FAK-KD compared with FAK-WT embryos. HD, head. (E) Lack of VCAM-1 staining in FAK-I (100 mg/kg, PND-1186 from E7.5 to E9.5) compared with vehicle-treated embryos at E9.5. (A-E) Bars, 100 um. (F-H) VCAM-1 protein expression and FAK activation are inhibited within FAK-KD and FAK-I-treated embryos. Immunoblotting of E9.5 embryo lysates reveals VCAM-1 levels (left) and FAK phosphorylation (pY397; right) with actin and total FAK as loading controls. Results from MEFs (G) or ECs (H) show that TNF-alpha (10 ng/ml, 16 h) induces VCAM-1 expression in FAK-WT but not FAK-KD cells, as determined by immunoblotting with pY397 FAK, total FAK, and actin levels, shown as controls.

- Submitted by
- Invitrogen Antibodies (provider)
- Main image
- Experimental details
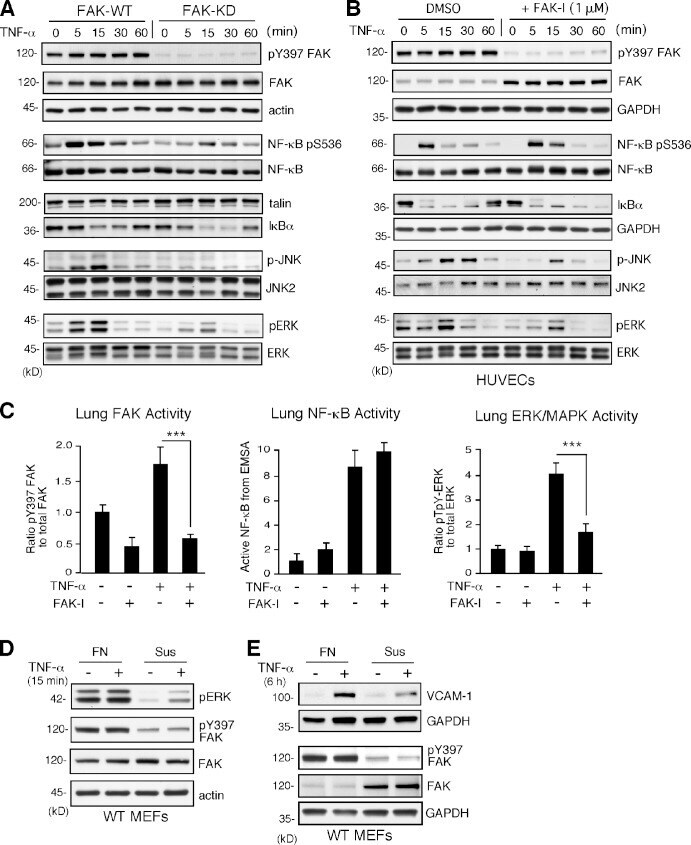
- Figure 4. TNF-alpha-induced MAPK but not NF-kappaB activation is dependent on FAK activity in vitro and in vivo. (A and B) FAK-WT or FAK-KD MEFs (A) and HUVECs pretreated with DMSO or FAK-I (1 uM PF271; B) were stimulated with 10 ng/ml TNF-alpha for the indicated times, and lysates were prepared for immunoblotting. Blots for activated FAK (pY397), total FAK, activated NF-kappaB (pS536), activated JNK (p-JNK and pT183/pY185), activated ERK (pERK and pT202/pY204), IkappaBalpha, and actin are shown. Internal loading controls for each gel are shown by anti-actin, anti-GAPDH, anti-talin, or reprobing membranes with antibodies to total NF-kappaB, JNK2, or total ERK1/2 immunoblotting. (C) PBS or TNF-alpha (0.02 mg/kg) was tail vein injected into mice, and, after 5 min (FAK and ERK activation) or 3 h (NF-kappaB activation), lung tissue was analyzed by immunoblotting or EMSA. Where indicated, FAK-I (100 mg/kg, PND-1186) was administered 3 h before starting experiments. Values, measured by densitometry, are means (+-SD) from six mice, representing two independent experiments. ***, P < 0.001. (D and E) MEFs were replated onto FN dishes or held in suspension (Sus) for 1 h before TNF-alpha (10 ng/ml) addition for 15 min (D) or 6 h (E) before protein cell lysis. Blots for activated ERK (pERK and pT202/pY204), activated FAK (pY397), total FAK, and actin are shown. Anti-GAPDH blotting is shown as loading controls.
- Submitted by
- Invitrogen Antibodies (provider)
- Main image

- Experimental details
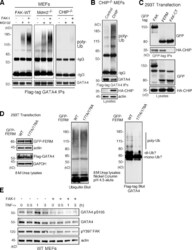
- Figure 5. FAK inhibition decreases GATA4 levels needed for TNF-alpha-induced VCAM-1 expression. (A) Steady-state GATA4 and GATA6 levels in FAK-WT and FAK-KD MEFs, as determined by immunoblotting with actin as a control. (B) FAK-WT MEFs treated with DMSO or FAK-I (1 uM PF271, 6 h) and lysates blotted for GATA4 or GATA6. Anti-GAPDH blotting is shown as loading controls. (C) GATA4 mRNA levels to GAPDH were determined by Q-PCR (+-SD; n = 3) in experiments, as described in B. (D) Rescue of TNF-alpha-induced VCAM-1 expression in FAK-KD MEFs by combined FAK-WT and GATA4 expression. Combinations of GFP-FAK and GATA4 were transfected into FAK-KD MEFs. After 24 h, cells were stimulated with 10 ng/ml TNF-alpha, as indicated, and FAK, VCAM-1, and GATA4 immunoblotting was performed at 40 h. (E) FAK-WT MEFs were transfected with Scr or GATA4 (G4) siRNA and, after 48 h, stimulated with TNF-alpha (10 ng/ml, 6 h), and immunoblotting was performed for VCAM-1 and GATA4. Anti-actin and anti-GAPDH blotting are shown as loading controls. (F) Densitometry analyses of VCAM-1 protein levels relative to actin, as described in E. (+-SD; n = 2; ***, P < 0.001). (G and H) MEFs were transfected with Scr or GATA4 siRNA and stimulated with TNF-alpha, as described in E. GATA4 (G) or VCAM-1 (H) mRNA levels to GAPDH were determined by Q-PCR (+-SD; n = 3; ****, P < 0.0001). (I) PBS or TNF-alpha (0.02 mg/kg) was tail vein injected into mice, and, after 6 h, heart lysates were analyzed by immunoblotting for VCAM-

- Submitted by
- Invitrogen Antibodies (provider)
- Main image
- Experimental details
- Figure 7. FAK-enhanced GATA4 polyubiquitination is dependent on CHIP and FAK-FERM nuclear localization. (A) FAK-WT, Mdm2 -/- p53 -/- , and CHIP -/- MEFs were transfected with flag-tagged GATA4 and treated with MG132 (40 uM, 3 h) and FAK-I (1 uM PF271), as indicated. Flag tag immunoprecipitates (IPs) were evaluated by anti-ubiquitin (Ub) and GATA4 immunoblotting and show no ubiquitination of GATA4 in CHIP -/- MEFs. (B) CHIP -/- MEFs were transfected with HA-tagged CHIP and flag-tagged GATA4 and treated with MG132 (40 uM, 3 h) and FAK-I (1 uM PF271). Flag tag immunoprecipitates were evaluated by anti-ubiquitin and GATA4 immunoblotting and show rescue of GATA4 ubiquitination by CHIP reexpression. Lysates show HA-CHIP and actin expression. (C) 293T cells were cotransfected with GFP-tagged FAK, FAK-FERM, and FAK-CT with HA-CHIP. Coimmunoprecipitation analyses with antibodies to GFP reveal FAK-FERM and CHIP association by immunoblotting. Lysates show equal levels of GFP-FAK and HA-CHIP expression. (D) 293T cells were transfected with GFP-tagged FAK-FERM WT or FAK-FERM R177A/R178A, flag-tagged GATA4, and His-tagged ubiquitin and denatured lysates (8 M urea) purified by nickel agarose affinity binding. GFP-FERM and Flag-GATA4 (with actin and GAPDH as loading controls; left), total eluted ubiquitinated proteins (middle), and mono-, di-, and polyubiquitinated GATA4 (right), as determined by immunoblotting, are shown. (E) FAK-WT MEFs pretreated with DMSO or FAK-I (1 uM PF271, 30 min) we

- Submitted by
- Invitrogen Antibodies (provider)
- Main image

- Experimental details
- Figure 3. FAK activity is essential for proinflammatory cytokine-mediated VCAM-1 expression. (A) TNF-alpha-induced (10 ng/ml, 16 h) VCAM-1 is prevented by FAK-I (PF271) treatment of HUVECs in a dose-dependent (0.1-2.5 uM FAK-I) manner. VCAM-1, pY397 FAK, total FAK, and actin levels were determined by immunoblotting. (B) TNF-alpha-induced VCAM-1 promoter activity is blocked by FAK inhibition. HUVECs were transfected with pGL3 promoterless luciferase (control) or pGL3 fused with the human VCAM-1 promoter, stimulated with TNF-alpha, and treated with FAK-I (1 uM PF271), as indicated, and relative luciferase activity (arbitrary units [a.u.]) is shown. Values are means (+-SD) from three independent experiments. (C) FAK knockdown prevents VCAM-1 expression. HUVECs were transduced with lentiviral Scr or anti-FAK short hairpin RNA (shRNA) and stimulated with TNF-alpha. FAK and VCAM-1 and actin expression levels were determined by immunoblotting, and densitometry values of VCAM-1 relative to actin are means (+-SD; n = 3; ***, P < 0.001). (D) VCAM-1 mRNA levels to GAPDH were determined by Q-PCR (+-SD; n = 3; ***, P < 0.001) in experiments, as described in C. (E) FAK activity is required for IL-1beta-induced VCAM-1 expression. HUVECs were stimulated with 20 ng/ml IL-1beta and 10 ng/ml TNF-alpha, and FAK-I (1 uM PF271) was added as indicated. After 16 h, VCAM-1, pY397 FAK, and actin levels were evaluated by immunoblotting.

- Submitted by
- Invitrogen Antibodies (provider)
- Main image

- Experimental details
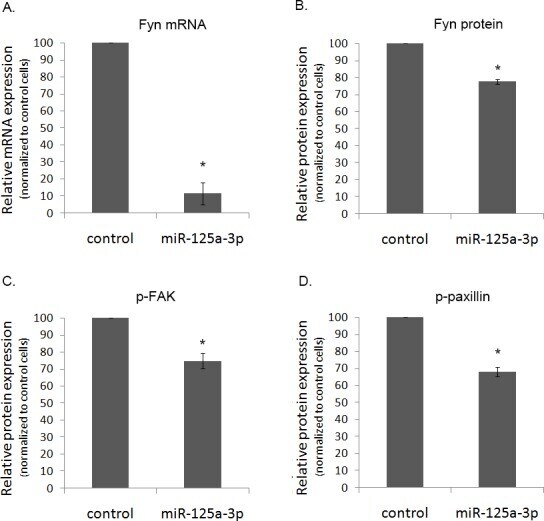
- Figure 4 The effect of miR-125a-3p on hallmark genes in prostate cancer PC3 cells, transfected with miR-125a-3p or with empty vector (control), were cultured for 48 hours. Cells were lysed and, (A) their Fyn mRNA expression was analyzed by Real Time PCR. Proteins were analyzed by WB with specific antibodies against: (B) Fyn, (C) phospho-FAK (p-FAK) and (D) phospho-paxillin (p-paxillin), as well as against their loading control proteins (actin, general FAK and general paxillin, respectively). The experiment was repeated 3 times. Intensity of bands was analyzed using the image J software and the ratio between each protein and its control was plotted. The bars are mean+SD. (*) - Significantly different from control value (p
- Submitted by
- Invitrogen Antibodies (provider)
- Main image

- Experimental details
- Figure 5 Focal adhesion association of SRC controls SRC-mediated substrate phosphorylation, focal adhesion formation and cell migration. ( a ) Cell lysates from U2OS cells expressing GFP, SRC-GFP, SRCDeltaSH2-GFP, SRCY527F-GFP or SRCY527FDeltaSH2-GFP were analyzed by Western blotting for pY577-FAK, pY397-FAK, pY118-paxillin, pY31-paxillin, paxillin, GAPDH and GFP. ( b ) Cell lysates from SYF cells expressing GFP, SRC-GFP, SRCDeltaSH2-GFP, SRCY527F-GFP or SRCY527FDeltaSH2-GFP were analyzed by Western blotting for pY577-FAK, pY397-FAK, pY118-paxillin, pY31-paxillin, paxillin, GAPDH and GFP. ( c ) U2OS cells expressing GFP, SRCY527F-GFP or SRCY527FDeltaSH2-GFP (blue) were immunostained to detect F-actin (phalloidin; red) and paxillin (green), and imaged by epi-fluorescence and TIRFM, respectively. Scale bar, 10 mum. ( d ) The number of segmented paxillin-marked FAs within U2OS cells, as described in ( c ). Data are means +- s.e.m. (GFP: n = 11 cells; SRCY527F-GFP: n = 13 cells; SRCY527FDeltaSH2-GFP: n = 12 cells). ** p < 0.01; *** p < 0.001; NS, no significance. ( e ) Size distribution of segmented paxillin-marked FAs of U2OS cells, as described in ( c ). Data are means +- s.e.m. * p < 0.05; ** p < 0.01; *** p < 0.001; NS, no significance. ( f ) The migratory behavior of U2OS cells expressing GFP, SRCY527F-GFP or SRCY527FDeltaSH2-GFP for 6 hrs. Cells were plated for 16 hrs, and then monitored for 6 hrs. (right) These images delineate the trajectory of the GFP-marked cells over a

- Submitted by
- Invitrogen Antibodies (provider)
- Main image

- Experimental details
- Figure 1. Inhibition of FAK activity by FAK [i] in human fibroblasts. (A) Immunoblotting of FAK phosphorylation sites FAK Y397 and FAK Y576 and total FAK in total cell lysates. HFF cells spread on FN for 1 h were treated with DMSO or the FAK inhibitor AZ13256675 (FAK [i]) for 1 h using half-log dilutions. Cells kept in suspension for 30 min (Susp) were used to detect basal FAK activity. Untreated cells spread on FN for 2 h were used to detect maximal FAK activity. FAK Y397 and FAK Y576 were used to assess FAK catalytic activity. Molecular mass values (kD) are displayed. (B and C) Quantification of immunoblotted membranes in A. FAK phosphorylation values FAK Y397 (B) and FAK Y576 (C) were normalized to total FAK (mean +- SEM, n = 3). (D) Dose-response curve using FAK Y397 as a readout for FAK activity to determine percentage inhibition relative to cells treated with DMSO. Gray lines and shading show values for suspension and untreated FN conditions (not used to calculate the trendline, mean +- SEM, n = 3). The 50% FAK Y397 inhibitory concentration (IC 50 ) was calculated as 0.11 uM FAK [i] using the formula y = 12.23ln( x ) + 76.99 ( y, percentage inhibition; x, FAK [i] concentration). (E) HFFs spread on FN for 1 h were treated with DMSO, 0.1 uM FAK [i], or 3 uM FAK [i] for 1 h. IACs were visualized by staining for FAK Y397 (green) and vinculin (red) by immunofluorescence. The actin cytoskeleton was visualized by staining with fluorophore-conjugated phalloidin. Bars: (main) 20

- Submitted by
- Invitrogen Antibodies (provider)
- Main image
- Experimental details
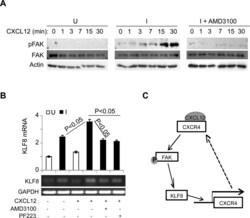
- Figure 5 The upregulation of CXCR4 by KLF8 leads to a feed-forward activation of FAK upstream of KLF8 ( A ) Overexpression of KLF8 causes CXCL12/CXCR4-dependent activation of FAK. Uninduced (U) and induced (I) 10A-iK8 cells were serum-starved for 24 hours followed by 3-hour treatment with AMD3100 (35 ng/ml) or mock treatment prior to CXCL12 (100 ng/ml) stimulation. Whole cell lysates were prepared for western blotting for FAK phosphorylation at Y397 (pFAK) and total FAK. ( B ) Overexpression of KLF8 induces CXCL12/CXCR4-dependent expression of endogenous KLF8. The 10A-iK8 cells were grown and treated similarly as in A except for inclusion of PF223, a FAK-specific inhibitor. Total RNA was prepared for qRT-PCR (top panel) and semi-quantitative RT-PCT (bottom panel). ( C ) Hypothetic model for the feed-forward signaling loop of KLF8 to CXCR4/CXCL12 to pFAK and back to KLF8.

- Submitted by
- Invitrogen Antibodies (provider)
- Main image

- Experimental details
- Fig. 4 Angpt1 deficiency enhances initial stages of distant metastasis. a Quantification of B16F10 cells in the lungs 24 h after tail vein injection in WT ( n = 6) and Angpt1 Delta/Delta mice ( n = 6). b Quantification of B16F10 cells in the lungs 4 h after tail vein injection in WT and Angpt1 Delta/Delta mice ( n = 4-5). c Representative fluorescent image of lung from WT and Angpt1 Delta/Delta mice 4 h after tail vein injection of GFP positive B16F10 cells. d Leakage experiments with cadaverin in WT and Angpt1 Delta/Delta mice, with and without tail vein injection of B16F10 cells. e Measurement of cross-sectional area of capillaries from micrographs of lungs from WT ( n = 4) and Angpt1 Delta/Delta ( n = 4) mice. f Quantification of microspheres in lungs 4 h after tail vein injection in WT ( n = 5) and Angpt1 Delta/Delta ( n = 5) mice** p < 0.01, *** p < 0.001. g Western blotting for FAK phosphorylation at Tyr397 in WT and Angpt1 Delta/Delta mice, with and without tail vein injection of B16F10 cells. h Quantification of B16F10 cell attachment to HUVECs with or without pre-treatment with Angpt1

- Submitted by
- Invitrogen Antibodies (provider)
- Main image
- Experimental details
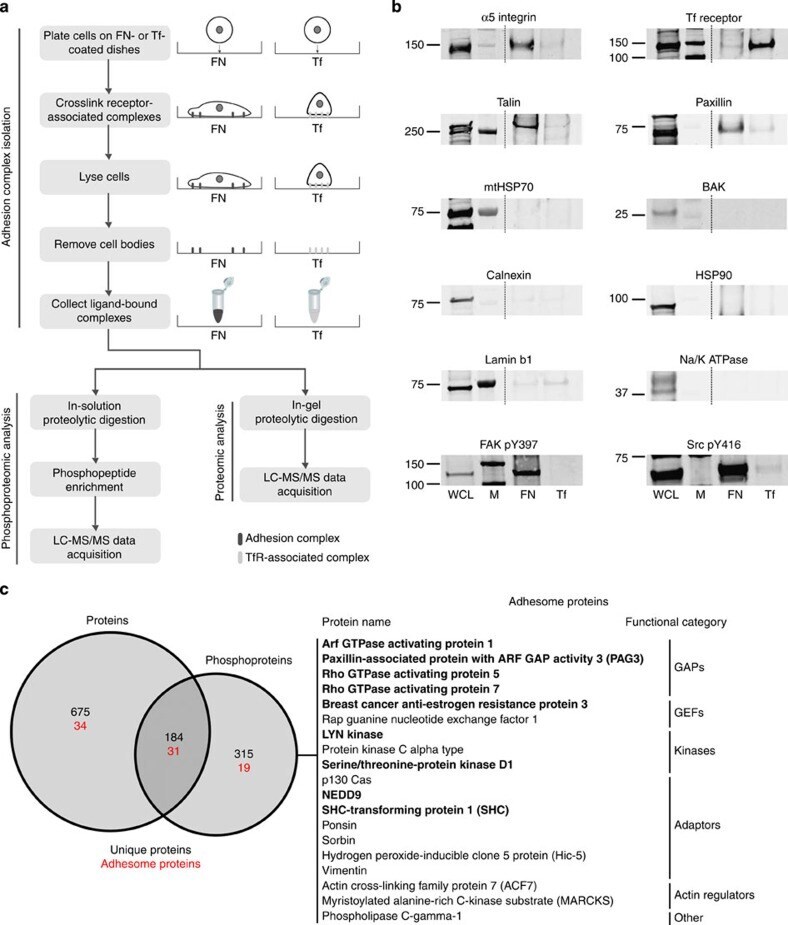
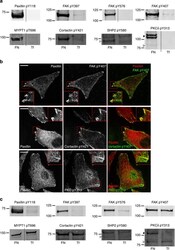
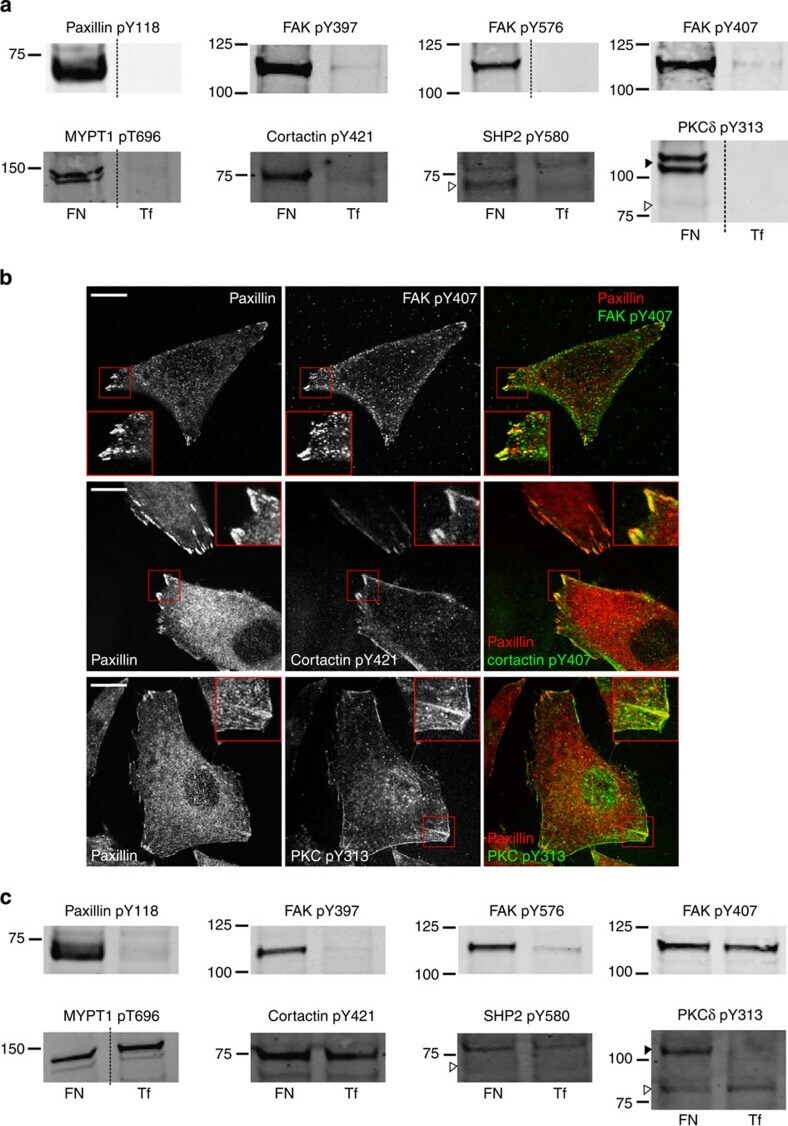
- Figure 4 Validation of adhesion complex-localized phosphorylation sites. ( a ) Immunoblot analyses of the protein complexes isolated from cells spread on FN or Tf for 120 min. Samples were probed using phosphospecific antibodies targeting: paxillin pTyr118; FAK pTyr397, pTyr576 and pTyr407; MYPT1 pThr696; cortactin pTyr421; SHP2 pTyr580; and PKCdelta pTyr313. ( b ) Immunofluorescence images of cells spread on FN for 120 min. Cells were stained using the phosphospecific antibodies FAK pTyr407, cortactin pTyr421 and PKCdelta pTyr313 (all green). In each case, cells were also stained using an antibody targeting the focal adhesion marker paxillin (red). Scale bar, 20 mum. ( c ) Immunoblot analyses of the WCLs of cells spread on FN or Tf for 120 min. Samples were probed using the same antibodies as used to probe isolated complexes in a . Dashed lines in a , c indicate where the images have been cropped for display purposes. White arrows to left of blots highlight the expected MWs of the corresponding proteins. Black arrows to the left of blots highlight a putative high MW isoform of PKCdelta.
- Submitted by
- Invitrogen Antibodies (provider)
- Main image

- Experimental details
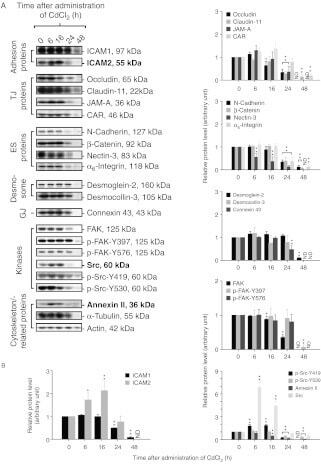
- Figure 4 ICAM2, Src, and annexin II increase during CdCl 2 -induced testis damage. Immunoblotting experiments showing changes in the levels of several proteins (A). Proteins whose levels increased following CdCl 2 treatment are labeled as bold. Actin was used as an internal control. Histograms (B) summarizing immunoblotting results. Each data point was normalized against its corresponding actin data point and then against '0 h', which was arbitrarily set at 1. Each bar represents mean+- s.d. of n =3-6 rats. * P
- Submitted by
- Invitrogen Antibodies (provider)
- Main image

- Experimental details
- Figure 3 FAK PRR2 and PRR3 regions are direct binding sites for cortactin. (A) Cortactin SH3 domain binds FAK as determined by GST or GST-cortactin SH3 domain pulldown assays using in vitro translated FAK protein. FAK immunoblotting shows binding and 5% of input. (B) Schematic of FAK containing an N-terminal FERM domain, three PRR (PRR1-PRR3) sites, a central kinase domain, and a C-terminal FA targeting region. Point-mutations are indicated that disrupt PRR2 (A712/713) and PRR3 (A876/877). The indicated FAK regions (below) were used as bait or prey in direct binding assays as either GFP, C-terminal TAP, or GST fusion proteins. (C) FAK C-terminal domain binds cortactin. GFP fusions of FAK 1-402, FAK 396-686, and FAK 411-686 with a C-terminal TAP tag or non-tagged FAK 686-1052 were in vitro translated in the presence of biotin-lysine and used in a direct binding assay with GST or GST-cortactin attached to beads. Streptavidin-HRP analyses show the amount of FAK bound or 5% of prey material used in the binding assay. (D) FAK PRR3 region binds cortactin. In vitro translated full-length cortactin was incubated with GST-FAK (853-946) or GST-FAK (947-1052) in a direct binding assay. Streptavidin-HRP analyses show the amount of cortactin bound or 5% of prey material used in the binding assay. (E) FAK PRR2 and PRR3 are individually required for cortactin binding. GFP-fusions of FAK WT, A713/713, or A876/877 were in vitro translated and incubated with GST-cortactin in a direct binding a

- Submitted by
- Invitrogen Antibodies (provider)
- Main image

- Experimental details
- Figure 5 Regulation of FAK and cortactin binding by FN adhesion. (A) Lysates were made from MEFs held in suspension for 30 min or FN re-plated (30 and 60 min) and were analyzed by cortactin or FAK antibody immunoprecipitation (IP) followed by immunoblotting for cortactin and FAK. (B) Mutations disrupting FAK activity or within PRR2 either stabilize or prevent cortactin association with FAK by co-IP analyses, respectively. Lysates were made from the indicated GFP-FAK reconstituted MEFs held in suspension for 30 min or FN plated (30 and 60 min) and were analyzed by anti-GFP IPs followed by anti-cortactin, anti-FAK Y397 phosphorylation (pY397), and anti-GFP immunoblotting to determine the level of GFP-FAK.

- Submitted by
- Invitrogen Antibodies (provider)
- Main image

- Experimental details
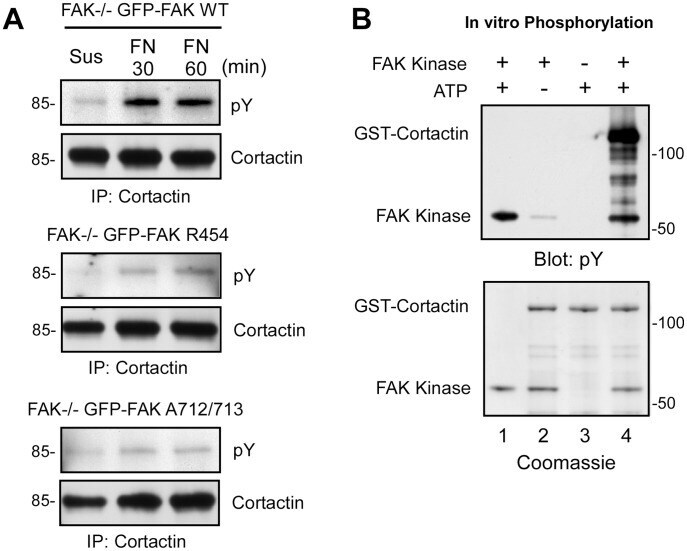
- Figure 7 FAK tyrosine phosphorylation of cortactin during FN replating of MEFs. (A) Lysates were made from the indicated GFP-FAK reconstituted MEFs held in suspension for 30 min or FN plated (30 and 60 min) and were analyzed by anti-cortactin IPs followed by anti-phosphotyrosine (pY) and anti-cortactin immunoblotting. (B) In vitro kinase assays using recombinant GST-Cortactin incubated in the presence (lanes 1, 2 and 4) or absence (lane 3) of recombinant FAK kinase, or presence (lanes 1,3 and 4) and absence (lane 2) of ATP. Proteins were analyzed by anti-phosphotyrosine (pY) immunoblotting and by Coomassie staining.
- Submitted by
- Invitrogen Antibodies (provider)
- Main image

- Experimental details
- Figure 5 Invasive characteristics at the edge of the flat disc-like colonies. A ) Western blots of E-cadherin and vimentin. HCT-116 cells were grown in 3-D matrigel with E or RNEW media for 6 days. Cells were then lysed and subjected to Western blot analysis to determine the levels of E-cadherin and vimentin as described in Materials and Methods. GAPDH was used as a loading control. Densitometry shown below each protein. B ) Confocal images of round or flat colonies of HCT-116 cells grown in 3-D with E or RNEW media for 6 days. a, c, and e: round colonies; b, d, f, and g: flat colonies; a-b: E-cadherin merged with DNA; c-d: beta-catenin merged with DNA, and e-g: actin merged with DNA, g: zoom of image f. C ) Western blots of total and phospho-FAK. HCT-116 cells were grown in 3-D matrigel for 6 days with E or RNEW media. Cells were then lysed and subjected to Western blot analysis to determine the levels of total and phospho-FAK as described in Materials and Methods. GAPDH was used as a loading control. D ) Quantitation and images of Ki67 positive cells. HCT-116 cells were grown in 2-D or 3-D conditions with E or RNEW media for 6 days, stained for Ki67 and DNA and the percentage of Ki67 positive cells was assessed by immunofluorescence. Results are expressed as mean percentage of Ki67 positive cells, +/- SEM, n=3. Fluorescent images of HCT-116 cells grown in 3-D with (a) E or (b) RNEW media for 6 days. Cells were stained for DNA (blue) and Ki67 (green).

- Submitted by
- Invitrogen Antibodies (provider)
- Main image
- Experimental details
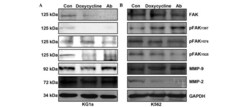
- Figure 3 Effects of anti-beta1-integrin-Ab blocking treatment on FAK protein expression and phosphorylation as well as the expression of gelatinases (MMP-2 and MMP-9) in KG1a and K562 leukemic cell lines. Protein expression levels of FAK, pFAK at sites (Y397, Y925 and Y576/577), MMP-2 and MMP-9 were determined using western blot analysis in (A) KG1a and (B) K562 cells treated with doxycycline (1 ug/ml) or anti-beta1-integrin-Ab (100 ng/ml). GAPDH was used as the loading control. Ab, antibodies; FAK, focal adhesion kinase; MMP, matrix metalloproteinase; Y, tyrosine; Con, control; p, phosphorylated.

- Submitted by
- Invitrogen Antibodies (provider)
- Main image
- Experimental details
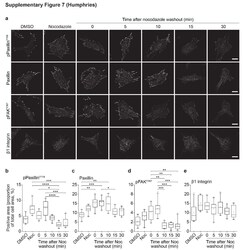
- Supplementary Figure 7

- Submitted by
- Invitrogen Antibodies (provider)
- Main image

- Experimental details
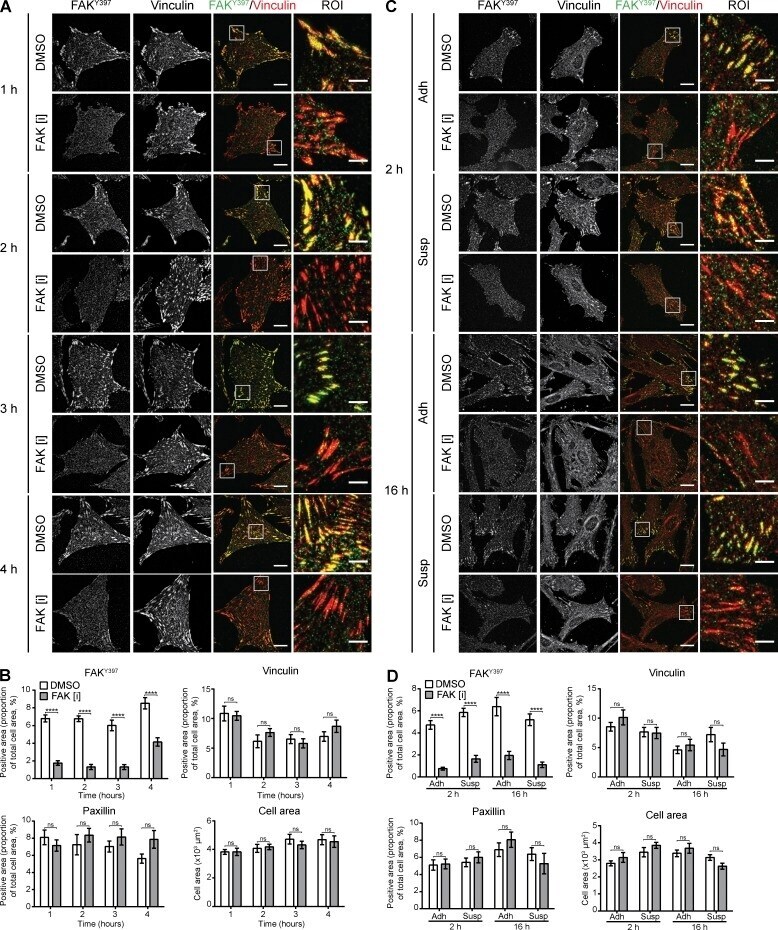
- Figure 3. Effects of the duration and timing of FAK inhibition on cell adhesion. (A) Immunofluorescence staining of HFF cells spread on FN for 1 h and treated with DMSO or 3 uM FAK [i] for 1, 2, 3, or 4 h. IACs were visualized by staining for FAK Y397 (green) and vinculin (red). Bars: (main) 20 um; (ROI) 5 um. Additional images of paxillin-positive areas and the actin cytoskeleton are shown in Fig. S2 A. (B) Quantification of images in A and Fig. S2 A . Quantification of the cell area covered by FAK Y397 -, vinculin-, and paxillin-positive areas, and the total cell area (mean +- SEM; n = 10 cells, FAK Y397 , vinculin, and paxillin; n = 20 cells, cell area). (C) Immunofluorescence staining of HFF cells treated with FAK [i] added to suspension or prespread cells. To examine effects on cell spreading and IAC formation, DMSO or FAK [i] was added to HFF cells kept in suspension and cells were plated onto FN-coated plates (Susp). To examine effects on IAC maturation, cells kept in suspension were plated onto FN-coated plates for 1 h and treated with DMSO or FAK [i] (Adh). In both cases, cells were fixed after 2 or 16 h total spreading times. IACs were visualized by staining for FAK Y397 (green) and vinculin (red). Bars: (main) 20 um; (ROI) 5 um. Additional images of paxillin-positive areas and the actin cytoskeleton are shown in Fig. S2 B. (D) Quantification of images in C and Fig. S2 B. Quantification of the cell area covered by FAK Y397 -, vinculin- and paxillin-positive areas, a
- Submitted by
- Invitrogen Antibodies (provider)
- Main image

- Experimental details
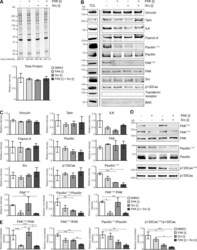
- Figure 6. Effects of FAK, Src and combined FAK and Src inhibition on IAC proteins and phosphorylation . (A-I) HFF cells spread on FN for 1 h were treated with DMSO, FAK [i], Src [i], or combined FAK [i] + Src [i] for 1 h. IACs were visualized by staining for pY (green) and alpha5 integrin (red; A-C), FAK Y397 (green) and vinculin (red; D-F) or paxillin Y118 (green) and paxillin (red; G-I). Bars: (main) 20 um; (ROI) 5 um. Graphs show quantification of the cell area covered by positive staining of the indicated protein (mean +- SEM, n = 10 cells). *, P < 0.05; **, P < 0.01; ***, P < 0.001; ****, P < 0.0001; ns, not significant; Kruskal-Wallis test with Dunn's post hoc correction (in C, F, and I, comparisons with cells treated with DMSO are shown). Representative images are shown.

- Submitted by
- Invitrogen Antibodies (provider)
- Main image
- Experimental details
- Figure 5. Effects of FAK, Src, and combined FAK and Src inhibition on IAC composition. (A and B) HFF cells spread on FN for 1 h were treated with DMSO, FAK [i], Src [i], or combined FAK [i] + Src [i] for 1 h. IACs were isolated using the workflow in Fig. 2 A and were analyzed by SDS-PAGE (A) and immunoblotting (B). Representative total protein intensity values for each lane are indicated. Graph shows intensity values normalized to the DMSO condition (mean +- SEM, n = 3). Cell lysates from cells spread on FN (TCL) were used as a positive control. Molecular mass values (kD) are displayed. (C) For quantification of immunoblotted membranes in B, the band intensity values for each protein are shown relative to the DMSO condition (mean +- SEM, n = 3). Quantification was not performed for Tf receptor or BAK. (D) Total cell lysates collected from HFF cells spread on FN for 1 h and treated with DMSO or inhibitors for 1 h were analyzed by immunoblotting. Molecular mass values (kD) are displayed. (E) For quantification of immunoblotted membranes in D, phosphorylation values normalized to the corresponding total protein values are shown relative to the DMSO condition (mean +- SEM; n = 4, FAK Y397 , FAK Y576 , and paxillin Y118 ; n = 3, p130Cas Y249 ). t test: *, P < 0.05; **, P < 0.01; ***, P < 0.001. Representative images are shown.

- Submitted by
- Invitrogen Antibodies (provider)
- Main image

- Experimental details
- Figure 5 F806 inhibits beta1 integrin activation in ESCC cells A. Cell lysates were immunoprecipitated (IP) with anti-active beta1 integrin antibody followed by probing with anti-total beta1 integrin antibody. Total cell lysates were immunoblotted for anti-total beta1 integrin, alpha5-integrin, beta4-integrin and beta-actin. B. Paraffin-embedded tumor tissues from xenograft models were immunohistochemistry staining for anti-active beta1 integrin. Original magnification, 400x; Scale bar, 50 mum. C. Total cell lysates were immunoblotted for anti-p-FAK, FAK, p-AKT, AKT, p-ERK, ERK and beta-actin. D. KYSE 510 cells were pre-incubated with anti-beta1 integrin or control IgG for 30 min and then seeded into FN-coated plates in the presence of F806 for 24 hr. The attached cells were recorded by MTT assay in each group. E. After si-NC or si-beta1 integrin transfection for 48 hr, KYSE510 cells were kept in FN-coated plates in the presence of F806 for 24 hr. The attached cells were recorded by MTT assay in each group. * P < 0.05 vs . control group; mean +- SD, n = 3-6.

- Submitted by
- Invitrogen Antibodies (provider)
- Main image

- Experimental details
- Figure 6 FAK-paxillin interaction conditions FAK localization to FA. ( A ) Cell extracts from A375 melanoma cells transiently co-transfected with siFAK and wild-type FAK-GFP or FAK-I936/I998-GFP were analyzed by immunoprecipitation (IP) using anti-FAK Ab and blotted for paxillin and FAK. The expression level of proteins in the corresponding cell lysate is shown. ( B ) Representative Western blot showing A375 melanoma cells transfected as described above and blotted for P-Y397 FAK, FAK total, eGFP and actin. ( C ) Cells transiently co-transfected with siFAK and wild-type FAK-GFP or FAK-I936/I998-GFP were fixed and labelled for paxillin (purple), actin (red) and P-Y397 FAK (cyan). Scale bar: 10 um. ( D ) Histograms represent the mean normalized to control +- SD of FAK localization in melanoma cells. Signals were measured by reporting the P-FAK signal in FA over that in the cytoplasm from 3 independent experiments ***, p < 0.001; unpaired t -test compared to control condition.

- Submitted by
- Invitrogen Antibodies (provider)
- Main image

- Experimental details
- FIGURE 4: Depletion of ILK decreases the activation and assembly of focal adhesion proteins. Immunoblotting analysis for GAPDH and (A) total FAK, pY397-FAK (pFAK), (B) total paxillin (Pax), and pY118-paxillin (pPax) in shcntl and shILK cells cultured on soft or stiff substrata. Quantification shows mean +- SD for three independent experiments; immunoblotting replicates and statistical analysis are shown in Supplemental Figure S4. Immunofluorescence analysis for F-actin (green), nuclei (blue), and (C) FAK (magenta), (D) pFAK (magenta), (E) Pax (magenta), or (F) pPax (magenta) in shcntl and shILK cells cultured on plastic. Scale bars, 20 mum.

- Submitted by
- Invitrogen Antibodies (provider)
- Main image

- Experimental details
- Fig. 7. A FAK signature reveals a graded response to stromal and epithelial FAKi priming before gemcitabine/Abraxane. ( A ) Schematic representation of PDAC PDX, PDCL, and PDX TMA establishment. ( B ) Representative images of TKCC05 and TKCC10 PDX TMA samples stained with total and pTyr 397 -FAK. Scale bars, 50 mum; n = 3 cores per PDX. ( C ) Quantification of pTyr 397 -FAK levels in PDCLs [mass spectrometry, top; data obtained from ()] and confirmation via Western blot (bottom), highlighting TKCC05 (orange; low active, high total FAK) and TKCC10 (purple; high active, low total FAK) cells. ( D to G ) Representative images (D and F) and quantification (E and G) (normalized cell number at >200-mum depth) of green fluorescent protein (GFP)-stained TKCC05 cells (D and E) and pan-cytokeratin-stained TKCC10 cells (F and G) invading into organotypic matrices primed with vehicle or FAKi (dotted line, 200-mum invasion depth). Scale bars, 50 mum. n = 3 biological repeats, 3 matrices per repeat, 3 FOVs per matrix. Results: means +- SEM. P values were determined using an ordinary one-way ANOVA with Tukey correction for multiple comparisons. Unless otherwise stated, all significance is compared to vehicle. ( H ) Timeline for TKCC05 and TKCC10 orthotopic studies. IVIS, In Vivo Imaging System. ( I to L ) Kaplan-Meier analysis of survival (I and K) and time to metastasis (J and L) in mice with TKCC05 (I and J) or TKCC10 (K and L) orthotopic tumors treated with vehicle/saline (TKCC05, n = 10;

- Submitted by
- Invitrogen Antibodies (provider)
- Main image
- Experimental details
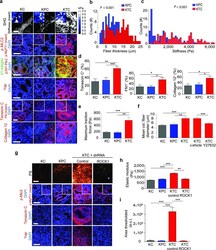
- Figure 2 PDAC genotype tunes epithelial tension to regulate fibrosis ( a ) SHG images from 20 week KC, KPC or KTC transgenic pancreatic tissues (top); Scale bar, 75 um. Force maps from AFM PDAC ECM (top insert). Immunofluorescence images of p-Mlc2, p-MyPT1 (insert), beta1-integrin and p-Ptk2, Yap1 and DAPI; Scale bar, 50 um. Tenascin C, Fibronectin (insert), Collagen type XII alpha1 and DAPI; Scale bar, 75 um. ( b ) Quantification of SHG fibril thickness and distribution around PDAC lesions. ( c ) Distribution of PDAC ECM stiffness measured by AFM. ( d ) Quantification of Tenascin C, Fibronectin and Collagen type XII alpha 1 images shown in (a). ( e ) Quantification of traction force KC, KPC and KTC cells on 2300 Pa polyacrylamide gels. ( f ) Quantification of mean collagen fiber diameter in three-dimensional collagen gels with KC, KPC or KTC cells or with KTC cells treated with vehicle or ROCK inhibitor Y27632 at 24 hours. ( g ) PR staining of tissue excised from nude mice 3 weeks after injection with KC, KPC, or KTC cells expressing either a control shRNA or an shRNA to Rock1 (top); Scale bar, 75 um. Immunofluorescence of p-Mlc2, p-MyPT1 (insert), Tenascin C, Yap1 and DAPI; Scale bar, 50 um. ( h ) Quantification of stiffness of tissue in (e). ( i ) Quantification of total levels of fibrillar collagen. For in vitro bar graphs, 3 technical replicates were performed and results are the mean +/- SEM of 3 independent experiments. For in vivo experiments, n = 5 mice per group. Su

- Submitted by
- Invitrogen Antibodies (provider)
- Main image

- Experimental details
- Figure 4 Tumor cell tension accelerates PDAC progression in mice ( a ) Cartoon of mouse manipulations used to study the impact of increasing pancreatic epithelial cell mechanosignaling using beta1-V737N on Kras-induced pancreatic malignancy. ( b ) Immunofluorescence images and quantification of pancreatic tissues from 3 month old KC and KC/beta1-V737N mice stained for p397-Ptk2 and p-Mlc2, Tenascin C, Yap1, p-Stat3; Scale bar, 50 um, CD68 and DAPI; Scale bar, 100 um. Polarized light images of PS staining; Scale bar, 75 um. Force maps of ECM stiffness. ( c ) Alcian blue H&E images of KC and KC/beta1-V737N tissue; Scale bar, 100um. ( d ) Quantification of histopathologic phenotypes present in KC and KC+beta1-V737N mice. ( e ) Polarized light images and quantification of PS staining of pancreatic tissues in nude mice injected with KTC tumor cells expressing either a control shRNA or a FAK shRNA; Scale bar, 75 um. Immunofluorescence images and quantification of Tenascin C (scale bar 75 um), Yap1 (75 um), p-Stat3 (scale bar, 25 um) and DAPI. ( f ) Quantification of average elastic modulus (Pa). For in vivo experiments, n = 5 mice per group. Subsequent statistical analysis was performed with unpaired two-sided student t-tests.. (* P < 0.05; ** P < 0.01, *** P < 0.001, **** P < 0.0001, ""ns"" not significant).

- Submitted by
- Invitrogen Antibodies (provider)
- Main image

- Experimental details
- Figure 5 Stat3 induces fibrosis and accelerates PDAC ( a ) Cartoon depicting the mouse crosses used for the activated Stat3C manipulations. ( b ) Immunofluorescence images and quantification of pancreatic tissues from 5 week old KC and KC/Stat3C mice stained for p-Stat3, scale bar, 75 um, p397-Ptk2 and p-Myl2, scale bar, 50 um, CD68, scale bar, 100 um, and DAPI. Polarized light images and quantification of PS staining; Scale bar, 75 um and H&E staining; Scale bar, 100 um. ( c ) Kaplan-Meier graph showing survival of KC and KC/Stat3C mice. ( d ) Quantification of ECM stiffness in (b). ( e ) Cartoon depicting the mouse crosses used for the Stat3 knock studies. ( f ) Immunofluorescence images and quantification of pancreatic tissues from 5 week old homozygous KTC (Control) and KTC+Stat3 -/- mice (KTC Stat3 -/- ) stained for p-Stat3, scale bar, 75 um, p397-Ptk2 and p-Myl2, scale bar, 50 um, Tenascin C, CD68, scale bar, 100 um, Yap1 scale bar, 50 um, and DAPI. Polarized light images and quantification of PS staining; Scale bar, 75 um, and H&E staining. Scale bar, 100 um. ( g ) Kaplan-Meier graph showing survival of KTC and KTC/Stat3 KO mice. ( h ) Quantification of ECM stiffness on tissue in (f). For in vivo experiments, n = 5 mice per group. Subsequent statistical analysis was performed with unpaired two-sided student t-tests. (* P < 0.05; ** P < 0.01, *** P < 0.001, **** P < 0.0001, ""ns"" not significant).
