 Explore
 Validate
 Learn
Learn Western blot
Antibody data
- Antibody Data
- Antigen structure
- References [48]
- Comments [0]
- Validations
- Western blot [1]
- Immunocytochemistry [1]
- Other assay [34]
Submit
Validation data
Reference
Comment
Report error
- Product number
- 44-626G - Provider product page

- Provider
- Invitrogen Antibodies
- Product name
- Phospho-FAK (Tyr861) Polyclonal Antibody
- Antibody type
- Polyclonal
- Antigen
- Synthetic peptide
- Description
- The antibody has been negatively preadsorbed using a non-phosphopeptide corresponding to the site of phosphorylation to remove antibody that is reactive with non-phosphorylated FAK. The final product is generated by affinity chromatography using a FAK-derived peptide that is phosphorylated at tyrosine 861.
Submitted references A Cas-BCAR3 co-regulatory circuit controls lamellipodia dynamics.
Phosphorylation of pericyte FAK-Y861 affects tumour cell apoptosis and tumour blood vessel regression.
A combined FAK, c-MET, and MST1R three-protein panel risk-stratifies colorectal cancer patients.
Neural crest cells bulldoze through the microenvironment using Aquaporin 1 to stabilize filopodia.
Lack of Myosin X Enhances Osteoclastogenesis and Increases Cell Surface Unc5b in Osteoclast-Lineage Cells.
The SRC Inhibitor Dasatinib Induces Stem Cell-Like Properties in Head and Neck Cancer Cells that are Effectively Counteracted by the Mithralog EC-8042.
Resistance to Src inhibition alters the BRAF-mutant tumor secretome to promote an invasive phenotype and therapeutic escape through a FAK>p130Cas>c-Jun signaling axis.
Treatment with Src inhibitor Dasatinib results in elevated metastatic potential in the 4T1 murine mammary carcinoma model.
Collagen abundance controls melanoma phenotypes through lineage-specific microenvironment sensing.
Src-mediated regulation of the PI3K pathway in advanced papillary and anaplastic thyroid cancer.
Sustained activation of the AKT/mTOR and MAP kinase pathways mediate resistance to the Src inhibitor, dasatinib, in thyroid cancer.
The fibronectin synergy site re-enforces cell adhesion and mediates a crosstalk between integrin classes.
AKT-mediated stabilization of histone methyltransferase WHSC1 promotes prostate cancer metastasis.
Imaging collective cell migration and hair cell regeneration in the sensory lateral line.
Src Family Kinases Modulate the Loss of Endothelial Barrier Function in Response to TNF-α: Crosstalk with p38 Signaling.
The microRNA-200/Zeb1 axis regulates ECM-dependent β1-integrin/FAK signaling, cancer cell invasion and metastasis through CRKL.
The anti-tumor NC1 domain of collagen XIX inhibits the FAK/ PI3K/Akt/mTOR signaling pathway through αvβ3 integrin interaction.
Angiopoietin 2 signaling plays a critical role in neural crest cell migration.
Influence of extracellular matrix components on the expression of integrins and regeneration of adult retinal ganglion cells.
A Monoclonal Antibody to ADAM17 Inhibits Tumor Growth by Inhibiting EGFR and Non-EGFR-Mediated Pathways.
Anti-metastatic action of FAK inhibitor OXA-11 in combination with VEGFR-2 signaling blockade in pancreatic neuroendocrine tumors.
Calcium-dependent FAK/CREB/TNNC1 signalling mediates the effect of stromal MFAP5 on ovarian cancer metastatic potential.
FAK is required for tension-dependent organization of collective cell movements in Xenopus mesendoderm.
Src inhibitors in suppression of papillary thyroid carcinoma growth.
Thrombospondin-4 controls matrix assembly during development and repair of myotendinous junctions.
The effects of neuregulin on cardiac Myosin light chain kinase gene-ablated hearts.
FAK-heterozygous mice display enhanced tumour angiogenesis.
Activation of endogenous FAK via expression of its amino terminal domain in Xenopus embryos.
LCB 03-0110, a novel pan-discoidin domain receptor/c-Src family tyrosine kinase inhibitor, suppresses scar formation by inhibiting fibroblast and macrophage activation.
A randomized phase II study of cilengitide (EMD 121974) in patients with metastatic melanoma.
PH006, a novel and selective Src kinase inhibitor, suppresses human breast cancer growth and metastasis in vitro and in vivo.
Nuclear and cytoplasmic LIMK1 enhances human breast cancer progression.
Cellular settings mediating Src Substrate switching between focal adhesion kinase tyrosine 861 and CUB-domain-containing protein 1 (CDCP1) tyrosine 734.
Phase I trial of a selective c-MET inhibitor ARQ 197 incorporating proof of mechanism pharmacodynamic studies.
The simian virus 40 large tumor antigen activates cSrc and requires cSrc for full neoplastic transformation.
Increased levels of active c-Src distinguish invasive from in situ lobular lesions.
Src inhibitors in early breast cancer: a methodology, feasibility and variability study.
Inhibition of Src with AZD0530 reveals the Src-Focal Adhesion kinase complex as a novel therapeutic target in papillary and anaplastic thyroid cancer.
Development of the post-natal growth plate requires intraflagellar transport proteins.
Postischemic gene transfer of soluble Flt-1 protects against brain ischemia with marked attenuation of blood-brain barrier permeability.
Analyzing FAK and Pyk2 in early integrin signaling events.
Tyrosine phosphorylation of VE-cadherin prevents binding of p120- and beta-catenin and maintains the cellular mesenchymal state.
Crk-associated substrate tyrosine phosphorylation sites are critical for invasion and metastasis of SRC-transformed cells.
Stat3 is required for full neoplastic transformation by the Simian Virus 40 large tumor antigen.
A selective small molecule inhibitor of c-Met kinase inhibits c-Met-dependent phenotypes in vitro and exhibits cytoreductive antitumor activity in vivo.
High RhoA activity maintains the undifferentiated mesenchymal cell phenotype, whereas RhoA down-regulation by laminin-2 induces smooth muscle myogenesis.
Regulation of the expression of c-Myc by beta1 integrins in epithelial cells.
FAK integrates growth-factor and integrin signals to promote cell migration.
Steenkiste EM, Berndt JD, Pilling C, Simpkins C, Cooper JA
eLife 2021 Jun 25;10
eLife 2021 Jun 25;10
Phosphorylation of pericyte FAK-Y861 affects tumour cell apoptosis and tumour blood vessel regression.
Lees DM, Reynolds LE, Pedrosa AR, Roy-Luzarraga M, Hodivala-Dilke KM
Angiogenesis 2021 Aug;24(3):471-482
Angiogenesis 2021 Aug;24(3):471-482
A combined FAK, c-MET, and MST1R three-protein panel risk-stratifies colorectal cancer patients.
Yoon JY, Wang JY, Roehrl MHA
Translational oncology 2020 Nov;13(11):100836
Translational oncology 2020 Nov;13(11):100836
Neural crest cells bulldoze through the microenvironment using Aquaporin 1 to stabilize filopodia.
McLennan R, McKinney MC, Teddy JM, Morrison JA, Kasemeier-Kulesa JC, Ridenour DA, Manthe CA, Giniunaite R, Robinson M, Baker RE, Maini PK, Kulesa PM
Development (Cambridge, England) 2020 Jan 9;147(1)
Development (Cambridge, England) 2020 Jan 9;147(1)
Lack of Myosin X Enhances Osteoclastogenesis and Increases Cell Surface Unc5b in Osteoclast-Lineage Cells.
Wang B, Pan JX, Yu H, Xiong L, Zhao K, Xiong S, Guo JP, Lin S, Sun D, Zhao L, Guo H, Mei L, Xiong WC
Journal of bone and mineral research : the official journal of the American Society for Bone and Mineral Research 2019 May;34(5):939-954
Journal of bone and mineral research : the official journal of the American Society for Bone and Mineral Research 2019 May;34(5):939-954
The SRC Inhibitor Dasatinib Induces Stem Cell-Like Properties in Head and Neck Cancer Cells that are Effectively Counteracted by the Mithralog EC-8042.
Hermida-Prado F, Villaronga MÁ, Granda-Díaz R, Del-Río-Ibisate N, Santos L, Hermosilla MA, Oro P, Allonca E, Agorreta J, Garmendia I, Tornín J, Perez-Escuredo J, Fuente R, Montuenga LM, Morís F, Rodrigo JP, Rodríguez R, García-Pedrero JM
Journal of clinical medicine 2019 Aug 2;8(8)
Journal of clinical medicine 2019 Aug 2;8(8)
Resistance to Src inhibition alters the BRAF-mutant tumor secretome to promote an invasive phenotype and therapeutic escape through a FAK>p130Cas>c-Jun signaling axis.
Kessler BE, Mishall KM, Kellett MD, Clark EG, Pugazhenthi U, Pozdeyev N, Kim J, Tan AC, Schweppe RE
Oncogene 2019 Apr;38(14):2565-2579
Oncogene 2019 Apr;38(14):2565-2579
Treatment with Src inhibitor Dasatinib results in elevated metastatic potential in the 4T1 murine mammary carcinoma model.
Hughes VS, Siemann DW
Tumor & microenvironment 2018;1(1):30-36
Tumor & microenvironment 2018;1(1):30-36
Collagen abundance controls melanoma phenotypes through lineage-specific microenvironment sensing.
Miskolczi Z, Smith MP, Rowling EJ, Ferguson J, Barriuso J, Wellbrock C
Oncogene 2018 Jun;37(23):3166-3182
Oncogene 2018 Jun;37(23):3166-3182
Src-mediated regulation of the PI3K pathway in advanced papillary and anaplastic thyroid cancer.
Beadnell TC, Nassar KW, Rose MM, Clark EG, Danysh BP, Hofmann MC, Pozdeyev N, Schweppe RE
Oncogenesis 2018 Feb 28;7(2):23
Oncogenesis 2018 Feb 28;7(2):23
Sustained activation of the AKT/mTOR and MAP kinase pathways mediate resistance to the Src inhibitor, dasatinib, in thyroid cancer.
Mishall KM, Beadnell TC, Kuenzi BM, Klimczak DM, Superti-Furga G, Rix U, Schweppe RE
Oncotarget 2017 Nov 28;8(61):103014-103031
Oncotarget 2017 Nov 28;8(61):103014-103031
The fibronectin synergy site re-enforces cell adhesion and mediates a crosstalk between integrin classes.
Benito-Jardón M, Klapproth S, Gimeno-LLuch I, Petzold T, Bharadwaj M, Müller DJ, Zuchtriegel G, Reichel CA, Costell M
eLife 2017 Jan 16;6
eLife 2017 Jan 16;6
AKT-mediated stabilization of histone methyltransferase WHSC1 promotes prostate cancer metastasis.
Li N, Xue W, Yuan H, Dong B, Ding Y, Liu Y, Jiang M, Kan S, Sun T, Ren J, Pan Q, Li X, Zhang P, Hu G, Wang Y, Wang X, Li Q, Qin J
The Journal of clinical investigation 2017 Apr 3;127(4):1284-1302
The Journal of clinical investigation 2017 Apr 3;127(4):1284-1302
Imaging collective cell migration and hair cell regeneration in the sensory lateral line.
Venero Galanternik M, Navajas Acedo J, Romero-Carvajal A, Piotrowski T
Methods in cell biology 2016;134:211-56
Methods in cell biology 2016;134:211-56
Src Family Kinases Modulate the Loss of Endothelial Barrier Function in Response to TNF-α: Crosstalk with p38 Signaling.
Adam AP, Lowery AM, Martino N, Alsaffar H, Vincent PA
PloS one 2016;11(9):e0161975
PloS one 2016;11(9):e0161975
The microRNA-200/Zeb1 axis regulates ECM-dependent β1-integrin/FAK signaling, cancer cell invasion and metastasis through CRKL.
Ungewiss C, Rizvi ZH, Roybal JD, Peng DH, Gold KA, Shin DH, Creighton CJ, Gibbons DL
Scientific reports 2016 Jan 5;6:18652
Scientific reports 2016 Jan 5;6:18652
The anti-tumor NC1 domain of collagen XIX inhibits the FAK/ PI3K/Akt/mTOR signaling pathway through αvβ3 integrin interaction.
Oudart JB, Doué M, Vautrin A, Brassart B, Sellier C, Dupont-Deshorgue A, Monboisse JC, Maquart FX, Brassart-Pasco S, Ramont L
Oncotarget 2016 Jan 12;7(2):1516-28
Oncotarget 2016 Jan 12;7(2):1516-28
Angiopoietin 2 signaling plays a critical role in neural crest cell migration.
McKinney MC, McLennan R, Kulesa PM
BMC biology 2016 Dec 15;14(1):111
BMC biology 2016 Dec 15;14(1):111
Influence of extracellular matrix components on the expression of integrins and regeneration of adult retinal ganglion cells.
Vecino E, Heller JP, Veiga-Crespo P, Martin KR, Fawcett JW
PloS one 2015;10(5):e0125250
PloS one 2015;10(5):e0125250
A Monoclonal Antibody to ADAM17 Inhibits Tumor Growth by Inhibiting EGFR and Non-EGFR-Mediated Pathways.
Rios-Doria J, Sabol D, Chesebrough J, Stewart D, Xu L, Tammali R, Cheng L, Du Q, Schifferli K, Rothstein R, Leow CC, Heidbrink-Thompson J, Jin X, Gao C, Friedman J, Wilkinson B, Damschroder M, Pierce AJ, Hollingsworth RE, Tice DA, Michelotti EF
Molecular cancer therapeutics 2015 Jul;14(7):1637-49
Molecular cancer therapeutics 2015 Jul;14(7):1637-49
Anti-metastatic action of FAK inhibitor OXA-11 in combination with VEGFR-2 signaling blockade in pancreatic neuroendocrine tumors.
Moen I, Gebre M, Alonso-Camino V, Chen D, Epstein D, McDonald DM
Clinical & experimental metastasis 2015 Dec;32(8):799-817
Clinical & experimental metastasis 2015 Dec;32(8):799-817
Calcium-dependent FAK/CREB/TNNC1 signalling mediates the effect of stromal MFAP5 on ovarian cancer metastatic potential.
Leung CS, Yeung TL, Yip KP, Pradeep S, Balasubramanian L, Liu J, Wong KK, Mangala LS, Armaiz-Pena GN, Lopez-Berestein G, Sood AK, Birrer MJ, Mok SC
Nature communications 2014 Oct 3;5:5092
Nature communications 2014 Oct 3;5:5092
FAK is required for tension-dependent organization of collective cell movements in Xenopus mesendoderm.
Bjerke MA, Dzamba BJ, Wang C, DeSimone DW
Developmental biology 2014 Oct 15;394(2):340-56
Developmental biology 2014 Oct 15;394(2):340-56
Src inhibitors in suppression of papillary thyroid carcinoma growth.
Henderson YC, Toro-Serra R, Chen Y, Ryu J, Frederick MJ, Zhou G, Gallick GE, Lai SY, Clayman GL
Head & neck 2014 Mar;36(3):375-84
Head & neck 2014 Mar;36(3):375-84
Thrombospondin-4 controls matrix assembly during development and repair of myotendinous junctions.
Subramanian A, Schilling TF
eLife 2014 Jun 18;3
eLife 2014 Jun 18;3
The effects of neuregulin on cardiac Myosin light chain kinase gene-ablated hearts.
Chang AN, Huang J, Battiprolu PK, Hill JA, Kamm KE, Stull JT
PloS one 2013;8(6):e66720
PloS one 2013;8(6):e66720
FAK-heterozygous mice display enhanced tumour angiogenesis.
Kostourou V, Lechertier T, Reynolds LE, Lees DM, Baker M, Jones DT, Tavora B, Ramjaun AR, Birdsey GM, Robinson SD, Parsons M, Randi AM, Hart IR, Hodivala-Dilke K
Nature communications 2013;4:2020
Nature communications 2013;4:2020
Activation of endogenous FAK via expression of its amino terminal domain in Xenopus embryos.
Petridou NI, Stylianou P, Christodoulou N, Rhoads D, Guan JL, Skourides PA
PloS one 2012;7(8):e42577
PloS one 2012;7(8):e42577
LCB 03-0110, a novel pan-discoidin domain receptor/c-Src family tyrosine kinase inhibitor, suppresses scar formation by inhibiting fibroblast and macrophage activation.
Sun X, Phan TN, Jung SH, Kim SY, Cho JU, Lee H, Woo SH, Park TK, Yang BS
The Journal of pharmacology and experimental therapeutics 2012 Mar;340(3):510-9
The Journal of pharmacology and experimental therapeutics 2012 Mar;340(3):510-9
A randomized phase II study of cilengitide (EMD 121974) in patients with metastatic melanoma.
Kim KB, Prieto V, Joseph RW, Diwan AH, Gallick GE, Papadopoulos NE, Bedikian AY, Camacho LH, Hwu P, Ng CS, Wei W, Johnson MM, Wittemer SM, Vardeleon A, Reckeweg A, Colevas AD
Melanoma research 2012 Aug;22(4):294-301
Melanoma research 2012 Aug;22(4):294-301
PH006, a novel and selective Src kinase inhibitor, suppresses human breast cancer growth and metastasis in vitro and in vivo.
Ma JG, Huang H, Chen SM, Chen Y, Xin XL, Lin LP, Ding J, Liu H, Meng LH
Breast cancer research and treatment 2011 Nov;130(1):85-96
Breast cancer research and treatment 2011 Nov;130(1):85-96
Nuclear and cytoplasmic LIMK1 enhances human breast cancer progression.
McConnell BV, Koto K, Gutierrez-Hartmann A
Molecular cancer 2011 Jun 18;10:75
Molecular cancer 2011 Jun 18;10:75
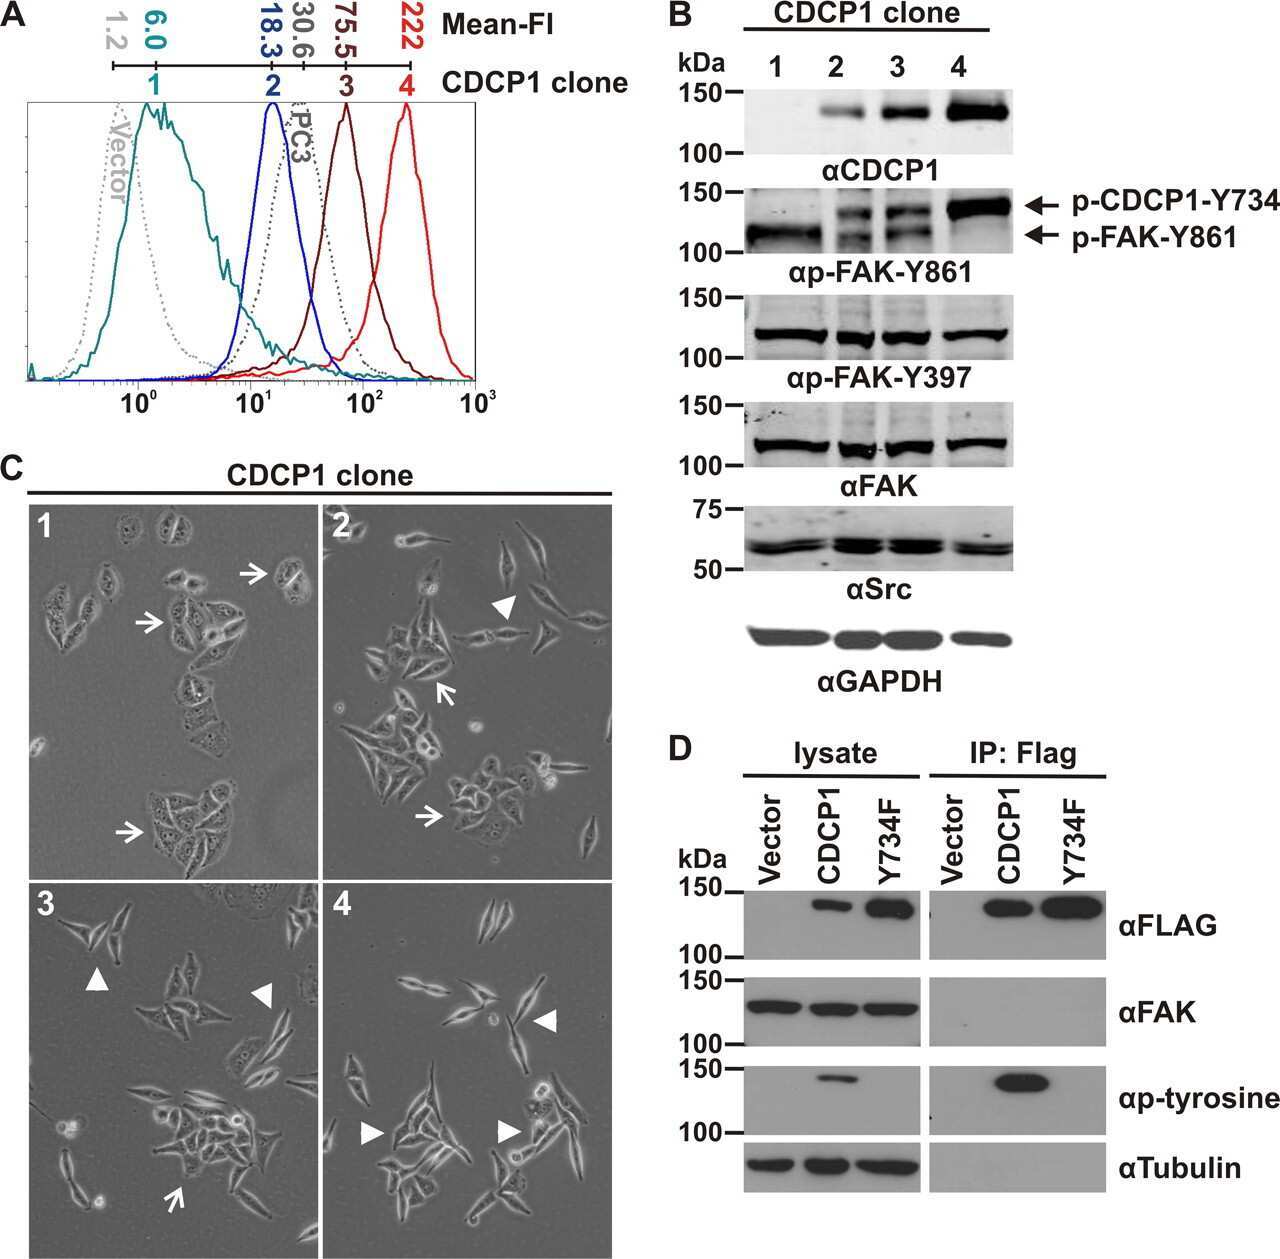
Cellular settings mediating Src Substrate switching between focal adhesion kinase tyrosine 861 and CUB-domain-containing protein 1 (CDCP1) tyrosine 734.
Wortmann A, He Y, Christensen ME, Linn M, Lumley JW, Pollock PM, Waterhouse NJ, Hooper JD
The Journal of biological chemistry 2011 Dec 9;286(49):42303-42315
The Journal of biological chemistry 2011 Dec 9;286(49):42303-42315
Phase I trial of a selective c-MET inhibitor ARQ 197 incorporating proof of mechanism pharmacodynamic studies.
Yap TA, Olmos D, Brunetto AT, Tunariu N, Barriuso J, Riisnaes R, Pope L, Clark J, Futreal A, Germuska M, Collins D, deSouza NM, Leach MO, Savage RE, Waghorne C, Chai F, Garmey E, Schwartz B, Kaye SB, de Bono JS
Journal of clinical oncology : official journal of the American Society of Clinical Oncology 2011 Apr 1;29(10):1271-9
Journal of clinical oncology : official journal of the American Society of Clinical Oncology 2011 Apr 1;29(10):1271-9
The simian virus 40 large tumor antigen activates cSrc and requires cSrc for full neoplastic transformation.
Arulanandam R, Geletu M, Raptis L
Anticancer research 2010 Jan;30(1):47-53
Anticancer research 2010 Jan;30(1):47-53
Increased levels of active c-Src distinguish invasive from in situ lobular lesions.
Zou D, Yoon HS, Anjomshoaa A, Perez D, Fukuzawa R, Guilford P, Humar B
Breast cancer research : BCR 2009;11(4):R45
Breast cancer research : BCR 2009;11(4):R45
Src inhibitors in early breast cancer: a methodology, feasibility and variability study.
Jones RJ, Young O, Renshaw L, Jacobs V, Fennell M, Marshall A, Green TP, Elvin P, Womack C, Clack G, Dixon JM
Breast cancer research and treatment 2009 Mar;114(2):211-21
Breast cancer research and treatment 2009 Mar;114(2):211-21
Inhibition of Src with AZD0530 reveals the Src-Focal Adhesion kinase complex as a novel therapeutic target in papillary and anaplastic thyroid cancer.
Schweppe RE, Kerege AA, French JD, Sharma V, Grzywa RL, Haugen BR
The Journal of clinical endocrinology and metabolism 2009 Jun;94(6):2199-203
The Journal of clinical endocrinology and metabolism 2009 Jun;94(6):2199-203
Development of the post-natal growth plate requires intraflagellar transport proteins.
Song B, Haycraft CJ, Seo HS, Yoder BK, Serra R
Developmental biology 2007 May 1;305(1):202-16
Developmental biology 2007 May 1;305(1):202-16
Postischemic gene transfer of soluble Flt-1 protects against brain ischemia with marked attenuation of blood-brain barrier permeability.
Kumai Y, Ooboshi H, Ibayashi S, Ishikawa E, Sugimori H, Kamouchi M, Kitazono T, Egashira K, Iida M
Journal of cerebral blood flow and metabolism : official journal of the International Society of Cerebral Blood Flow and Metabolism 2007 Jun;27(6):1152-60
Journal of cerebral blood flow and metabolism : official journal of the International Society of Cerebral Blood Flow and Metabolism 2007 Jun;27(6):1152-60
Analyzing FAK and Pyk2 in early integrin signaling events.
Bernard-Trifilo JA, Lim ST, Hou S, Schlaepfer DD, Ilic D
Current protocols in cell biology 2006 Apr;Chapter 14:Unit 14.7
Current protocols in cell biology 2006 Apr;Chapter 14:Unit 14.7
Tyrosine phosphorylation of VE-cadherin prevents binding of p120- and beta-catenin and maintains the cellular mesenchymal state.
Potter MD, Barbero S, Cheresh DA
The Journal of biological chemistry 2005 Sep 9;280(36):31906-12
The Journal of biological chemistry 2005 Sep 9;280(36):31906-12
Crk-associated substrate tyrosine phosphorylation sites are critical for invasion and metastasis of SRC-transformed cells.
Brábek J, Constancio SS, Siesser PF, Shin NY, Pozzi A, Hanks SK
Molecular cancer research : MCR 2005 Jun;3(6):307-15
Molecular cancer research : MCR 2005 Jun;3(6):307-15
Stat3 is required for full neoplastic transformation by the Simian Virus 40 large tumor antigen.
Vultur A, Arulanandam R, Turkson J, Niu G, Jove R, Raptis L
Molecular biology of the cell 2005 Aug;16(8):3832-46
Molecular biology of the cell 2005 Aug;16(8):3832-46
A selective small molecule inhibitor of c-Met kinase inhibits c-Met-dependent phenotypes in vitro and exhibits cytoreductive antitumor activity in vivo.
Christensen JG, Schreck R, Burrows J, Kuruganti P, Chan E, Le P, Chen J, Wang X, Ruslim L, Blake R, Lipson KE, Ramphal J, Do S, Cui JJ, Cherrington JM, Mendel DB
Cancer research 2003 Nov 1;63(21):7345-55
Cancer research 2003 Nov 1;63(21):7345-55
High RhoA activity maintains the undifferentiated mesenchymal cell phenotype, whereas RhoA down-regulation by laminin-2 induces smooth muscle myogenesis.
Beqaj S, Jakkaraju S, Mattingly RR, Pan D, Schuger L
The Journal of cell biology 2002 Mar 4;156(5):893-903
The Journal of cell biology 2002 Mar 4;156(5):893-903
Regulation of the expression of c-Myc by beta1 integrins in epithelial cells.
Benaud CM, Dickson RB
Oncogene 2001 Feb 8;20(6):759-68
Oncogene 2001 Feb 8;20(6):759-68
FAK integrates growth-factor and integrin signals to promote cell migration.
Sieg DJ, Hauck CR, Ilic D, Klingbeil CK, Schaefer E, Damsky CH, Schlaepfer DD
Nature cell biology 2000 May;2(5):249-56
Nature cell biology 2000 May;2(5):249-56
No comments: Submit comment
Supportive validation
- Submitted by
- Invitrogen Antibodies (provider)
- Main image
- Experimental details
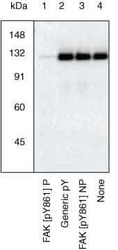
- Upregulation and Antibody-Peptide Competition. Extracts of 3T3-L1 cells unstimulated or stimulated with 50 ng/mL LIF for 15 minutes (2-4) were resolved by SDS-PAGE on a 10% Tris-glycine gel and transferred to PVDF. The membrane was blocked with a 5% BSA-TBST buffer overnight at 4°C, then incubated with the JAK2 (pYpY1007/1008) antibody for two hours at room temperature in a 1% BSA-TBST buffer, following prior incubation with: no peptide (1, 2), the non-phosphopeptide corresponding to the phosphopeptide immunogen (3), or the phosphopeptide immunogen (4). After washing, the membrane was incubated with goat F (ab')2 anti-rabbit IgG HRP-conjugate and signals were detected using the Pierce SuperSignal™ method. The data show that only the phosphopeptide corresponding to JAK2 (pYpY1007/1008) blocks the antibody signal, demonstrating the specificity of the antibody. The data also show the up-regulation of JAK2 (pYpY1007/1008) with LIF treatment in this cell system. (Product # 44-626G).

Supportive validation
- Submitted by
- Invitrogen Antibodies (provider)
- Main image

- Experimental details
- Immunofluorescence analysis of Phospho-FAK (Tyr861) was done on 70% confluent log phase A549 cells. The cells were fixed with 4% paraformaldehyde for 15 minutes, permeabilized with 0.25% Triton™ X-100 for 10 minutes, and blocked with 5% BSA for 1 hour at room temperature. The cells were labeled with Phospho-FAK (Tyr861) Rabbit Polyclonal Antibody (Product # 44-626G) at 1:250 dilution in 1% BSA and incubated for 3 hours at room temperature and then labeled with Goat anti-Rabbit IgG (H+L) Superclonal™ Secondary Antibody, Alexa Fluor® 488 conjugate (Product # A27034) at a dilution of 1:2000 for 45 minutes at room temperature (Panel a: green). Nuclei (Panel b: blue) were stained with SlowFade® Gold Antifade Mountant with DAPI (Product # S36938). F-actin (Panel c: red) was stained with Alexa Fluor® 555 Rhodamine Phalloidin (Product # R415, 1:300). Panel d is a merged image showing Cell Junctional localization. Panel e is a no primary antibody control. The images were captured at 60X magnification.

Supportive validation
- Submitted by
- Invitrogen Antibodies (provider)
- Main image

- Experimental details
- NULL

- Submitted by
- Invitrogen Antibodies (provider)
- Main image

- Experimental details
- NULL

- Submitted by
- Invitrogen Antibodies (provider)
- Main image

- Experimental details
- NULL

- Submitted by
- Invitrogen Antibodies (provider)
- Main image

- Experimental details
- NULL

- Submitted by
- Invitrogen Antibodies (provider)
- Main image

- Experimental details
- NULL

- Submitted by
- Invitrogen Antibodies (provider)
- Main image

- Experimental details
- NULL

- Submitted by
- Invitrogen Antibodies (provider)
- Main image

- Experimental details
- NULL

- Submitted by
- Invitrogen Antibodies (provider)
- Main image

- Experimental details
- NULL

- Submitted by
- Invitrogen Antibodies (provider)
- Main image
- Experimental details
- NULL
- Submitted by
- Invitrogen Antibodies (provider)
- Main image

- Experimental details
- NULL

- Submitted by
- Invitrogen Antibodies (provider)
- Main image

- Experimental details
- NULL
- Submitted by
- Invitrogen Antibodies (provider)
- Main image

- Experimental details
- NULL

- Submitted by
- Invitrogen Antibodies (provider)
- Main image

- Experimental details
- NULL

- Submitted by
- Invitrogen Antibodies (provider)
- Main image

- Experimental details
- NULL

- Submitted by
- Invitrogen Antibodies (provider)
- Main image

- Experimental details
- Fig. 1 Mechanosignalling regulates melanoma cell adhesion and nuclear YAP/TAZ localization. a Morphology of 501mel and WM266-4 cells cultured for 72 h on collagen with the indicated stiffness degrees. A scale for matrix elasticity of tissues is shown varying from soft brain to rigid bone (adapted from [ 18 ]). Scale bar represents 20 um. b Quantification of cell morphology of 501mel and WM266-4 cells cultured for 72 h on collagen with the indicated stiffness degrees ( n = 3 experiments; n = 100 cells). Graphs show mean +- SEM. Tukey's post-test following one-way ANOVA. * p < 0.05, ** p < 0.01, *** p < 0.001. c Western blot analysis of pFAK, pSRC and pMLC2 of 501mel and WM266-4 cells cultured on collagen with the indicated stiffness degrees for 72 h. Total SRC, FAK and ERK2 was used as a loading control. d Immunofluorescence analysis of YAP/TAZ localization in 501mel cells cultured on collagen with the indicated stiffness degrees for 72 h. Scale bar represents 50 um. e Quantification of YAP/TAZ localization in 501mel and WM266-4 cells cultured on collagen with the indicated stiffness degrees for 72 h ( n = 3 experiments; n = 100 cells). f Western blot for LATS and YAP phosphorylation in 501mel cells cultured on collagen with the indicated stiffness degrees for 72 h. g Quantification of YAP/TAZ localization in 501mel cells cultured on collagen with the indicated stiffness degrees treated with 1 muM AZD0530 (SRCi), 1 muM PF562271 (FAKi) or DMSO for 24 h ( n = 3 experiments; n =

- Submitted by
- Invitrogen Antibodies (provider)
- Main image
- Experimental details
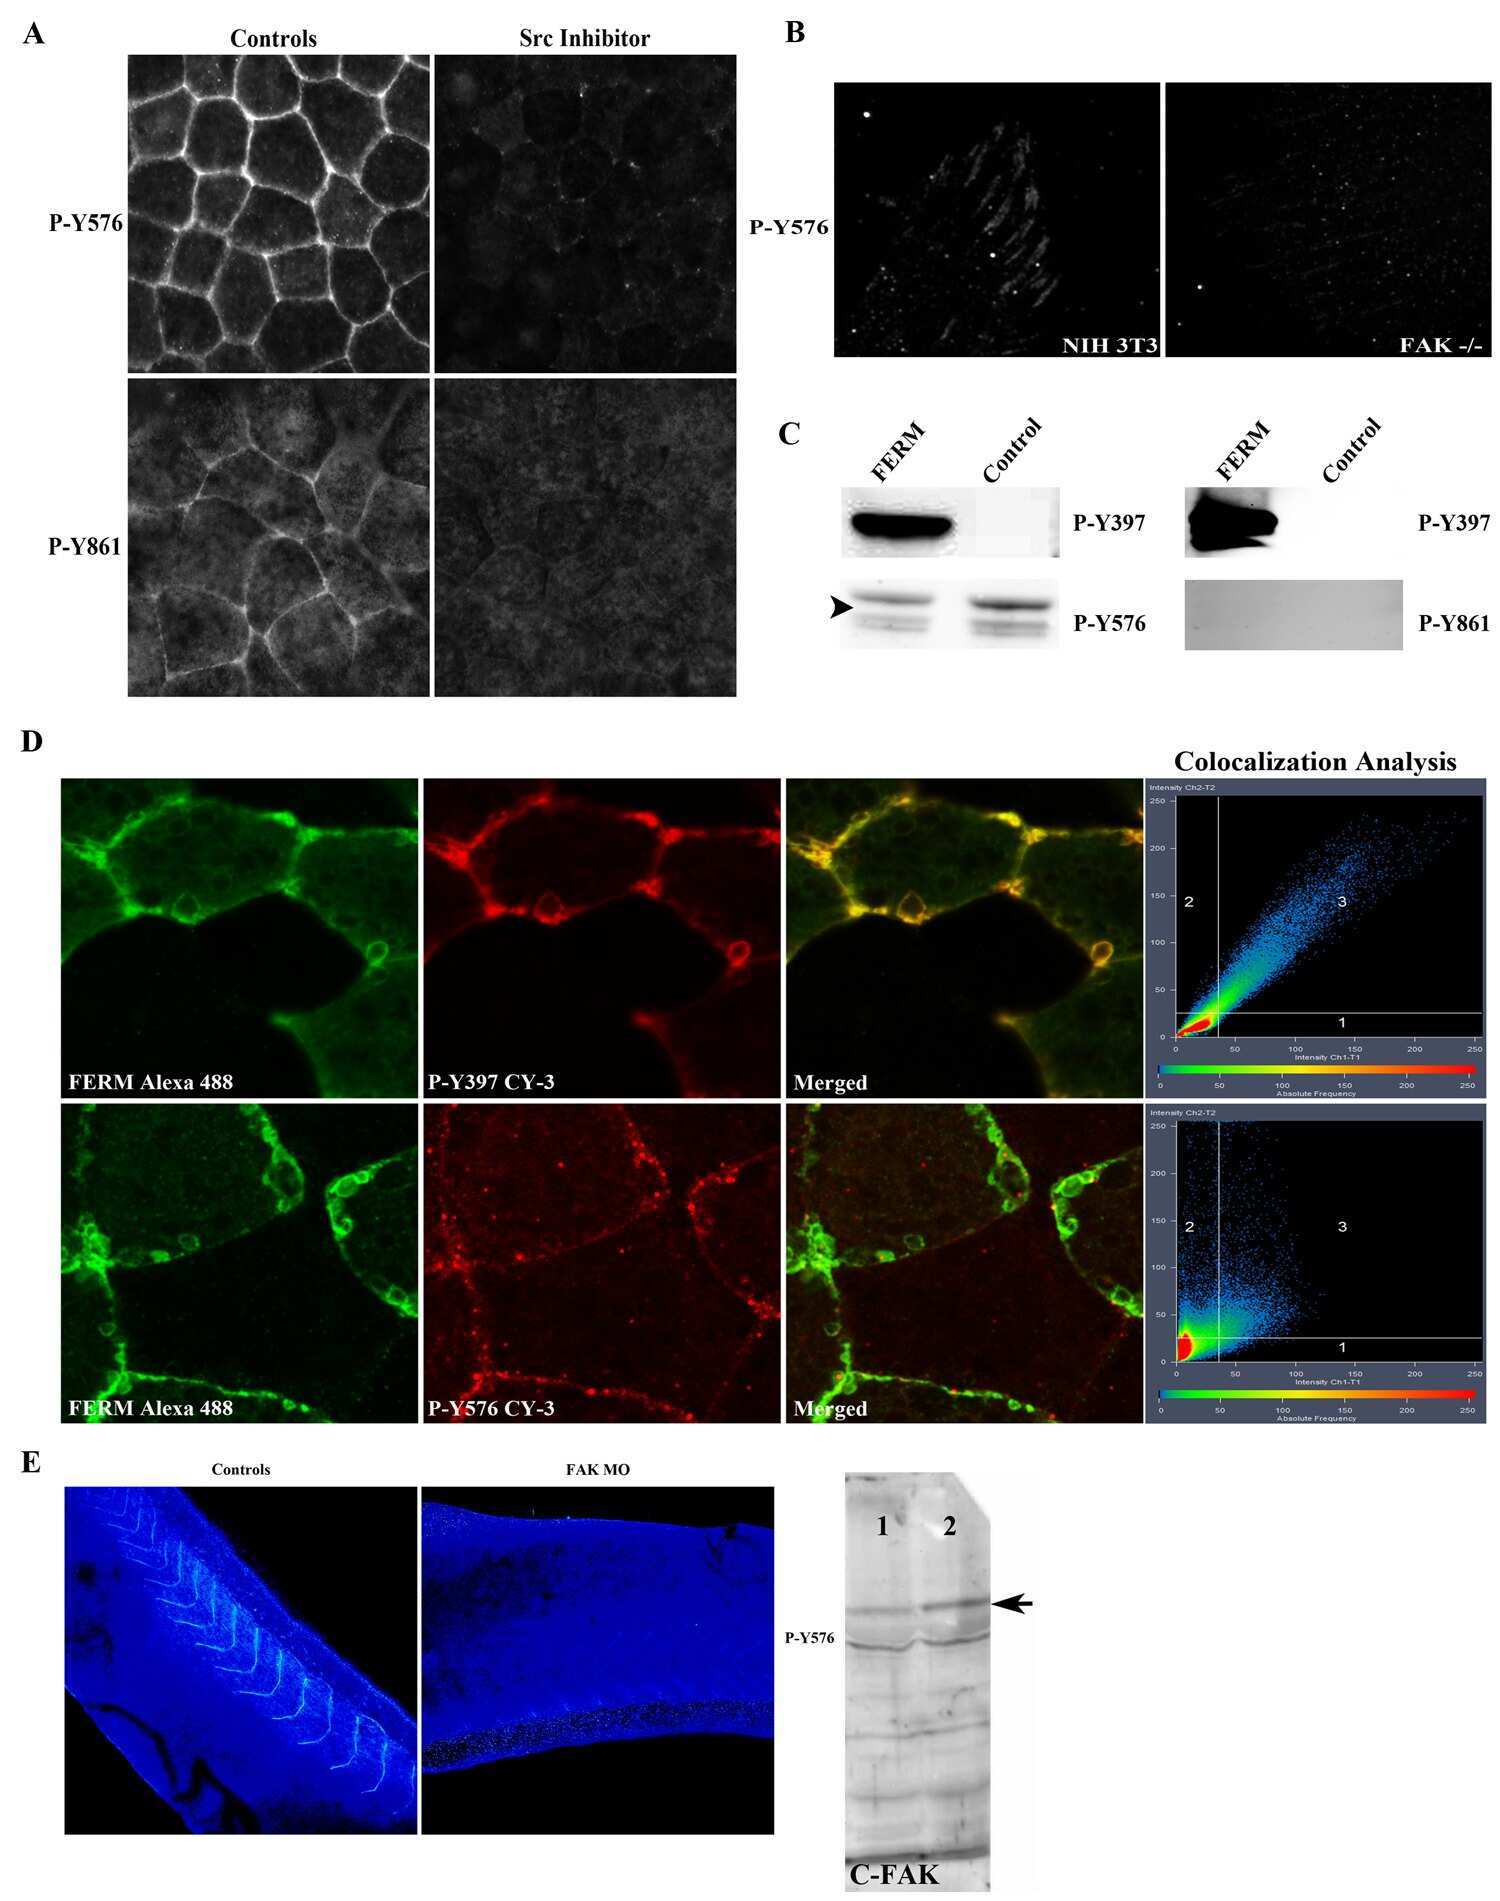
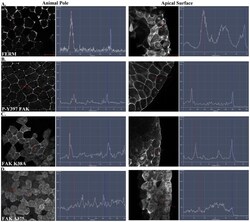
- Figure 4 The FERM domain is necessary and sufficient for membrane localization of FAK at integrin-free regions. Confocal images and intensity profiles of the indicated constructs after whole mount immunostaining. The first column are top views of superficial cells of the animal cap in intact embryos and the second column are views from sagittally sectioned embryos that reveal the localization of each construct on the apical surface of superficial cells. Apical region of superficial blastomeres is to the right. (A) The FERM domain shows strong plasma membrane localization in the top view and is strongly localized to the apical surface. (B) Endogenous phosphorylated FAK shows very strong plasma membrane localization in the top view and is localized on the basolateral and apical surface of the cell. (C) Full length FAK with the point mutation K38A exhibits strong membrane localization. (D) Deletion of the FERM domain (HA-Delta375 FAK construct) abolishes the plasma membrane localization of FAK. Scale bars: 25 um.

- Submitted by
- Invitrogen Antibodies (provider)
- Main image

- Experimental details
- Figure 4 GFP-LIMK1 fusions increase phosphorylation status of FAK signaling components . (A) Western blot analysis of whole cell lysates from MDA-MB-231 stable transductants probed with antibodies against pFAK, total FAK, pPaxillin, total Paxillin, pSrc, total Src, pAKT, total AKT, pErk1/2 and total Erk 1/2. (B) Western blot analysis for tubulin or GAPDH for each extract used in panel A, as loading controls.

- Submitted by
- Invitrogen Antibodies (provider)
- Main image

- Experimental details
- Figure 4. Tsp4b is required for muscle-specific integrin signaling at MTJ. ( A - F ) Lateral views of 20-24 hpf embryos stained with anti-phosphorylated (Tyrosine 861) FAK (pFAK; red) and anti-MHC (green). ( A and B ) pFAK localizes to the ends of early myofibers at wild-type somite boundaries. ( C and D ) Reduced pFAK levels in Tsp4b-deficient embryos. ( E and F ) pFAK levels are restored in Tsp4b-deficient embryos injected with full length tsp4b mRNA. ( G ) Fluorescence intensity measurements (arbitrary units [A.U.]) for pFAK staining along somite boundaries confirm significant reductions in Tsp4b-deficient embryos, and partial rescue by co-injection of full length tsp4b mRNA ( t test: one tailed, unequal variance; p-value: wt and tsp4b-deficient

- Submitted by
- Invitrogen Antibodies (provider)
- Main image

- Experimental details
- Figure 6 Western blot analysis of key signaling molecules implicated in calcium-dependent pathways and TNNC1 transcriptional regulation. Western blot analyses on proteins isolated from MFAP5-treated A224 and ALST ovarian cancer cells showed that, ( A ) Treatment of exogenous MFAP5 increased p-FAK (Y861), p-PLC-gamma1 (Y783), p-PKCtheta (T538), p-ERK1/2 (T202/Y204), p-CREB (S133), total Jun, and p-Jun (S63, S73 and S243) expressions in A224 ovarian cancer cells. ( B ) Treatment of exogenous MFAP5 increased p-FAK (Y861), p-PLC-gamma1 (Y783), p-PKCtheta (T538), p-ERK1/2 (T202/Y204), p-CREB (S133), total Jun, and p-Jun (S63, S73 and S243) expressions in ALST ovarian cancer cells. Relative normalized protein expression levels with respect to the corresponding control were presented. ( C ) A graphical summary of the molecular signaling events involved in MFAP5-mediated ovarian cancer cell motility and invasiveness. ( D ) The presences of FAK, ERK or CBP/CREB interaction inhibitors abrogated the motility promoting effects of MFAP5 in both A224 and ALST ovarian cancer cells (mean +- SD of 3 independent experiments; p < 0.001; two-tailed Student t -test).

- Submitted by
- Invitrogen Antibodies (provider)
- Main image

- Experimental details
- Figure 5 Kinetic analysis of FAK, PI3K p85 subunit of PI3 kinase and PDK1 phosphorylation in SK-MEL-28 melanoma cells after incubation with NC1(XIX) Western blot analysis of: ( A ) phosphorylated-FAK Y397 , ( B ) phosphorylated-FAK Y861 , ( C ) phosphorylated-PI3K p85 Y458 and ( D ) phosphorylated-PDK1 S241 compared to total FAK, total PI3K p85 and total PDK1 expression respectively after incubation of SK-MEL-28 melanoma cells with NC1(XIX) for 0, 1, 5, 15, 30 and 60 min. Bands were quantified by densitometric analysis. Phosphorylated protein was reported to corresponding total protein.

- Submitted by
- Invitrogen Antibodies (provider)
- Main image

- Experimental details
- Figure 3 Integrin beta1 is required for the invasion & metastasis of the murine mesenchymal cell lines. ( a ) Western blot analysis of FAK pathway activation in the mesenchymal vs epithelial cells lines of the murine cell line panel, and in cell lines stably expressing Zeb1 ( b ). ( c ) Western blot of FAK activation in the human H157 cells with inducible miR-200ab expression. ( d ) 393P_ZEB1 cells grown in Matrigel/Collagen I (1.75 mg/ml) and treated with an ITGbeta1-blocking antibody or IgM control for 7 days. ( e ) Quantitative RT-PCR and Western blot of 393P_ZEB1 cells after ITGbeta1-shRNA knockdown. ( f ) In vitro migration and invasion assay for the Itgbeta1 shRNA cells. *p < 0.02, **p < 0.002, ***p

- Submitted by
- Invitrogen Antibodies (provider)
- Main image

- Experimental details
- Figure 5 CRKL regulates FAK/Src complex formation at focal adhesions and the invasive/metastatic phenotype. ( a ) qRT-PCR and Western blot ( b ) analysis of 344SQ_shCRKL knockdown cells showed a decrease in FAK signaling. ( c ) CRKL knockdown decreased adhesion to fibronectin and 2D Transwell migration/invasion ( d ). ( e ) Immunofluorescent staining and biochemical fractionation ( f ) of CRKL knockdown cells for activated Src Y 418 , CRKL Y 207 , PaxY 118 , and p-FAK Y 861 in the focal adhesion complex at the membrane. An average of 20-30 cells was counted for the presence of focal adhesions and data are presented per cell. Scale bar is 200 mum. *p < 0.005, **p

- Submitted by
- Invitrogen Antibodies (provider)
- Main image

- Experimental details
- Fig. 7 Gain and loss of Ang2 in neural crest cultures affects the amount of phosphorylated FAK. Neural tubes electroporated with either a GFP control vector ( a ), Ang2-FL ( b ), or Ang2-shRNA ( c ) were plated on fibronectin/poly- l -lysine coated glass and allowed to grow for 24 h. Electroporated vector in blue . The cultures were then stained with HNK1 ( red ) and pFAK ( green ) antibodies. Scale bars 50 mum. Inset images in a , b , and c : individual filopodia in the pFAK channel showing the size measurement. Scale bar 3 mum. d The average pFAK cluster size. Each cluster of pFAK was individually measured by the spot detection algorithm (Imaris) based on the fluorescence in the pFAK channel, so thousands of clusters were used to calculate the average, SEM, and comparison between conditions. Control 4 neural tubes and n = 4179 pFAK clusters, Ang2-FL 4 neural tubes and n = 3182 pFAK clusters, 4 neural tubes and Ang2-shRNA n = 3298 pFAK clusters. All conditions are statistically different from each other with control vs. Ang2-FL p = 1 x 10 -22 , control vs. Ang2-shRNA p = 5 x 10 -85 , and Ang2-FL vs. Ang2-shRNA p = 1 x 10 -132

- Submitted by
- Invitrogen Antibodies (provider)
- Main image
- Experimental details
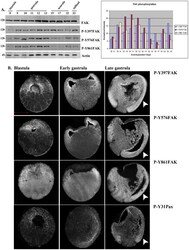
- Figure 1 FAK expression and phosphorylation during development. (A) Western Blots from extracts of equal numbers of embryos probed with a monoclonal antibody against the C-terminus of FAK or polyclonal antibodies against the phosphorylated tyrosine residues indicated. FAK is phosphorylated on all three residues both before and after gastrulation. The intensity values from the densitometry analysis of the western blots were normalized against total FAK amount. (B) Blastula (1 st column), early gastrula (2 nd column) and late gastrula embryos (3 rd column) stained with P-Y397, P-Y576, P-Y861 and P-Y31paxillin antibodies as indicated. Phosphorylated FAK and paxillin can be detected on the plasma membrane from early blastula stages including the apical region of superficial blastomeres. During gastrulation elevated levels of phosphorylation are detected in the highly morphogenetic mesodermal tissues (white arrowheads). Scale bar: 400 um.

- Submitted by
- Invitrogen Antibodies (provider)
- Main image
- Experimental details
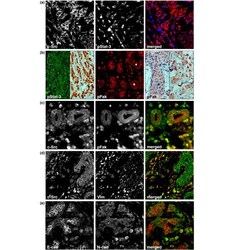
- Figure 4 The correlation of c-Src activity with an EMT. (a) Nuclear pStat-3 (blue) in invasive lobular carcinoma (ILC) cells with activated c-Src (red). Note the weak nuclear Stat-3 staining in lobular carcinoma in situ (LCIS; asterisk). An antibody against total Stat-3 was used as a control. (b) Left panel: widespread Stat-3 activation in ILC cells. Middle panel: increased levels of activated Fak in ILC cells surrounding nonneoplastic epithelium and LCIS (asterisks). Right panel: expression of pFak in LCIS (asterisk) and ILC (right). An antibody against total Fak was used as a control. (c) Colocalization of active c-Src (green) and active Fak (red) in ILC cells. (d) ILC cells with activated c-Src (green) are positive for the mesenchymal marker vimentin (red). (e) Expression of the mesenchymal N-cadherin (green) in a subset of invasive cancer cells.

- Submitted by
- Invitrogen Antibodies (provider)
- Main image

- Experimental details
- Figure 5 LIMK1 expression correlates with phosphorylation of FAK in focal adhesions of MDA-MB-231 cells . MDA-MB-231 cells expressing GFP-only or various GFP-LIMK1 fusions were fixed and stained with antibodies against phospho-FAK (red), and phalloidin against actin (gold). GFP fluorescence is green in this figure. Images were obtained via fluorescence microscopy (non-confocal). Cellular regions with focal adhesion structures are marked by white arrows in the phospho-FAK images. Scale bar represents 20 microns. Note: non-specific binding of secondary antibody stains nuclei red.

- Submitted by
- Invitrogen Antibodies (provider)
- Main image
- Experimental details
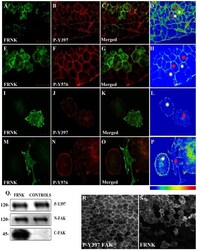
- Figure 3 FRNK does not act as a dominant negative in early Xenopus embryos. (A-D) Optical sections of whole mount immunostained embryos injected with 1 ng GFP-FRNK at the two dorsal blastomeres at the four-cell stage. Embryos were stained with anti-GFP (A) and anti-P-Y397 (B). C is the merged image and D an intensity color coded image of the anti-P-Y397 signal. FRNK injected cells are indicated with red stars and control cells with white stars. FRNK expression fails to reduce the phosphorylation levels of endogenous FAK on tyrosine 397. (E-H) Same as A-D, but the embryos were stained with anti-GFP (E) and anti-P-Y576 (F). FRNK expressing cells display similar levels of phosphorylation on tyrosine 576 as neighboring control cells. (I-L) Confocal images of A6 Xenopus cells transfected with GFP-FRNK. Cells were stained with anti-GFP (I) and anti-P-Y397 (J). K is the merged image and L an intensity color coded image of the anti-P-Y397 signal. FRNK expression leads to reduction of the phosphorylation levels of FAK on tyrosine 397 at the focal adhesions. (M-P) Same as I-L but the cells were stained with anti-GFP (M) and anti-P-Y576 (N) antibodies. FRNK expression leads to downregulation of the endogenous phosphorylation levels of FAK on tyrosine 576 at the focal adhesions. (Q) Western blot analysis of control and injected gastrula stage embryos with 1 ng FRNK at the animal pole of both blastomeres of two cell stage embryos. FRNK expression fails to reduce endogenous FAK phosphoryla

- Submitted by
- Invitrogen Antibodies (provider)
- Main image

- Experimental details
- Figure 3 Effects of vehicle and neuregulin treatment on selected kinases . A-D) Quantitation of phosphorylated proteins compared with respective total protein or GAPDH for each treatment group is shown. Sample number is indicated within each bar. Significance was determined by 1-way ANOVA and Newman-Keuls multiple comparison test using GraphPad software. ** P

- Submitted by
- Invitrogen Antibodies (provider)
- Main image

- Experimental details
- Figure 1 Dasatinib resistant cells exhibit differential sensitivity to the Src inhibitors, saracatinib and bosutinib (A) Dasatinib IC50 values of control and dasatinib-resistant (DasRes) cell lines that were calculated based on a growth curve with concentrations ranging from 0 - 10muM. (B-C) Sulfurhodamine B (SRB) growth assays were performed on the DasRes cell lines to determine sensitivity to saracatinib (B) and bosutinib (C). Three independent biological replicates were performed, and the standard error mean is displayed in the quantification graphs. (D-E) BRAF-mutant (D) and RAS-mutant (E) control and DasRes whole cell lysate was harvested after 24 hour treatments of DMSO, dasatinib, bosutinib, or saracatinib. Control cell lines were treated with 100nM dasatinib, and DasRes cell lines were treated with 2muM dasatinib. FAK/Src signaling was used to determine whether each inhibitor had similar efficacy at inhibiting Src activity. Three independent biological replicates were performed, and representative blots for signaling proteins and loading controls are shown. The pY416 Src blot was stripped and reprobed for total Src.

- Submitted by
- Invitrogen Antibodies (provider)
- Main image

- Experimental details
- Figure 3 The mTOR inhibitor, everolimus, inhibits cell growth and clonogenicity, but does not induce apoptosis (A) Cells were treated with DMSO or Everolimus for 72 hours, and cell number was counted using the ViCell Cell Counter. Fold changes are compared to DMSO. Three independent biological replicates were performed, and the standard error mean is displayed in the quantification graphs. p-value * = 0.05 - 0.01, phi = 0.01 - 0.001, delta = 0.001 - 0.001, Psi < 0.0001. (B-C) BRAF-mutant (B) and RAS-mutant (C) control and DasRes cells were treated with the indicated inhibitors for 24 hours. Cell lysate was harvested and a Western blot was performed to determine changes in the AKT/mTOR pathway signaling. Control cells were treated with 100nM dasatinib, and DasRes cells were treated with 2muM dasatinib. Three independent biological replicates were performed, and representative blots for signaling proteins and loading controls are shown. The pY416 Src blot was stripped and reprobed for total Src. (D-E) BRAF-mutant (D) and Ras-mutant (E) control and DasRes cells were treated with the indicated inhibitors for 7 days, and then released for 7 days to assess colony growth after inhibitor treatment. After 2 weeks, cells were fixed and stained with crystal violet. (F) Apoptosis was measured after 24 hours of everolimus treatment by caspase 3/7 cleavage using the Caspase-Glo 3/7 kit. Fold changes were calculated by comparing treatments to DMSO. Three independent biological

- Submitted by
- Invitrogen Antibodies (provider)
- Main image
- Experimental details
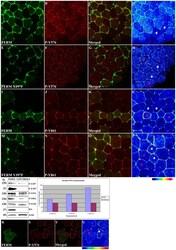
- Figure 5 The FERM domain leads to activation of endogenous FAK in a tyrosine 397 dependent manner. HA-FERM and HA-FERM Y397F injected embryos in one blastomere at the animal pole of two cell stage embryos were processed for whole mount immunostaining using an HA antibody (green) to reveal expressing cells and the respective phospho-specific antibodies (red) as indicated. In each case individual signals for each secondary are shown in addition to a merged image and finally an intensity color coded image of the respective phospho-specific antibody signal. HA-FERM and HA-FERM Y397F injected cells are indicated with red stars and un-injected cells with white stars. (A-D) Levels of phosphorylated tyrosine 576 are elevated in HA-FERM overexpressing cells compared to controls. (E-H) Overexpression of HA-FERM Y397F has no effect on the endogenous levels of phosphorylated tyrosine 576. HA-FERM Y397F expressing cells have the same levels of phosphorylated endogenous FAK on tyrosine 576 with neighboring control cells. (I-L) Levels of phosphorylated tyrosine 861 are elevated in HA-FERM expressing cells compared to controls. (M-P) Overexpression of HA-FERM Y397F has no effect on the endogenous levels of phosphorylated tyrosine 861. HA-FERM Y397F expressing cells have the same levels of phosphorylated endogenous FAK on tyrosine 861 with neighboring control cells. (Q) Total lysates from HA-FERM injected gastrula stage embryos contain comparable levels of endogenous FAK as un-injected contro

- Submitted by
- Invitrogen Antibodies (provider)
- Main image

- Experimental details
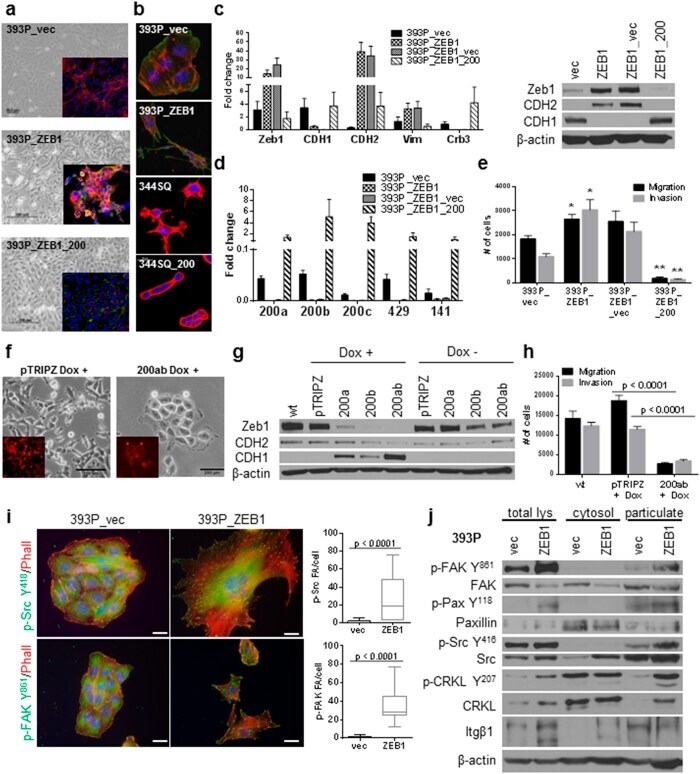
- Figure 1 Zeb1 expression induces EMT/miR-200 repression and FAK pathway activation in previously non-invasive cells. ( a ) Zeb1 expression causes a morphology change (middle panel) and is reversed upon re-expression of miR-200 (lower panel). Cells were stained with Integrin alpha6 (red), ZO-1 (green) and DAPI. ( b ) 393P cells with constitutive Zeb1 expression and 344SQ cells with constitutive miR-200 family expression grown on agarose and stained with phalloidin (red), DAPI and cortactin (green, lower panels). ( c ) Quantitative RT-PCR (left) and Western blot (right) analysis of EMT markers in the indicated cell lines. ( d ) Taqman RT-PCR for the miR-200 family members in the indicated cell lines. ( e ) In vitro Transwell migration and invasion assay for the 393P cell line panel. *p < 0.004, **p < 0.001 ( f ) Induction of miR-200a and b in H157 causes a morphology change. ( g ) Western Blot analysis of EMT markers in H157 + /- miR-200a and/or b. ( h ) In vitro Transwell migration and invasion assay for the inducible H157 cells. ( i ) Immunofluorescence of 393P_vec and 393P_ZEB1 cells stained for p-Src Y 418 , p-FAK Y 861 , and phalloidin (left); an average of 15-30 cells was counted for focal adhesions/cell with individual puncta considered a focal adhesion. Scale bar is 200 mum. (J) Western blot analysis of total cell lysates, cytosolic or membrane particulate fractions from 393P_vec and 393P_ZEB1 cells.
- Submitted by
- Invitrogen Antibodies (provider)
- Main image

- Experimental details
- Figure 4 CRKL is a miR-200 target that regulates integrin-dependent signaling and is prognostic of patient outcome. ( a ) Schematic of the bioinformatic analyses applied to TCGA pan-cancer datasets to select potential miR-200b targets of relevance to lung cancer metastasis. From the top 5000 genes most anti-correlated with expression of miR-200b, we additionally considered genes positively correlated with ZEB1 expression (p < 0.0001, Pearson's), predicted miR-200b target genes (by TargetScan, miRanda, and miRDB), and genes associated with worse prognosis (p < 0.05, univariate Cox) in lung adenocarcoinomas 25 . Genes listed met all of the above criteria. ( b ) Heatmap showing the correlation of CRKL expression with the listed feature for each of the tumor specimens included from TCGA pan-cancer datasets by Pearson's coefficient. Significance of correlation: p < 1E-12 for miR-200c, p < 1E-35 all other features. ( c ) Kaplan-Meier plot of overall survival in patients from TCGA datasets, as stratified by CRKL expression. P-value by log-rank test. ( d ) qRT-PCR analysis of adaptor molecules in the paired epithelial and mesenchymal murine cell lines. ( e ) Western blot of total and phospho-CRKL expression in the murine cell lines and the genetically manipulated 393P cell lines. ( f ) Luciferase reporter assay in H157 cells using hRL_3' CRKL wt and mutant constructs. *p < 0.05, **p < 0.03, ***p < 0.003. The CRKL 3'UTR contains two predicted miR-200b/c/429 sites a

- Submitted by
- Invitrogen Antibodies (provider)
- Main image

- Experimental details
- Figure 5 Effect of combination treatment with dasatinib and EC-8042 in FaDu xenografts. Mice with established FaDu xenografts were randomly assigned to four different treatment groups ( n = 10 tumors per group) and treated with saline buffer intravenously (i.v.) and/or tartaric acid (orally) (control), dasatinib (orally) at a dose of 10 mg/Kg every day (16 doses), EC-8042 (i.v.) at a dose of 50 mg/Kg every 7 days (4 doses), or the dasatinib plus EC-8042 combination (combo). Animals were sacrificed 4 h after the last treatment with dasatinib and 24 h after treatment with EC-8042. ( A ) Curves representing the mean tumor volume of FaDu xenografts during the treatments. Drug efficacy expressed as the percentage of tumor growth inhibition (%TGI) at the end of the experiment is indicated. Mean +- SD ( n = 10 per treatment group), RM-one-way ANOVA, Tukey's test, * p < 0.05, ** p < 0.01 vs. control (black) and dasatinib-treated mice (red). ( B , C ) Distribution of tumor volumes ( B ) and tumor weights ( C ) at the end of the experiment. Mean +- SD ( n = 10 per group), one-way ANOVA, Tukey's test, p < 0.05 between the indicated groups. ( D ) For the evaluation of CSC subpopulations after drug treatments, xenograft tumors were harvested and dissociated into single cells to assess the tumorsphere-forming ability after in vivo drug treatment. Mean +- SD ( n = 3 per group), one-way ANOVA, Tukey's test. ( E ) Representative images and ( F - J ) graphs of the immunohistochemical analysis
