Explore
 Validate
 Learn
Learn12-2069-41
antibody from Invitrogen Antibodies
Targeting: MRC1
bA541I19.1, CD206, CLEC13D, CLEC13DL, MRC1L1
 Flow cytometry
Antibody data
- Antibody Data
- Antigen structure
- References [30]
- Comments [0]
- Validations
- Flow cytometry [1]
- Other assay [21]
Submit
Validation data
Reference
Comment
Report error
- Product number
- 12-2069-41 - Provider product page

- Provider
- Invitrogen Antibodies
- Product name
- CD206 (MMR) Monoclonal Antibody (19.2), PE, eBioscience™
- Antibody type
- Monoclonal
- Antigen
- Other
- Description
- Description: This 19.2 monoclonal antibody reacts with human CD206, which is also known as the macrophage mannose receptor (MMR). CD206 is expressed on macrophages and dendritic cells. This type I transmembrane protein can also be detected on non-immune cells, including hepatic and lymphathic epithelia and kidney mesengial cells. CD206 binds to glycoproteins that terminate in D-mannose, L-fucose, or N-acetylglucosamine, as well as a variety of hormones. This receptor undergoes constitutive internalization and recycling between the plasma membrane and the endosomal compartment. CD206 is involved in antigen processing and presentation, cell migration, and intracellular signaling. Moreover, CD206 plays a key role in phagocytosis pathogens such as Candida albicans, Leishmania, and Mycobacterium tuberculosis.
- Conjugate
- Yellow dye
- Antibody clone number
- 19.2
- Concentration
- 5 µL/Test
Submitted references M2-like tumor-associated macrophages transmit exosomal miR-27b-3p and maintain glioblastoma stem-like cell properties.
High-Molecular-Weight Hyaluronic Acid Inhibits IL-1β-Induced Synovial Inflammation and Macrophage Polarization through the GRP78-NF-κB Signaling Pathway.
Interleukin 6 regulates the expression of programmed cell death ligand 1 in thyroid cancer.
The role of irreversible electroporation in promoting M1 macrophage polarization via regulating the HMGB1-RAGE-MAPK axis in pancreatic cancer.
miR-155-5p regulates macrophage M1 polarization and apoptosis in the synovial fluid of patients with knee osteoarthritis.
AIM2 inflammasome mediates hallmark neuropathological alterations and cognitive impairment in a mouse model of vascular dementia.
Paliperidone Inhibits Glioblastoma Growth in Mouse Brain Tumor Model and Reduces PD-L1 Expression.
Nanotopographical Coatings Induce an Early Phenotype-Specific Response of Primary Material-Resident M1 and M2 Macrophages.
Annexin A1 drives macrophage skewing to accelerate muscle regeneration through AMPK activation.
The Immunosuppressive Microenvironment in BRCA1-IRIS-Overexpressing TNBC Tumors Is Induced by Bidirectional Interaction with Tumor-Associated Macrophages.
In Situ Therapeutic Cancer Vaccination with an Oncolytic Virus Expressing Membrane-Tethered IL-2.
Lung transplantation for patients with severe COVID-19.
CAIX Regulates GBM Motility and TAM Adhesion and Polarization through EGFR/STAT3 under Hypoxic Conditions.
An altered response in macrophage phenotype following damage in aged human skeletal muscle: implications for skeletal muscle repair.
Astragalus polysaccharides (PG2) Enhances the M1 Polarization of Macrophages, Functional Maturation of Dendritic Cells, and T Cell-Mediated Anticancer Immune Responses in Patients with Lung Cancer.
A Subset of Skin Macrophages Contributes to the Surveillance and Regeneration of Local Nerves.
Role of adipokine zinc-α(2)-glycoprotein in coronary heart disease.
Ginsenoside Rg3 Mitigates Atherosclerosis Progression in Diabetic apoE-/- Mice by Skewing Macrophages to the M2 Phenotype.
Inhibition of lncRNA NEAT1 suppresses the inflammatory response in IBD by modulating the intestinal epithelial barrier and by exosome-mediated polarization of macrophages.
Human lactoferrin attenuates the proinflammatory response of neonatal monocyte-derived macrophages.
Diabetes impairs wound healing by Dnmt1-dependent dysregulation of hematopoietic stem cells differentiation towards macrophages.
Similarities and differences between helminth parasites and cancer cell lines in shaping human monocytes: Insights into parallel mechanisms of immune evasion.
In vitro chemotaxis and tissue remodeling assays quantitatively characterize foreign body reaction.
A comparative multi-parametric in vitro model identifies the power of test conditions to predict the fibrotic tendency of a biomaterial.
Metformin-treated cancer cells modulate macrophage polarization through AMPK-NF-κB signaling.
ALX receptor ligands define a biochemical endotype for severe asthma.
A Systematic Study of the Effect of Different Molecular Weights of Hyaluronic Acid on Mesenchymal Stromal Cell-Mediated Immunomodulation.
The mucin MUC1 modulates the tumor immunological microenvironment through engagement of the lectin Siglec-9.
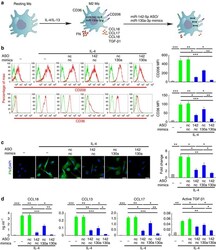
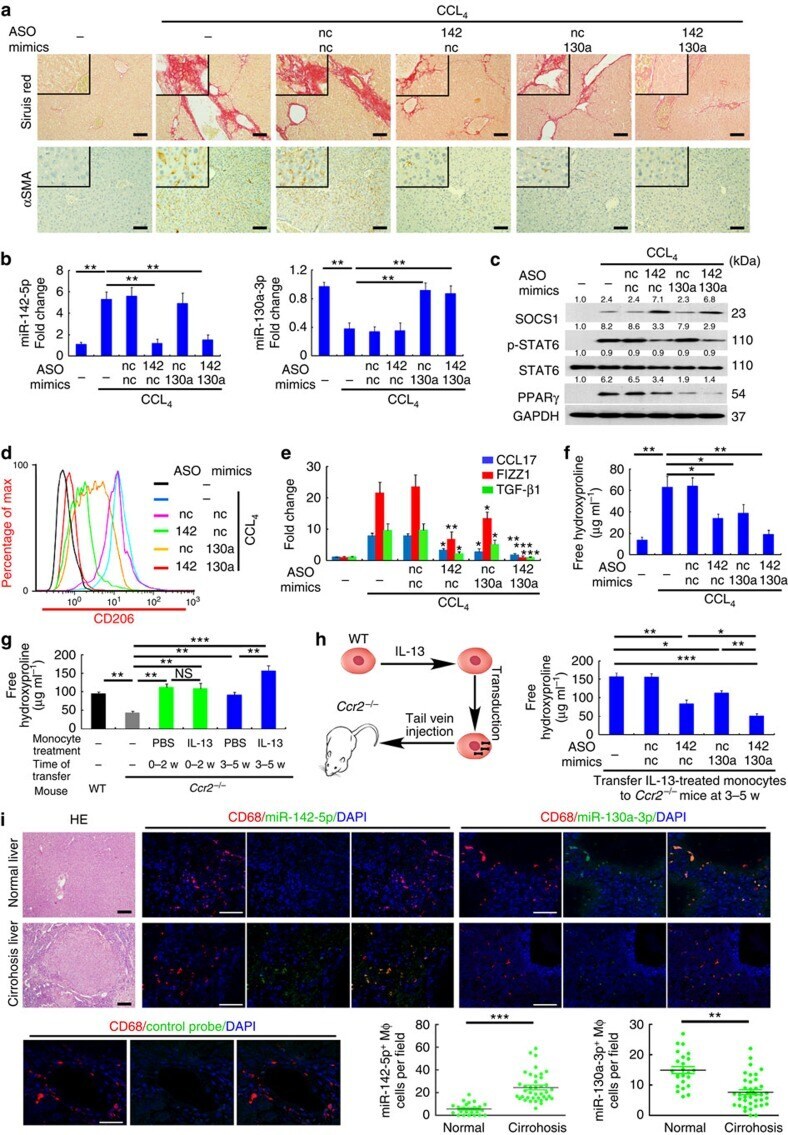
miR-142-5p and miR-130a-3p are regulated by IL-4 and IL-13 and control profibrogenic macrophage program.
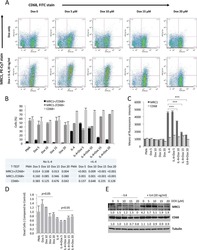
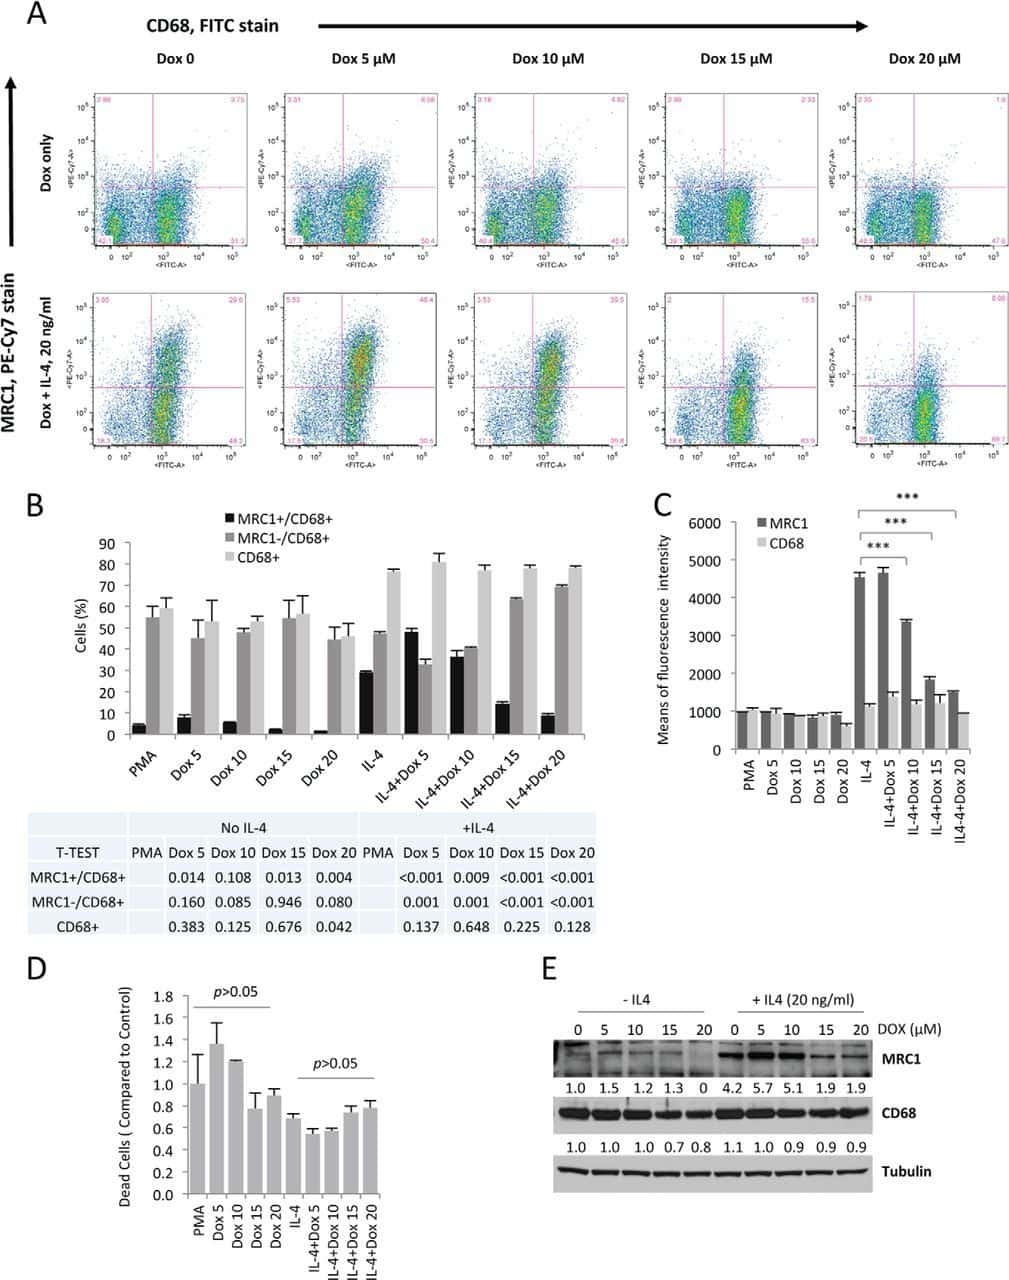
Doxycycline inhibits polarization of macrophages to the proangiogenic M2-type and subsequent neovascularization.
Zhao G, Ding L, Yu H, Wang W, Wang H, Hu Y, Qin L, Deng G, Xie B, Li G, Qi L
Cell death discovery 2022 Aug 4;8(1):350
Cell death discovery 2022 Aug 4;8(1):350
High-Molecular-Weight Hyaluronic Acid Inhibits IL-1β-Induced Synovial Inflammation and Macrophage Polarization through the GRP78-NF-κB Signaling Pathway.
Lee CH, Chiang CF, Kuo FC, Su SC, Huang CL, Liu JS, Lu CH, Hsieh CH, Wang CC, Lee CH, Shen PH
International journal of molecular sciences 2021 Nov 3;22(21)
International journal of molecular sciences 2021 Nov 3;22(21)
Interleukin 6 regulates the expression of programmed cell death ligand 1 in thyroid cancer.
Zhang GQ, Jiao Q, Shen CT, Song HJ, Zhang HZ, Qiu ZL, Luo QY
Cancer science 2021 Mar;112(3):997-1010
Cancer science 2021 Mar;112(3):997-1010
The role of irreversible electroporation in promoting M1 macrophage polarization via regulating the HMGB1-RAGE-MAPK axis in pancreatic cancer.
He C, Sun S, Zhang Y, Xie F, Li S
Oncoimmunology 2021 Mar 11;10(1):1897295
Oncoimmunology 2021 Mar 11;10(1):1897295
miR-155-5p regulates macrophage M1 polarization and apoptosis in the synovial fluid of patients with knee osteoarthritis.
Li GS, Cui L, Wang GD
Experimental and therapeutic medicine 2021 Jan;21(1):68
Experimental and therapeutic medicine 2021 Jan;21(1):68
AIM2 inflammasome mediates hallmark neuropathological alterations and cognitive impairment in a mouse model of vascular dementia.
Poh L, Fann DY, Wong P, Lim HM, Foo SL, Kang SW, Rajeev V, Selvaraji S, Iyer VR, Parathy N, Khan MB, Hess DC, Jo DG, Drummond GR, Sobey CG, Lai MKP, Chen CL, Lim LHK, Arumugam TV
Molecular psychiatry 2021 Aug;26(8):4544-4560
Molecular psychiatry 2021 Aug;26(8):4544-4560
Paliperidone Inhibits Glioblastoma Growth in Mouse Brain Tumor Model and Reduces PD-L1 Expression.
Liu YS, Huang BR, Lin CJ, Shen CK, Lai SW, Chen CW, Lin HJ, Lin CH, Hsieh YC, Lu DY
Cancers 2021 Aug 28;13(17)
Cancers 2021 Aug 28;13(17)
Nanotopographical Coatings Induce an Early Phenotype-Specific Response of Primary Material-Resident M1 and M2 Macrophages.
Schmitz T, Jannasch M, Weigel T, Moseke C, Gbureck U, Groll J, Walles H, Hansmann J
Materials (Basel, Switzerland) 2020 Mar 4;13(5)
Materials (Basel, Switzerland) 2020 Mar 4;13(5)
Annexin A1 drives macrophage skewing to accelerate muscle regeneration through AMPK activation.
McArthur S, Juban G, Gobbetti T, Desgeorges T, Theret M, Gondin J, Toller-Kawahisa JE, Reutelingsperger CP, Chazaud B, Perretti M, Mounier R
The Journal of clinical investigation 2020 Mar 2;130(3):1156-1167
The Journal of clinical investigation 2020 Mar 2;130(3):1156-1167
The Immunosuppressive Microenvironment in BRCA1-IRIS-Overexpressing TNBC Tumors Is Induced by Bidirectional Interaction with Tumor-Associated Macrophages.
Sami E, Paul BT, Koziol JA, ElShamy WM
Cancer research 2020 Mar 1;80(5):1102-1117
Cancer research 2020 Mar 1;80(5):1102-1117
In Situ Therapeutic Cancer Vaccination with an Oncolytic Virus Expressing Membrane-Tethered IL-2.
Liu W, Dai E, Liu Z, Ma C, Guo ZS, Bartlett DL
Molecular therapy oncolytics 2020 Jun 26;17:350-360
Molecular therapy oncolytics 2020 Jun 26;17:350-360
Lung transplantation for patients with severe COVID-19.
Bharat A, Querrey M, Markov NS, Kim S, Kurihara C, Garza-Castillon R, Manerikar A, Shilatifard A, Tomic R, Politanska Y, Abdala-Valencia H, Yeldandi AV, Lomasney JW, Misharin AV, Budinger GRS
Science translational medicine 2020 Dec 16;12(574)
Science translational medicine 2020 Dec 16;12(574)
CAIX Regulates GBM Motility and TAM Adhesion and Polarization through EGFR/STAT3 under Hypoxic Conditions.
Huang BR, Liu YS, Lai SW, Lin HJ, Shen CK, Yang LY, Lu DY
International journal of molecular sciences 2020 Aug 14;21(16)
International journal of molecular sciences 2020 Aug 14;21(16)
An altered response in macrophage phenotype following damage in aged human skeletal muscle: implications for skeletal muscle repair.
Sorensen JR, Kaluhiokalani JP, Hafen PS, Deyhle MR, Parcell AC, Hyldahl RD
FASEB journal : official publication of the Federation of American Societies for Experimental Biology 2019 Sep;33(9):10353-10368
FASEB journal : official publication of the Federation of American Societies for Experimental Biology 2019 Sep;33(9):10353-10368
Astragalus polysaccharides (PG2) Enhances the M1 Polarization of Macrophages, Functional Maturation of Dendritic Cells, and T Cell-Mediated Anticancer Immune Responses in Patients with Lung Cancer.
Bamodu OA, Kuo KT, Wang CH, Huang WC, Wu ATH, Tsai JT, Lee KY, Yeh CT, Wang LS
Nutrients 2019 Sep 20;11(10)
Nutrients 2019 Sep 20;11(10)
A Subset of Skin Macrophages Contributes to the Surveillance and Regeneration of Local Nerves.
Kolter J, Feuerstein R, Zeis P, Hagemeyer N, Paterson N, d'Errico P, Baasch S, Amann L, Masuda T, Lösslein A, Gharun K, Meyer-Luehmann M, Waskow C, Franzke CW, Grün D, Lämmermann T, Prinz M, Henneke P
Immunity 2019 Jun 18;50(6):1482-1497.e7
Immunity 2019 Jun 18;50(6):1482-1497.e7
Role of adipokine zinc-α(2)-glycoprotein in coronary heart disease.
Huang D, Mao X, Peng J, Cheng M, Bai T, Du M, Huang K, Liu B, Yang L, Huang K, Zhang F
American journal of physiology. Endocrinology and metabolism 2019 Dec 1;317(6):E1055-E1062
American journal of physiology. Endocrinology and metabolism 2019 Dec 1;317(6):E1055-E1062
Ginsenoside Rg3 Mitigates Atherosclerosis Progression in Diabetic apoE-/- Mice by Skewing Macrophages to the M2 Phenotype.
Guo M, Xiao J, Sheng X, Zhang X, Tie Y, Wang L, Zhao L, Ji X
Frontiers in pharmacology 2018;9:464
Frontiers in pharmacology 2018;9:464
Inhibition of lncRNA NEAT1 suppresses the inflammatory response in IBD by modulating the intestinal epithelial barrier and by exosome-mediated polarization of macrophages.
Liu R, Tang A, Wang X, Chen X, Zhao L, Xiao Z, Shen S
International journal of molecular medicine 2018 Nov;42(5):2903-2913
International journal of molecular medicine 2018 Nov;42(5):2903-2913
Human lactoferrin attenuates the proinflammatory response of neonatal monocyte-derived macrophages.
Wisgrill L, Wessely I, Spittler A, Förster-Waldl E, Berger A, Sadeghi K
Clinical and experimental immunology 2018 Jun;192(3):315-324
Clinical and experimental immunology 2018 Jun;192(3):315-324
Diabetes impairs wound healing by Dnmt1-dependent dysregulation of hematopoietic stem cells differentiation towards macrophages.
Yan J, Tie G, Wang S, Tutto A, DeMarco N, Khair L, Fazzio TG, Messina LM
Nature communications 2018 Jan 2;9(1):33
Nature communications 2018 Jan 2;9(1):33
Similarities and differences between helminth parasites and cancer cell lines in shaping human monocytes: Insights into parallel mechanisms of immune evasion.
Narasimhan PB, Akabas L, Tariq S, Huda N, Bennuru S, Sabzevari H, Hofmeister R, Nutman TB, Tolouei Semnani R
PLoS neglected tropical diseases 2018 Apr;12(4):e0006404
PLoS neglected tropical diseases 2018 Apr;12(4):e0006404
In vitro chemotaxis and tissue remodeling assays quantitatively characterize foreign body reaction.
Jannasch M, Weigel T, Engelhardt L, Wiezoreck J, Gaetzner S, Walles H, Schmitz T, Hansmann J
ALTEX 2017;34(2):253-266
ALTEX 2017;34(2):253-266
A comparative multi-parametric in vitro model identifies the power of test conditions to predict the fibrotic tendency of a biomaterial.
Jannasch M, Gaetzner S, Weigel T, Walles H, Schmitz T, Hansmann J
Scientific reports 2017 May 10;7(1):1689
Scientific reports 2017 May 10;7(1):1689
Metformin-treated cancer cells modulate macrophage polarization through AMPK-NF-κB signaling.
Chiang CF, Chao TT, Su YF, Hsu CC, Chien CY, Chiu KC, Shiah SG, Lee CH, Liu SY, Shieh YS
Oncotarget 2017 Mar 28;8(13):20706-20718
Oncotarget 2017 Mar 28;8(13):20706-20718
ALX receptor ligands define a biochemical endotype for severe asthma.
Ricklefs I, Barkas I, Duvall MG, Cernadas M, Grossman NL, Israel E, Bleecker ER, Castro M, Erzurum SC, Fahy JV, Gaston BM, Denlinger LC, Mauger DT, Wenzel SE, Comhair SA, Coverstone AM, Fajt ML, Hastie AT, Johansson MW, Peters MC, Phillips BR, Levy BD, National Heart Lung and Blood Institute’s Severe Asthma Research Program-3 Investigators
JCI insight 2017 Jul 20;2(14)
JCI insight 2017 Jul 20;2(14)
A Systematic Study of the Effect of Different Molecular Weights of Hyaluronic Acid on Mesenchymal Stromal Cell-Mediated Immunomodulation.
Gómez-Aristizábal A, Kim KP, Viswanathan S
PloS one 2016;11(1):e0147868
PloS one 2016;11(1):e0147868
The mucin MUC1 modulates the tumor immunological microenvironment through engagement of the lectin Siglec-9.
Beatson R, Tajadura-Ortega V, Achkova D, Picco G, Tsourouktsoglou TD, Klausing S, Hillier M, Maher J, Noll T, Crocker PR, Taylor-Papadimitriou J, Burchell JM
Nature immunology 2016 Nov;17(11):1273-1281
Nature immunology 2016 Nov;17(11):1273-1281
miR-142-5p and miR-130a-3p are regulated by IL-4 and IL-13 and control profibrogenic macrophage program.
Su S, Zhao Q, He C, Huang D, Liu J, Chen F, Chen J, Liao JY, Cui X, Zeng Y, Yao H, Su F, Liu Q, Jiang S, Song E
Nature communications 2015 Oct 5;6:8523
Nature communications 2015 Oct 5;6:8523
Doxycycline inhibits polarization of macrophages to the proangiogenic M2-type and subsequent neovascularization.
He L, Marneros AG
The Journal of biological chemistry 2014 Mar 21;289(12):8019-28
The Journal of biological chemistry 2014 Mar 21;289(12):8019-28
No comments: Submit comment
Supportive validation
- Submitted by
- Invitrogen Antibodies (provider)
- Main image

- Experimental details
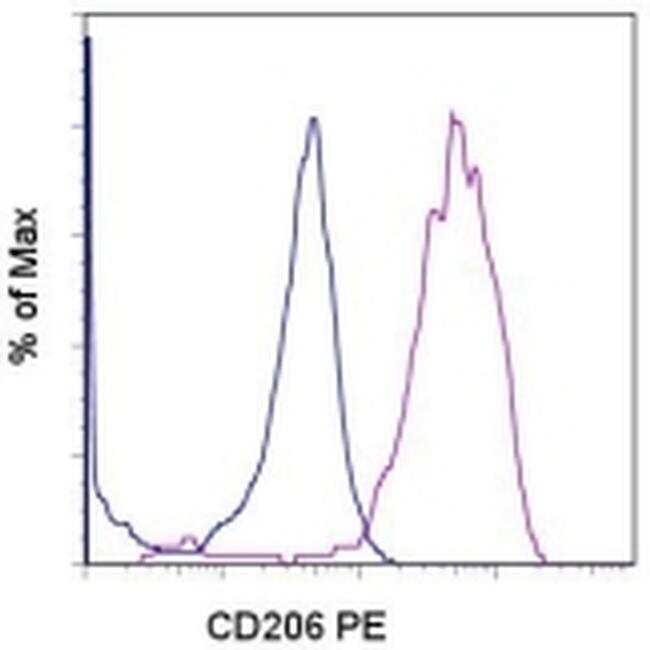
- Staining of 3-day GM-CSF-stimulated (purple histogram) or unstimulated (blue histogram) normal human peripheral blood cells with Anti-Human CD206 (MMR) PE. Cells in the monocyte gate were used for analysis.
- Conjugate
- Yellow dye
Supportive validation
- Submitted by
- Invitrogen Antibodies (provider)
- Main image
- Experimental details
- NULL
- Conjugate
- Yellow dye
- Submitted by
- Invitrogen Antibodies (provider)
- Main image
- Experimental details
- NULL
- Conjugate
- Yellow dye
- Submitted by
- Invitrogen Antibodies (provider)
- Main image
- Experimental details
- Figure 2 miR-142-5p and miR-130a-3p regulate M2 activation of macrophages. ( a - d ) Human macrophages were transduced with nc, miR-142-5p ASO or miR-130a-3p mimics or both using lentiviral vectors. After 24 h, the cells were treated with IL-4 for 48 h. ( a ) The schematics of the approach. ( b ) Expression of CD206 and CD36 in macrophages as determined by flow-cytometry analysis. The representative histograms and quantitation of the MFI are shown (mean+-s.e.m., n =4 independent experiments; * P
- Conjugate
- Yellow dye

- Submitted by
- Invitrogen Antibodies (provider)
- Main image

- Experimental details
- Figure 9 Dyregulated Mph miR-142-5p and miR-130a-3p enhance liver fibrosis. ( a - f ) Mice were intravenously injected with LNA-modified miR-142-5p ASO, miR-130a-3p mimic or both every 3 days after CCL 4 challenge. Mice were sacrificed after 6 weeks (mean+-s.e.m., n =8 mice/group; * P
- Conjugate
- Yellow dye
- Submitted by
- Invitrogen Antibodies (provider)
- Main image
- Experimental details
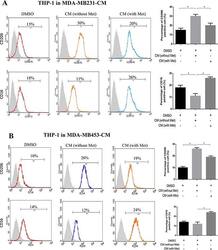
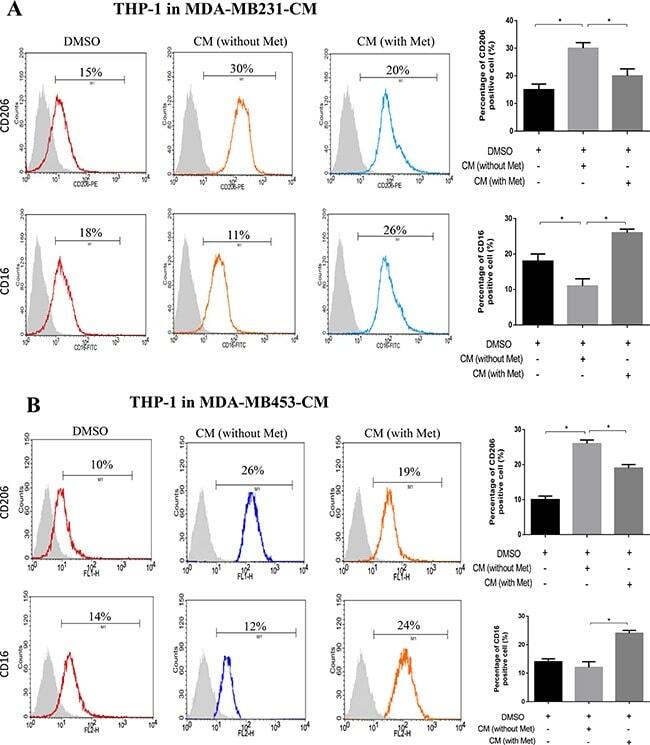
- Figure 1 Metformin treated cancer cells polarized macrophage toward M1 phenotype THP-1 cells were stimulated with PMA (200 nM) for 24 h, then incubated with breast cancer (MDA-MB231/MDA-MB453) conditioned medium (CM) with or without metformin (60 muM) for 6 h, followed by flow cytometry analysis to quantify the amount of CD206, an M2 macrophage marker, and CD16, an M1 marker ( A, B ). Data are expressed as mean +- SD, * p < 0.05. DMSO: control; Met: metformin. Representative flow data shown are from experiments independently performed at least three times.
- Conjugate
- Yellow dye
- Submitted by
- Invitrogen Antibodies (provider)
- Main image
- Experimental details
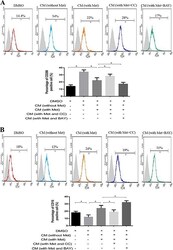
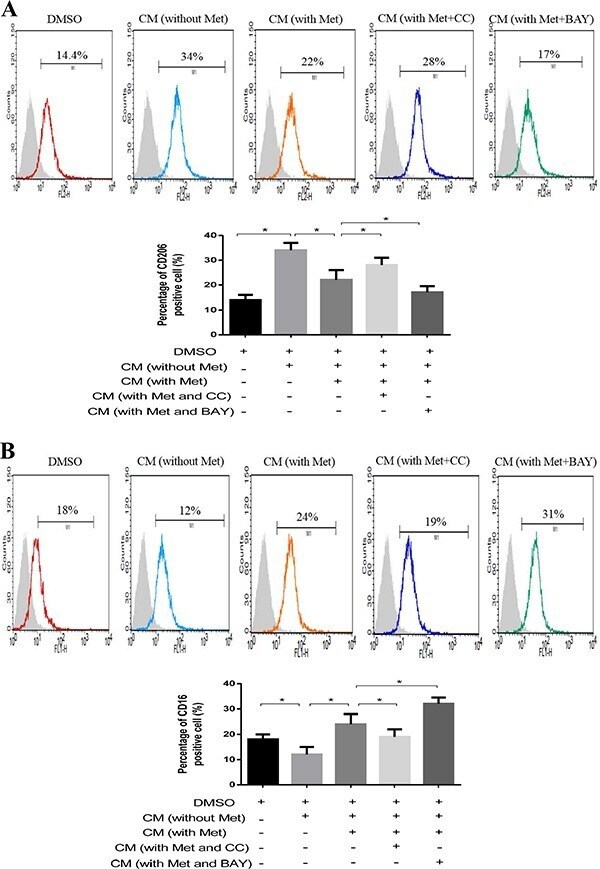
- Figure 5 AMPK-NF-kappaB signaling participated in macrophage polarization Breast cancer cells (MDA-MB231) were treated with metformin 60 muM combined with an AMPK inhibitor (Compound C, CC) or NF-kappaB inhibitor (BAY-117082, BAY) for 6 h. The supernatant was collected to treat macrophages for 48 h, followed by flow cytometry analysis of CD206, M2 phenotype ( A ) and CD16, M1 phenotype ( B ). Data are expressed as mean +- SD, * p < 0.05. DMSO: control; CM: conditioned medium, Met: metformin. Representative flow data shown are from experiments independently performed at least three times.
- Conjugate
- Yellow dye
- Submitted by
- Invitrogen Antibodies (provider)
- Main image
- Experimental details
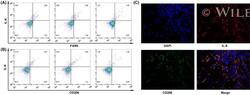
- 4 FIGURE M2-phenotype macrophages produce interleukin 6 (IL-6) in thyroid cancer. A, Flow cytometry showed that IL-6 was distributed in F4/80 staining-positive tumor-associated macrophages (TAMs). B, Flow cytometry showed that IL-6 was distributed in CD206-positive M2-phenotype macrophages. C, Double immunofluorescence analysis illustrated the colocalization of IL-6 and M2 phenotype within thyroid cancer
- Conjugate
- Yellow dye
- Submitted by
- Invitrogen Antibodies (provider)
- Main image
- Experimental details
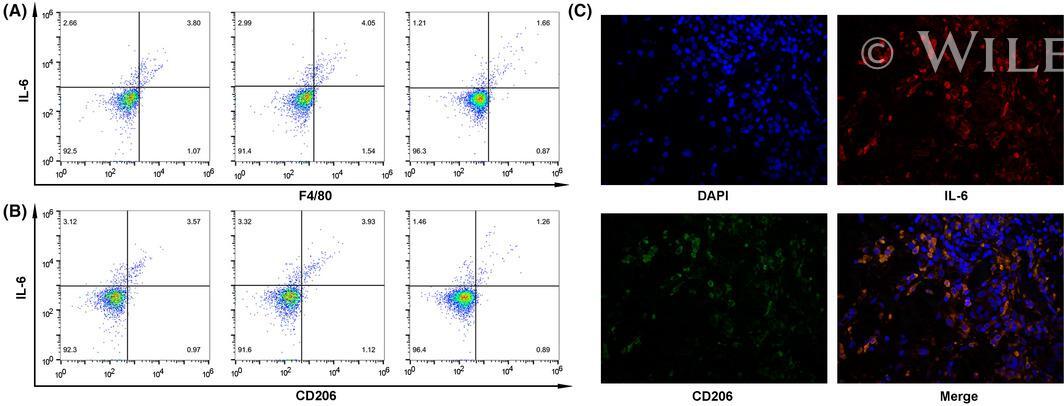
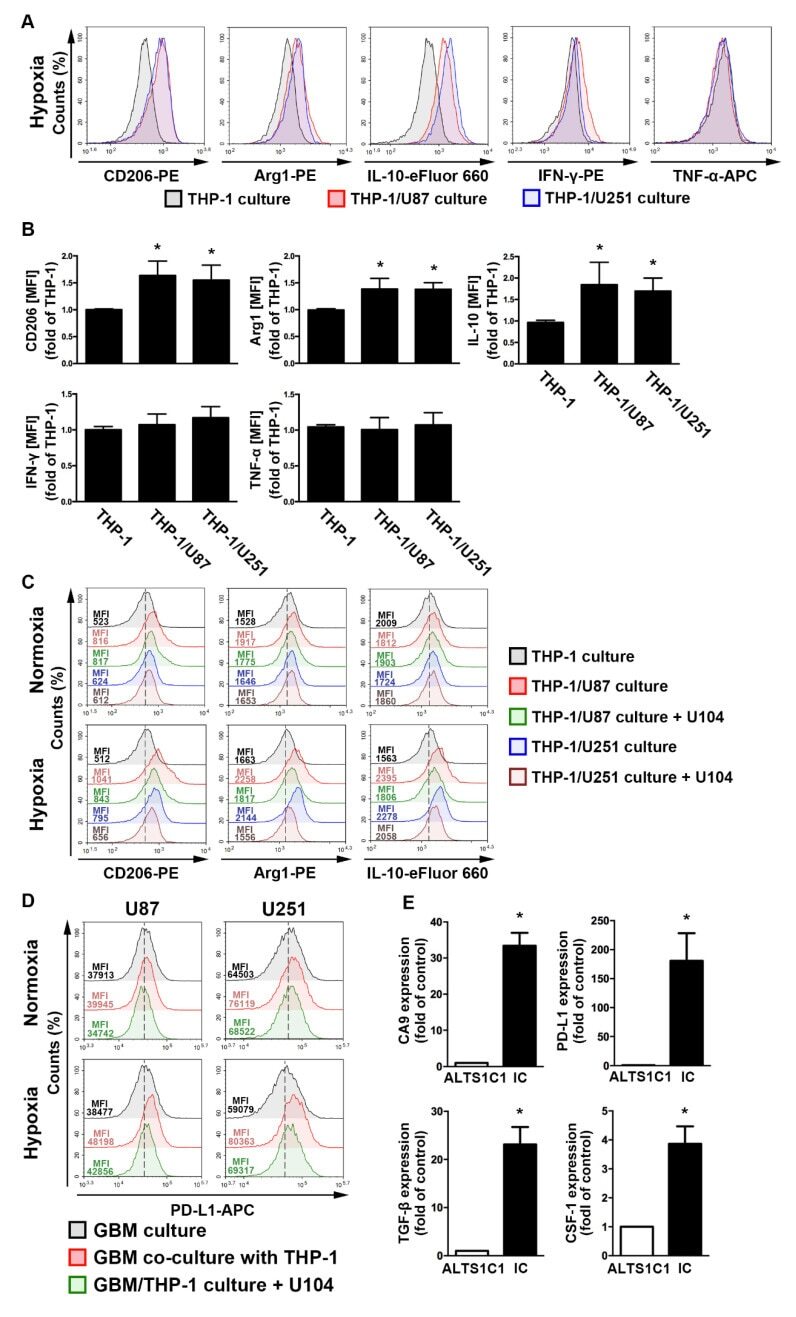
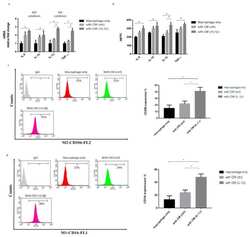
- Figure 4 The polarizations of monocyte and GBM progression in a co-cultured model under hypoxic conditions. ( A ) THP-1 monocytes were co-cultured with U87-green fluorescent protein (GFP) or U251-GFP under hypoxic conditions for 48 h. The co-cultured cells were plotted on a side scatter versus FITC. The THP-1 monocytes (GFP-negative cells) were analyzed to assess the levels of cluster of differentiation (CD) 206, arginase 1 (Arg1), interleukin (IL)-10, interferon (IFN)-gamma, and tumor necrosis factor (TNF)-alpha by flow cytometry. ( B ) The median fluorescence intensity (MFI) of CD206, Arg1, IL-10, IFN-gamma, and TNF-alpha in THP-1 monocytes in the co-cultured model under hypoxic conditions for 48 h. * p < 0.05 compared with the THP-1 monocyte group. Quantitative data are presented as the mean +- standard error (representative of n = 3). ( C ) U87-GFP and U251-GFP were treated with U104 (CAIX inhibitor) and subsequently co-cultured with THP-1 monocytes under hypoxic conditions for 48 h. THP-1 monocytes (GFP-negative cells) were analyzed to assess the levels of CD206, Arg1, and IL-10 by flow cytometry. ( D ) U87-GFP or U251-GFP was treated with U104 and subsequently co-cultured with THP-1 monocytes under hypoxic conditions for 48 h. The co-cultured cells were plotted on a side scatter versus FITC. The GFP-positive gated GBM was analyzed to assess the levels of programmed death ligand 1 (PD-L1) by flow cytometry. ( E ) The levels of CAIX, PD-L1, tumor growth factor-beta, and c
- Conjugate
- Yellow dye
- Submitted by
- Invitrogen Antibodies (provider)
- Main image
- Experimental details
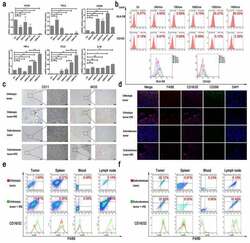
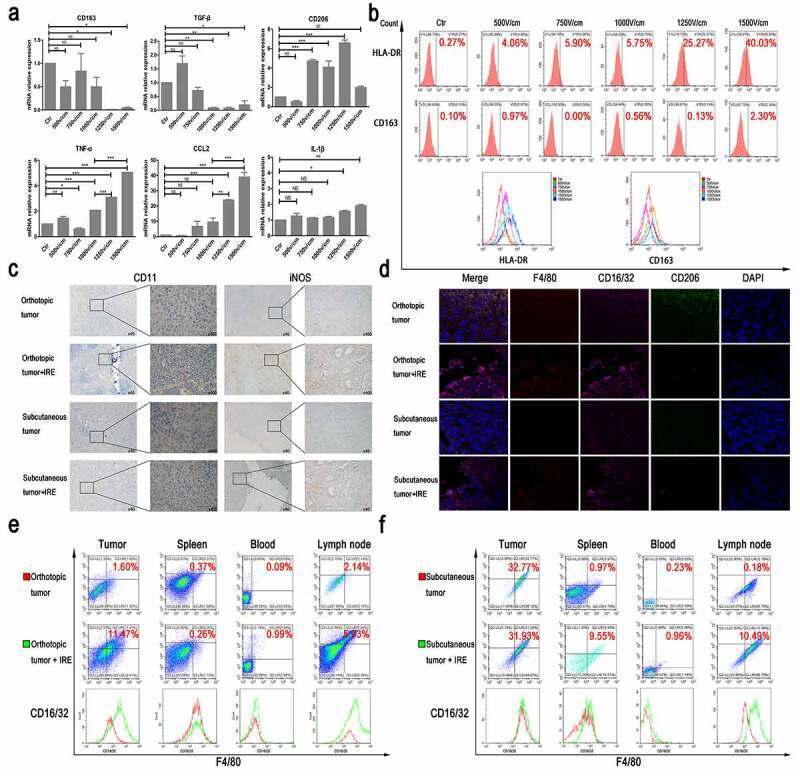
- Figure 2. The effect of TSN on macrophage polarization. (a) The comparisons of mRNA levels of cytokines from THP-1 stimulated by TSN of Panc-1-treated with electric fields. The mRNA levels of M1 markers increased along with the increasing electric fields, while the mRNA levels of M2 markers did not show a continuous increase along with the increasing electric fields. (b) The expression of surface markers of THP-1 stimulated by TSN of Bxpc-3 treated with electric fields. Increased expression of HLA-DR on THP-1 along with the increasing electric fields was observed. (c) IRE could increase infiltration of M1 macrophage in pancreatic tumor tissue (IHC). Orthotopic or subcutaneous tumor tissue was used as control. (d) IRE could increase the expression of CD16/32 in infiltrated macrophages in pancreatic tumor tissue. Orthotopic or subcutaneous tumor tissue was used as control. F4/80 was used to indicate macrophage; CD16/32 was the marker of M1 macrophage; CD206 was the marker of M2 macrophage; DAPI was used to indicate the nuclear of cells. (e) The expression of CD16/32 in macrophage from tumor tissue, spleen, peripheral blood, and lymph node in an orthotopic model of mouse pancreatic cancer after IRE treatment. IRE increased the expression of CD16/32 on the surface of macrophages from these tissues in the orthotopic model of mouse pancreatic cancer. (f) The expression of CD16/32 in macrophages from tumor tissue, spleen, peripheral blood, and lymph node in the subcutaneous model of
- Conjugate
- Yellow dye
- Submitted by
- Invitrogen Antibodies (provider)
- Main image
- Experimental details
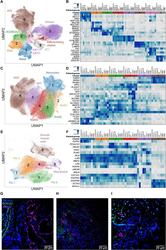
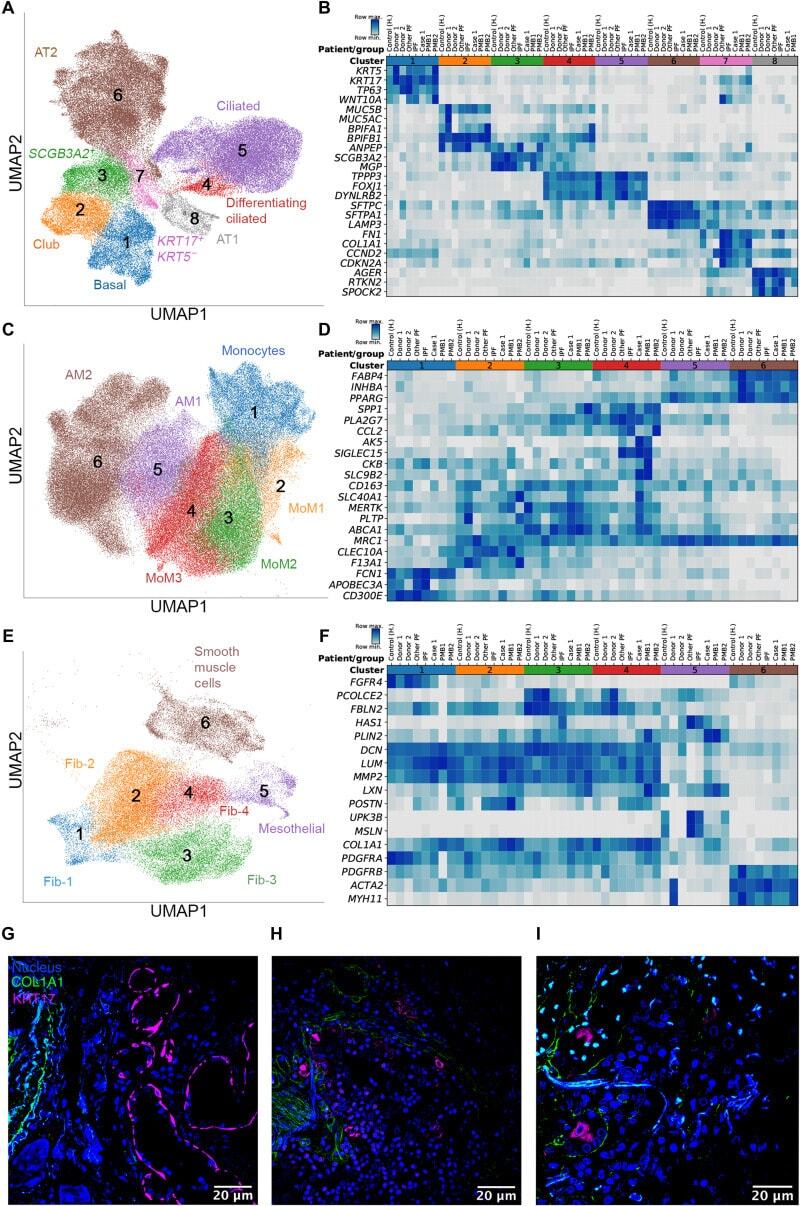
- Fig. 4 Single-cell RNA sequencing of lung tissue from patients with severe COVID-19. ( A , C , and E ) Uniform Manifold Approximation and Projection (UMAP) plots showing individual populations of epithelial cells (A), macrophages (C), and mesenchymal cells (E). ( B , D , and F ) Heatmaps illustrating expression of select marker genes in epithelial cells (B), macrophages (D), and mesenchymal cells (F). Gene expression for the pulmonary fibrosis dataset of Habermann et al. () is shown as an average per condition; gene expression for the end-stage COVID-19 dataset is shown per individual patient. Labels on heatmaps (B, D, and F) correspond to the following samples: Control (H), healthy controls; IPF, idiopathic pulmonary fibrosis samples; Other PF, samples from patients with other forms of pulmonary fibrosis, all from the Habermann et al. dataset. Donor 1, Donor 2, control donor lungs; Case 1, lung transplant case 1; PMB1, PMB2, postmortem lung biopsies from two patients with COVID-19, all from the end-stage COVID-19 dataset. ( G ) Immunofluorescence microscopy revealed KRT17 staining (magenta) of flat epithelial cells resembling alveolar type 1 cells in nonfibrotic lung tissue from a patient who died of COVID-19 (palliative COVID-19). ( H and I ) Immunofluorescence microscopy revealed KRT17 staining (magenta) of distal explanted lung tissue from a patient with COVID-19 undergoing lung transplantation (H) and lung tissue from a patient (PMB1) who died from late-stage severe COVI
- Conjugate
- Yellow dye
- Submitted by
- Invitrogen Antibodies (provider)
- Main image
- Experimental details
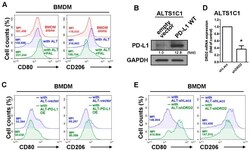
- Figure 3 DRD2 and PD-L1 in GBM are involved in the polarization of TAMs in the GBM-macrophage co-cultured system. ( A ) BMDMs were co-cultured with ALTS1C1-GFP cells and then treated with or without PAL (20 muM) for 48 h. CD80 and CD206 expressions were determined by flow cytometry analysis. ( B ) Establishment of stable PD-L1 expression in ALTS1C1-GFP cells. The expression of PD-L1 was verified by Western blot. ( C ) BMDMs were co-cultured with PD-L1 ALTS1C1-GFP cells for 48 h. CD80 and CD206 were determined by flow cytometry analysis. ( D ) ALTS1C1-GFP cells were transfected with DRD2, and the expression of DRD2 was verified by real time-PCR. * p < 0.05 compared with shLacz group. ( E ) BMDMs were co-cultured with DRD2 knockdown of ALTS1C1-GFP cells for 48 h. CD80 and CD206 were determined by flow cytometry analysis.
- Conjugate
- Yellow dye

- Submitted by
- Invitrogen Antibodies (provider)
- Main image
- Experimental details
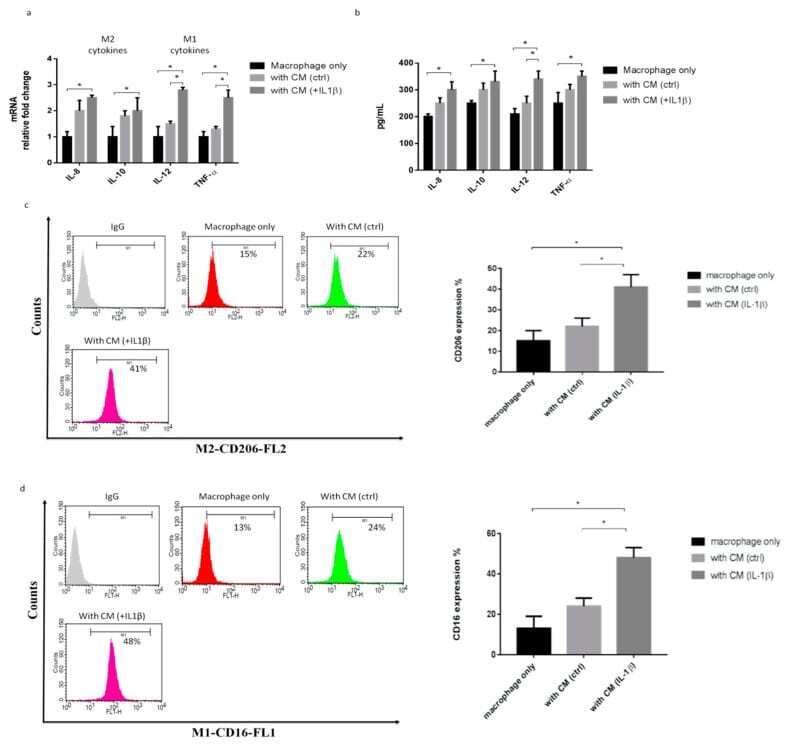
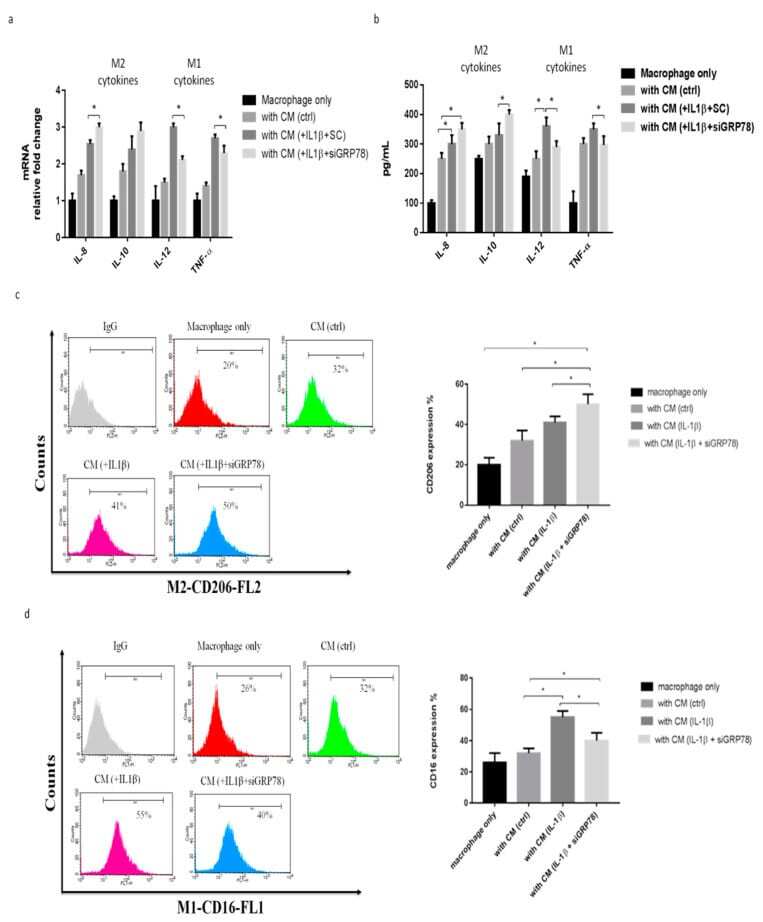
- Figure 2 IL-1beta-treated primary synoviocytes affected M1/M2 polarization. The primary synoviocytes were treated with IL-1beta (10 ng/mL) for 24 h and then replaced with fresh medium; 24 h later, the CM was collected to treat THP-1 cells. ( a ) Quantitative PCR analysis of IL-8, IL-10, IL-12, and TNF-alpha. ( b ) ELISA analysis of IL-8, IL-10, IL-12, and TNF-alpha. ( c , d ) Flow cytometry analysis of the expression of CD206, a marker of M2, and the expression of CD16, a marker of M1. Data are expressed as the mean +- SD, * p < 0.05. IgG as a negative control. The data presented are representative of three independent experiments.
- Conjugate
- Yellow dye
- Submitted by
- Invitrogen Antibodies (provider)
- Main image
- Experimental details
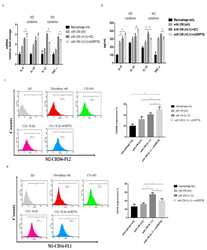
- Figure 4 Knockdown GRP78 in synoviocytes regulated macrophage polarization to promote the M2 phenotype, using knockdown GRP78 in IL-1beta (10 ng/mL) treated synoviocytes. Then, the CM was collected from synoviocytes to treat THP-1 cells. ( a ) Quantitative PCR analysis of IL-8, IL-10, IL-12, and TNF-alpha. ( b ) ELISA analysis of IL-8, IL-10, IL-12, and TNF-alpha. ( c , d ) Flow cytometry analysis of the expression of CD206, a marker of M2, and the expression of CD16, a marker of M1. Data are expressed as mean +- SD, * p < 0.05. IgG as a negative control. The data presented are representative of three independent experiments.
- Conjugate
- Yellow dye
- Submitted by
- Invitrogen Antibodies (provider)
- Main image
- Experimental details
- Figure 6 HMW-HA treatment in synoviocytes affected macrophage polarization toward the M2 phenotype. HMW-HA treated in knockdown GRP78 synoviocytes, and the supernatant was then collected from synoviocytes as CM and then used to treat THP-1. ( a ) Quantitative PCR analysis of IL-8, IL-10, IL-12, and TNF-alpha. ( b ) ELISA analysis of IL-8, IL-10, IL-12, and TNF-alpha. ( c , d ) Flow cytometry analysis of the expression of CD206, a marker of M2, and the expression of CD16, a marker of M1. Data are expressed as a mean +- SD, * p < 0.05. IgG as a negative control. The data presented are representative of three independent experiments.
- Conjugate
- Yellow dye

- Submitted by
- Invitrogen Antibodies (provider)
- Main image

- Experimental details
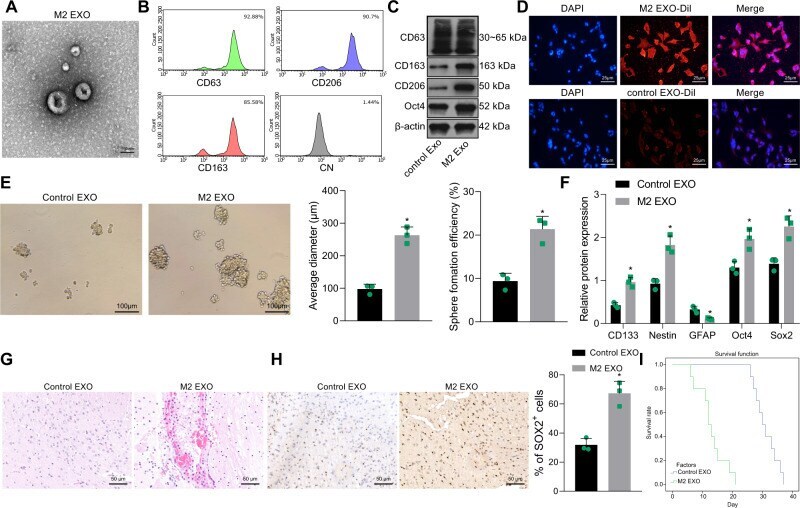
- Fig. 2 M2-TAM-derived exosomes enhance the stemness of GSCs. A TEM images of M2-TAM-derived exosomes. The presence of CD63, CD206, and CD163 in M2-TAM-derived exosomes analyzed by flow cytometric ( B ) and Western blot ( C ) analyses. D Fluorescence images of GSCs co-cultured with Dil-labeled M2-TAM-derived exosomes with nuclei stained with DAPI (blue). E Representative images showing neurosphere formation of GSCs along with the statistics of GSC formation rate and diameter of spheres. F Expression of stem cell-related protein CD133, Nestin, Oct4, Sox2, and GFAP in GSCs measured by Western blot analysis. G HE staining images of xenograft tumors from mice. H The representative immunohistochemical images of Sox2 in xenograft tumors and the percentage of GSCs labeled by Sox2. I Kaplan-Meier survive curve of tumor-bearing mice. n = 10. * p < 0.05 vs. the control EXO group. Measurement data were depicted as mean +- standard deviation, comparison of that between two groups was conducted by unpaired t test. Cell experiments were repeated three times independently.
- Conjugate
- Yellow dye
- Submitted by
- Invitrogen Antibodies (provider)
- Main image

- Experimental details
- FIGURE 2 Flow cytometry analysis of M1 and M2 surface markers (A) The expression of CD86 (M1 surface marker) and CD206 (M2 surface marker) on RAW264.7 cells were examined by flow cytometry. (B) Quantification of mean fluorescence intensity (MFI) of the surface markers ( n = 3, respectively). (C) The expression of CD86 and CD206 on THP-1 cells were examined by flow cytometry. (D) Quantification of mean fluorescence intensity (MFI) of the surface markers ( n = 3, respectively). The results are expressed as the mean values +- S.E.M. * p < 0.05, ** p < 0.01, *** p < 0.001.
- Conjugate
- Yellow dye

- Submitted by
- Invitrogen Antibodies (provider)
- Main image
- Experimental details
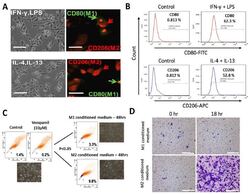
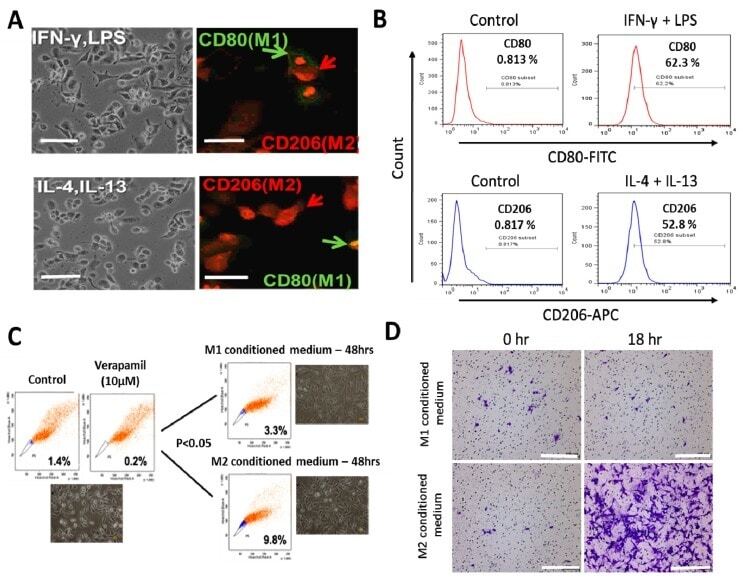
- Figure 1 Differential macrophage response to different inflammatory cytokine stimuli. ( A ) Morphological and immunocytochemical images showing monocyte-derived macrophage (MDM) polarization to M1 or M2 functional phenotype using type 1 cytokine IFN-gamma and lipopolysaccharide (LPS) or type 2 cytokine IL-4 and IL-13, respectively. ( B ) Increases in CD80+ M1 and CD206+ M2 MDMs were seen after treatment with IFN-gamma /LPS or IL-4/IL-13, respectively, using flow-cytometry analysis. Green arrows point to the CD80+ M1 macrophage, while red arrows indicate CD206+ M2 macrophages. ( C ) Flow cytometry and morphology imaging of M1 and M2 cell sorting and isolation using the fluorescence-activated cell sorting (FACS) assay. ( D ) Compared with the H1299 cells treated with M1 conditioned medium, the H1299 cells cultured with M2 conditioned medium exhibited higher invasion ability at 18 h in matrigel study. APC: antigen-presenting cell.
- Conjugate
- Yellow dye
- Submitted by
- Invitrogen Antibodies (provider)
- Main image
- Experimental details
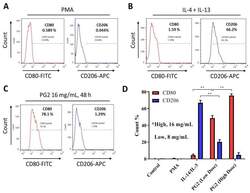
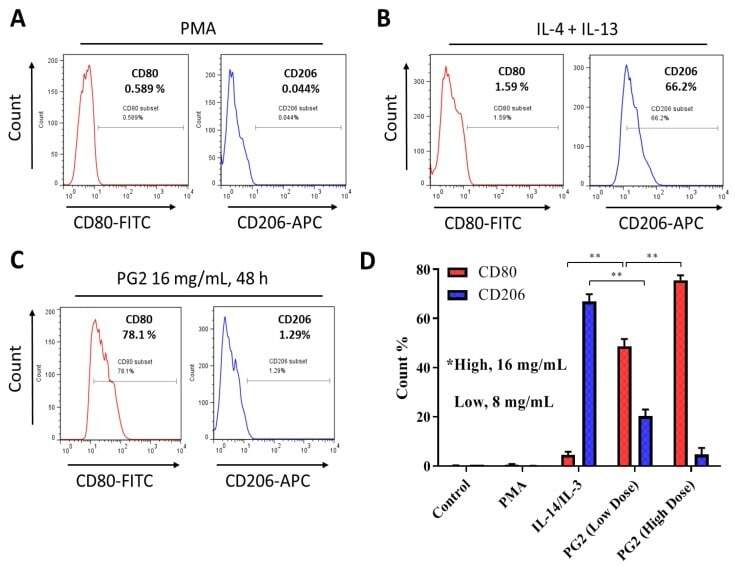
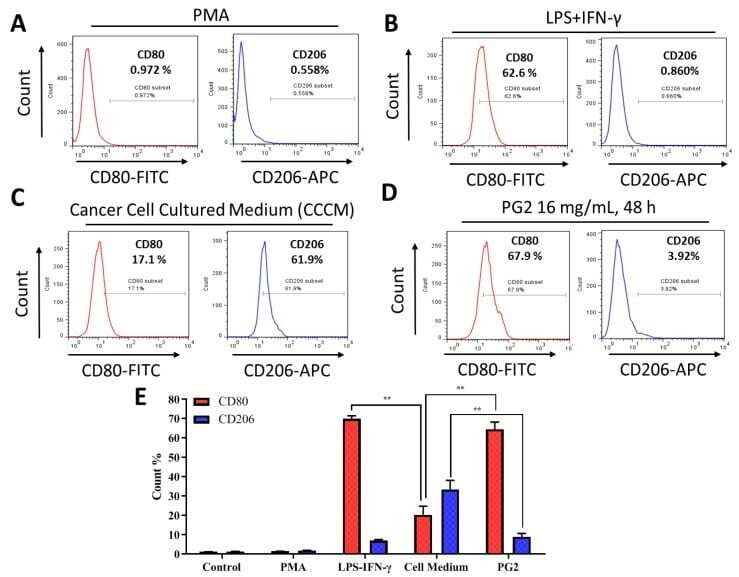
- Figure 2 Astragalus polysaccharide (PG2) enhances M1 polarization and down-regulates IL-4/IL-13-induced M2 polarization. Images from flow cytometric analyses showing ( A ) the differentiation of THP-1 monocyte into macrophages after 24 h incubation in phorbol 12-myristate 13-acetate (PMA), ( B ) incubation of MDM in IL-4 and IL-13 induced a CD206 high CD80 low M2 phenotype, while ( C ) incubation of MDM in PG2 16 mg/mL for 48 h induced a CD80 high CD206 low M1 phenotype. ( D ) A graphical representation of the differential effect of IL-4/IL-13 and low dose (8 mg/mL) or high dose (16 mg/mL) PG2 treatment on M1-M2 polarization. ** p < 0.01
- Conjugate
- Yellow dye
- Submitted by
- Invitrogen Antibodies (provider)
- Main image
- Experimental details
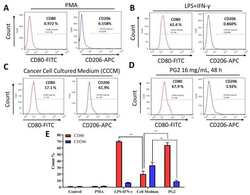
- Figure 3 The enhancement of M1 macrophage polarization by PG2 is akin to the effect of LPS/IFN-gamma stimulation of MDMs. Images from flow cytometric analyses showing ( A ) the differentiation of THP-1 monocyte into macrophages after 24 h incubation in PMA; ( B ) MDMs after exposure to IFN-gamma and LPS induced a CD80 high CD206 low M1 phenotype; ( C ) cancer cell culture medium (CCCM) induced 17.1% CD80+ and 61.9% CD206+ MDMs; ( D ) PG2-treatment of MDMs pre-incubated in CCCM induced a CD80 high CD206 low M1 phenotype, similar to IFN-gamma/LPS exposure; ( E ) a graphical representation of the differential effect of IFN-gamma/LPS, CCCM, and 16 mg/mL PG2 treatment on M1-M2 polarization. PG2 enhanced the M1 phenotype akin to IFN-gamma/LPS exposure effect. ** p < 0.01
- Conjugate
- Yellow dye
- Submitted by
- Invitrogen Antibodies (provider)
- Main image
- Experimental details
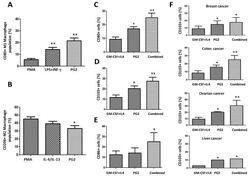
- Figure 6 PG2 modulated the CD80+ M1/CD206+ M2 macrophage population and increased the population of CD80+, CD103+, and CD86+ dendritic cells derived from peripheral blood mononuclear cells (PBMCs) of cancer patient's ex vivo. The effect of PMA, LPS+INF-gamma, or PG2 on the proportion of ( A ) CD80+ and ( B ) CD206+ cells, as shown by flow cytometry. Graphical representation of the effect of PG2 on the population of ( C ) CD80+, ( D ) CD103+, and ( E ) CD86+ dendritic cells derived from GM-CSF+IL-4-treated PBMCs of NSCLC patients. ( F ) Graphical representation of the effect of PG2 on the number of functional CD103+ dendritic cells derived from GM-CSF+IL-4-treated PBMCs of breast, colon, ovarian, or liver patients. 1: GM-CSF+IL4; 2: GM-CSF+IL4, followed by the treatment of PG2 (16 mg/mL); 3: GM-CSF+IL4, washed out, and followed by the treatment of PG2 (16 mg/mL); * p < 0.05, ** p < 0.01.
- Conjugate
- Yellow dye

- Submitted by
- Invitrogen Antibodies (provider)
- Main image
- Experimental details
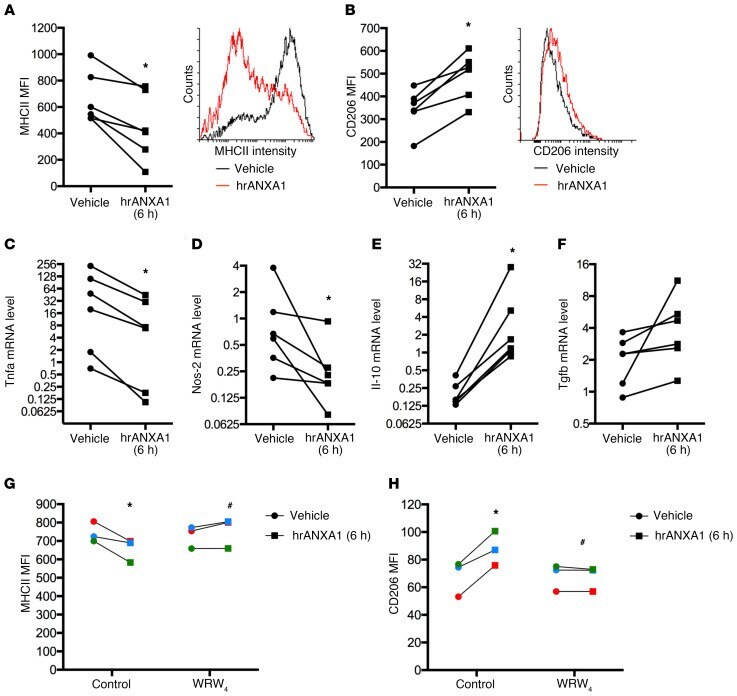
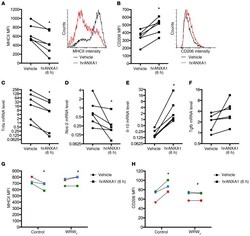
- Figure 3 Exogenous hrANXA1 controls human and mouse macrophage polarization in vitro. Human PBMC-derived macrophages were incubated for 24 hours with lipopolysaccharide plus IFN-gamma to promote an M1-like phenotype, before addition of human recombinant ANXA1 (hrANXA1; 10 nM) for a further 6 hours. ( A and B ) Median fluorescence intensity (MFI) units measured by flow cytometry of MHCII proinflammatory ( A ) and CD206 antiinflammatory ( B ) markers. Shown are MFI quantification (left) and representative FACS plots (right). ( C - F ) Quantitative reverse transcriptase PCR analysis of Tnfa ( C ) and Nos-2 ( D ) proinflammatory genes, and Il-10 ( E ) and Tgfb1 ( F ) antiinflammatory genes. ( G and H ) MFI units as measured by flow cytometry of MHCII proinflammatory ( G ) and CD206 antiinflammatory ( H ) markers after treatment by hrANXA1 in the presence or absence of the FPR2/ALX antagonist WRW 4 (10 muM). Experiments were performed on PBMCs from 6 ( A - F ) or 3 ( G and H ) independent donors. Each color represents an independent PBMC donor. * P < 0.05 vs. vehicle; # P < 0.05 vs. control.
- Conjugate
- Yellow dye