 Explore
 Validate
 Learn
Learn Flow cytometry
Antibody data
- Antibody Data
- Antigen structure
- References [47]
- Comments [0]
- Validations
- Flow cytometry [1]
- Other assay [37]
Submit
Validation data
Reference
Comment
Report error
- Product number
- 17-0459-42 - Provider product page

- Provider
- Invitrogen Antibodies
- Product name
- CD45 Monoclonal Antibody (HI30), APC, eBioscience™
- Antibody type
- Monoclonal
- Antigen
- Other
- Description
- Description: The HI30 monoclonal antibody reacts with all isoforms of human CD45, also known as Leukocyte Common Antigen (LCA). CD45 is expressed by all hematopoietic cells excluding circulating erythrocytes and platelets. The cytoplasmic portion of CD45 has tyrosine phosphatase enzymatic activity and plays an important role in activation of lymphocytes. Applications Reported: The HI30 antibody has been reported for use in flow cytometric analysis. Applications Tested: This HI30 antibody has been pre-titrated and tested by flow cytometric analysis of normal human peripheral blood cells. This can be used at 5 µL (0.06 µg) per test. A test is defined as the amount (µg) of antibody that will stain a cell sample in a final volume of 100 µL. Cell number should be determined empirically but can range from 10^5 to 10^8 cells/test. Excitation: 633-647 nm; Emission: 660 nm; Laser: Red Laser. Filtration: 0.2 µm post-manufacturing filtered.
- Reactivity
- Human
- Host
- Mouse
- Isotype
- IgG
- Antibody clone number
- HI30
- Vial size
- 100 Tests
- Concentration
- 5 µL/Test
- Storage
- 4° C, store in dark, DO NOT FREEZE!
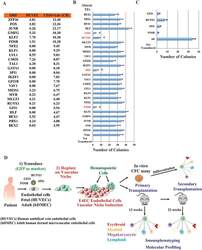
Submitted references Celecoxib induces adipogenic differentiation of hemangioma-derived mesenchymal stem cells through the PPAR-γ pathway in vitro and in vivo.
Mechanical Compression by Simulating Orthodontic Tooth Movement in an In Vitro Model Modulates Phosphorylation of AKT and MAPKs via TLR4 in Human Periodontal Ligament Cells.
Bispecific T-Cell Engaging Antibodies Against MUC16 Demonstrate Efficacy Against Ovarian Cancer in Monotherapy and in Combination With PD-1 and VEGF Inhibition.
An immune-humanized patient-derived xenograft model of estrogen-independent, hormone receptor positive metastatic breast cancer.
In vitro co-culture of human intestinal organoids and lamina propria-derived CD4(+) T cells.
TRPA1 triggers hyperalgesia and inflammation after tooth bleaching.
NASH limits anti-tumour surveillance in immunotherapy-treated HCC.
The novel reversible LSD1 inhibitor SP-2577 promotes anti-tumor immunity in SWItch/Sucrose-NonFermentable (SWI/SNF) complex mutated ovarian cancer.
Evaluation of K18-hACE2 Mice as a Model of SARS-CoV-2 Infection.
Next-generation hypomethylating agent SGI-110 primes acute myeloid leukemia cells to IAP antagonist by activating extrinsic and intrinsic apoptosis pathways.
DKK2 blockage-mediated immunotherapy enhances anti-angiogenic therapy of Kras mutated colorectal cancer.
Patient iPSC-Derived Macrophages to Study Inborn Errors of the IFN-γ Responsive Pathway.
Microsieves for the detection of circulating tumor cells in leukapheresis product in non-small cell lung cancer patients.
Mechanisms of virus dissemination in bone marrow of HIV-1-infected humanized BLT mice.
Expression of Musashi-1 During Osteogenic Differentiation of Oral MSC: An In Vitro Study.
Ultra-High-Frequency Reprogramming of Individual Long-Term Hematopoietic Stem Cells Yields Low Somatic Variant Induced Pluripotent Stem Cells.
Systematic testing and specificity mapping of alloantigen-specific chimeric antigen receptors in regulatory T cells.
LPS‑induced upregulation of the TLR4 signaling pathway inhibits osteogenic differentiation of human periodontal ligament stem cells under inflammatory conditions.
Side-by-side comparison of BH3-mimetics identifies MCL-1 as a key therapeutic target in AML.
Visfatin Mediates Malignant Behaviors through Adipose-Derived Stem Cells Intermediary in Breast Cancer.
Effect of MTA and CEM on Mineralization-Associated Gene Expression in Stem Cells Derived from Apical Papilla.
Single nucleotide variant profiles of viable single circulating tumour cells reveal CTC behaviours in breast cancer.
Clonal evolution mechanisms in NT5C2 mutant-relapsed acute lymphoblastic leukaemia.
Human umbilical cord-derived mesenchymal stem cells ameliorate the enteropathy of food allergies in mice.
Targeted Disruption of TCF12 Reveals HEB as Essential in Human Mesodermal Specification and Hematopoiesis.
A Paradoxical Tumor-Suppressor Role for the Rac1 Exchange Factor Vav1 in T Cell Acute Lymphoblastic Leukemia.
Preferential accumulation of regulatory T cells with highly immunosuppressive characteristics in breast tumor microenvironment.
Evaluation of a simple method for storage of blood samples that enables isolation of circulating tumor cells 96 h after sample collection.
Kinase-independent function of RIP1, critical for mature T-cell survival and proliferation.
Platelets confound the measurement of extracellular miRNA in archived plasma.
Targeting methyltransferase PRMT5 eliminates leukemia stem cells in chronic myelogenous leukemia.
TGF-β Inhibition Rescues Hematopoietic Stem Cell Defects and Bone Marrow Failure in Fanconi Anemia.
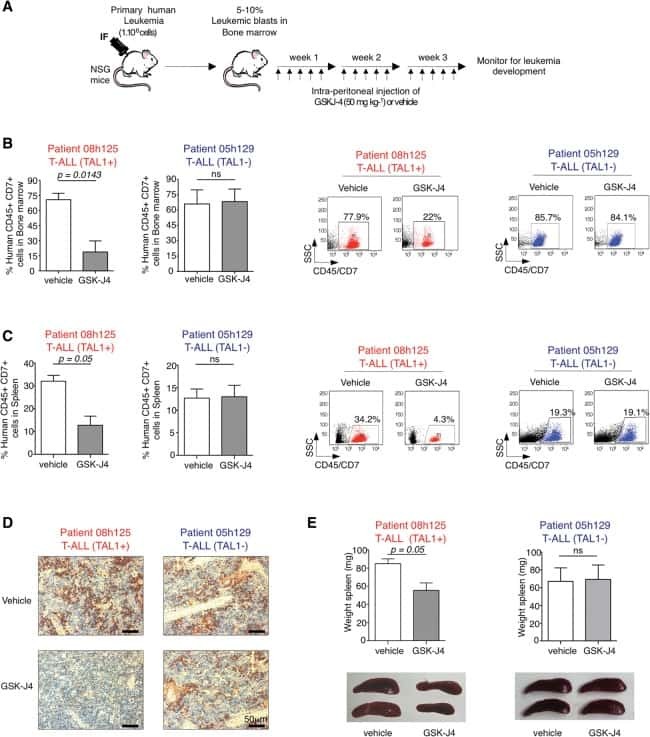
UTX inhibition as selective epigenetic therapy against TAL1-driven T-cell acute lymphoblastic leukemia.
Endothelium-targeted human Delta-like 1 enhances the regeneration and homing of human cord blood stem and progenitor cells.
Circulating tumor cell detection in hepatocellular carcinoma based on karyoplasmic ratios using imaging flow cytometry.
The Public Repository of Xenografts Enables Discovery and Randomized Phase II-like Trials in Mice.
Metabolic reprogramming induces resistance to anti-NOTCH1 therapies in T cell acute lymphoblastic leukemia.
Human esophageal myofibroblasts secrete proinflammatory cytokines in response to acid and Toll-like receptor 4 ligands.
Retinoic acid regulates hematopoietic development from human pluripotent stem cells.
Reprogramming human endothelial cells to haematopoietic cells requires vascular induction.
Hypoxia-cultured human adipose-derived mesenchymal stem cells are non-oncogenic and have enhanced viability, motility, and tropism to brain cancer.
Microvesicles derived from human umbilical cord Wharton's jelly mesenchymal stem cells attenuate bladder tumor cell growth in vitro and in vivo.
Plasmacytoid dendritic cells are scarcely represented in the human gut mucosa and are not recruited to the celiac lesion.
Rapid accumulation of CD14+CD11c+ dendritic cells in gut mucosa of celiac disease after in vivo gluten challenge.
Yield and characterization of subcutaneous human adipose-derived stem cells by flow cytometric and adipogenic mRNA analyzes.
A highly efficient short hairpin RNA potently down-regulates CCR5 expression in systemic lymphoid organs in the hu-BLT mouse model.
A new protocol for multiple inhalation of IFN-gamma successfully treats MDR-TB: a case study.
Wang Y, Kong L, Sun B, Cui J, Shen W
Experimental and therapeutic medicine 2022 Jun;23(6):375
Experimental and therapeutic medicine 2022 Jun;23(6):375
Mechanical Compression by Simulating Orthodontic Tooth Movement in an In Vitro Model Modulates Phosphorylation of AKT and MAPKs via TLR4 in Human Periodontal Ligament Cells.
Roth CE, Craveiro RB, Niederau C, Malyaran H, Neuss S, Jankowski J, Wolf M
International journal of molecular sciences 2022 Jul 22;23(15)
International journal of molecular sciences 2022 Jul 22;23(15)
Bispecific T-Cell Engaging Antibodies Against MUC16 Demonstrate Efficacy Against Ovarian Cancer in Monotherapy and in Combination With PD-1 and VEGF Inhibition.
Yeku OO, Rao TD, Laster I, Kononenko A, Purdon TJ, Wang P, Cui Z, Liu H, Brentjens RJ, Spriggs D
Frontiers in immunology 2021;12:663379
Frontiers in immunology 2021;12:663379
An immune-humanized patient-derived xenograft model of estrogen-independent, hormone receptor positive metastatic breast cancer.
Scherer SD, Riggio AI, Haroun F, DeRose YS, Ekiz HA, Fujita M, Toner J, Zhao L, Li Z, Oesterreich S, Samatar AA, Welm AL
Breast cancer research : BCR 2021 Oct 30;23(1):100
Breast cancer research : BCR 2021 Oct 30;23(1):100
In vitro co-culture of human intestinal organoids and lamina propria-derived CD4(+) T cells.
Schreurs RRCE, Baumdick ME, Drewniak A, Bunders MJ
STAR protocols 2021 Jun 18;2(2):100519
STAR protocols 2021 Jun 18;2(2):100519
TRPA1 triggers hyperalgesia and inflammation after tooth bleaching.
Chen C, Huang X, Zhu W, Ding C, Huang P, Li R
Scientific reports 2021 Aug 31;11(1):17418
Scientific reports 2021 Aug 31;11(1):17418
NASH limits anti-tumour surveillance in immunotherapy-treated HCC.
Pfister D, Núñez NG, Pinyol R, Govaere O, Pinter M, Szydlowska M, Gupta R, Qiu M, Deczkowska A, Weiner A, Müller F, Sinha A, Friebel E, Engleitner T, Lenggenhager D, Moncsek A, Heide D, Stirm K, Kosla J, Kotsiliti E, Leone V, Dudek M, Yousuf S, Inverso D, Singh I, Teijeiro A, Castet F, Montironi C, Haber PK, Tiniakos D, Bedossa P, Cockell S, Younes R, Vacca M, Marra F, Schattenberg JM, Allison M, Bugianesi E, Ratziu V, Pressiani T, D'Alessio A, Personeni N, Rimassa L, Daly AK, Scheiner B, Pomej K, Kirstein MM, Vogel A, Peck-Radosavljevic M, Hucke F, Finkelmeier F, Waidmann O, Trojan J, Schulze K, Wege H, Koch S, Weinmann A, Bueter M, Rössler F, Siebenhüner A, De Dosso S, Mallm JP, Umansky V, Jugold M, Luedde T, Schietinger A, Schirmacher P, Emu B, Augustin HG, Billeter A, Müller-Stich B, Kikuchi H, Duda DG, Kütting F, Waldschmidt DT, Ebert MP, Rahbari N, Mei HE, Schulz AR, Ringelhan M, Malek N, Spahn S, Bitzer M, Ruiz de Galarreta M, Lujambio A, Dufour JF, Marron TU, Kaseb A, Kudo M, Huang YH, Djouder N, Wolter K, Zender L, Marche PN, Decaens T, Pinato DJ, Rad R, Mertens JC, Weber A, Unger K, Meissner F, Roth S, Jilkova ZM, Claassen M, Anstee QM, Amit I, Knolle P, Becher B, Llovet JM, Heikenwalder M
Nature 2021 Apr;592(7854):450-456
Nature 2021 Apr;592(7854):450-456
The novel reversible LSD1 inhibitor SP-2577 promotes anti-tumor immunity in SWItch/Sucrose-NonFermentable (SWI/SNF) complex mutated ovarian cancer.
Soldi R, Ghosh Halder T, Weston A, Thode T, Drenner K, Lewis R, Kaadige MR, Srivastava S, Daniel Ampanattu S, Rodriguez Del Villar R, Lang J, Vankayalapati H, Weissman B, Trent JM, Hendricks WPD, Sharma S
PloS one 2020;15(7):e0235705
PloS one 2020;15(7):e0235705
Evaluation of K18-hACE2 Mice as a Model of SARS-CoV-2 Infection.
Moreau GB, Burgess SL, Sturek JM, Donlan AN, Petri WA, Mann BJ
The American journal of tropical medicine and hygiene 2020 Sep;103(3):1215-1219
The American journal of tropical medicine and hygiene 2020 Sep;103(3):1215-1219
Next-generation hypomethylating agent SGI-110 primes acute myeloid leukemia cells to IAP antagonist by activating extrinsic and intrinsic apoptosis pathways.
Dittmann J, Haydn T, Metzger P, Ward GA, Boerries M, Vogler M, Fulda S
Cell death and differentiation 2020 Jun;27(6):1878-1895
Cell death and differentiation 2020 Jun;27(6):1878-1895
DKK2 blockage-mediated immunotherapy enhances anti-angiogenic therapy of Kras mutated colorectal cancer.
Hu J, Wang Z, Chen Z, Li A, Sun J, Zheng M, Wu J, Shen T, Qiao J, Li L, Li B, Wu D, Xiao Q
Biomedicine & pharmacotherapy = Biomedecine & pharmacotherapie 2020 Jul;127:110229
Biomedicine & pharmacotherapy = Biomedecine & pharmacotherapie 2020 Jul;127:110229
Patient iPSC-Derived Macrophages to Study Inborn Errors of the IFN-γ Responsive Pathway.
Haake K, Neehus AL, Buchegger T, Kühnel MP, Blank P, Philipp F, Oleaga-Quintas C, Schulz A, Grimley M, Goethe R, Jonigk D, Kalinke U, Boisson-Dupuis S, Casanova JL, Bustamante J, Lachmann N
Cells 2020 Feb 19;9(2)
Cells 2020 Feb 19;9(2)
Microsieves for the detection of circulating tumor cells in leukapheresis product in non-small cell lung cancer patients.
Tamminga M, Oomens L, Hiltermann TJN, Andree KC, Tibbe A, Broekmaat J, Schuuring E, Terstappen LWMM, Groen HJM
Translational lung cancer research 2020 Aug;9(4):1093-1100
Translational lung cancer research 2020 Aug;9(4):1093-1100
Mechanisms of virus dissemination in bone marrow of HIV-1-infected humanized BLT mice.
Ladinsky MS, Khamaikawin W, Jung Y, Lin S, Lam J, An DS, Bjorkman PJ, Kieffer C
eLife 2019 Oct 28;8
eLife 2019 Oct 28;8
Expression of Musashi-1 During Osteogenic Differentiation of Oral MSC: An In Vitro Study.
Padial-Molina M, de Buitrago JG, Sainz-Urruela R, Abril-Garcia D, Anderson P, O'Valle F, Galindo-Moreno P
International journal of molecular sciences 2019 May 2;20(9)
International journal of molecular sciences 2019 May 2;20(9)
Ultra-High-Frequency Reprogramming of Individual Long-Term Hematopoietic Stem Cells Yields Low Somatic Variant Induced Pluripotent Stem Cells.
Wang K, Guzman AK, Yan Z, Zhang S, Hu MY, Hamaneh MB, Yu YK, Tolu S, Zhang J, Kanavy HE, Ye K, Bartholdy B, Bouhassira EE
Cell reports 2019 Mar 5;26(10):2580-2592.e7
Cell reports 2019 Mar 5;26(10):2580-2592.e7
Systematic testing and specificity mapping of alloantigen-specific chimeric antigen receptors in regulatory T cells.
Dawson NA, Lamarche C, Hoeppli RE, Bergqvist P, Fung VC, McIver E, Huang Q, Gillies J, Speck M, Orban PC, Bush JW, Mojibian M, Levings MK
JCI insight 2019 Mar 21;4(6)
JCI insight 2019 Mar 21;4(6)
LPS‑induced upregulation of the TLR4 signaling pathway inhibits osteogenic differentiation of human periodontal ligament stem cells under inflammatory conditions.
Yu B, Li Q, Zhou M
International journal of molecular medicine 2019 Jun;43(6):2341-2351
International journal of molecular medicine 2019 Jun;43(6):2341-2351
Side-by-side comparison of BH3-mimetics identifies MCL-1 as a key therapeutic target in AML.
Ewald L, Dittmann J, Vogler M, Fulda S
Cell death & disease 2019 Dec 4;10(12):917
Cell death & disease 2019 Dec 4;10(12):917
Visfatin Mediates Malignant Behaviors through Adipose-Derived Stem Cells Intermediary in Breast Cancer.
Huang JY, Wang YY, Lo S, Tseng LM, Chen DR, Wu YC, Hou MF, Yuan SF
Cancers 2019 Dec 20;12(1)
Cancers 2019 Dec 20;12(1)
Effect of MTA and CEM on Mineralization-Associated Gene Expression in Stem Cells Derived from Apical Papilla.
Hajizadeh N, Madani ZS, Zabihi E, Golpour M, Zahedpasha A, Mohammadnia M
Iranian endodontic journal 2018 Winter;13(1):94-101
Iranian endodontic journal 2018 Winter;13(1):94-101
Single nucleotide variant profiles of viable single circulating tumour cells reveal CTC behaviours in breast cancer.
Wang Y, Guo L, Feng L, Zhang W, Xiao T, Di X, Chen G, Zhang K
Oncology reports 2018 May;39(5):2147-2159
Oncology reports 2018 May;39(5):2147-2159
Clonal evolution mechanisms in NT5C2 mutant-relapsed acute lymphoblastic leukaemia.
Tzoneva G, Dieck CL, Oshima K, Ambesi-Impiombato A, Sánchez-Martín M, Madubata CJ, Khiabanian H, Yu J, Waanders E, Iacobucci I, Sulis ML, Kato M, Koh K, Paganin M, Basso G, Gastier-Foster JM, Loh ML, Kirschner-Schwabe R, Mullighan CG, Rabadan R, Ferrando AA
Nature 2018 Jan 25;553(7689):511-514
Nature 2018 Jan 25;553(7689):511-514
Human umbilical cord-derived mesenchymal stem cells ameliorate the enteropathy of food allergies in mice.
Yan N, Xu J, Zhao C, Wu Y, Gao F, Li C, Zhou W, Xiao T, Zhou X, Shao Q, Xia S
Experimental and therapeutic medicine 2018 Dec;16(6):4445-4456
Experimental and therapeutic medicine 2018 Dec;16(6):4445-4456
Targeted Disruption of TCF12 Reveals HEB as Essential in Human Mesodermal Specification and Hematopoiesis.
Li Y, Brauer PM, Singh J, Xhiku S, Yoganathan K, Zúñiga-Pflücker JC, Anderson MK
Stem cell reports 2017 Sep 12;9(3):779-795
Stem cell reports 2017 Sep 12;9(3):779-795
A Paradoxical Tumor-Suppressor Role for the Rac1 Exchange Factor Vav1 in T Cell Acute Lymphoblastic Leukemia.
Robles-Valero J, Lorenzo-Martín LF, Menacho-Márquez M, Fernández-Pisonero I, Abad A, Camós M, Toribio ML, Espinosa L, Bigas A, Bustelo XR
Cancer cell 2017 Nov 13;32(5):608-623.e9
Cancer cell 2017 Nov 13;32(5):608-623.e9
Preferential accumulation of regulatory T cells with highly immunosuppressive characteristics in breast tumor microenvironment.
Syed Khaja AS, Toor SM, El Salhat H, Faour I, Ul Haq N, Ali BR, Elkord E
Oncotarget 2017 May 16;8(20):33159-33171
Oncotarget 2017 May 16;8(20):33159-33171
Evaluation of a simple method for storage of blood samples that enables isolation of circulating tumor cells 96 h after sample collection.
Apostolou P, Ntanovasilis DA, Papasotiriou I
Journal of biological research (Thessalonike, Greece) 2017 Dec;24:11
Journal of biological research (Thessalonike, Greece) 2017 Dec;24:11
Kinase-independent function of RIP1, critical for mature T-cell survival and proliferation.
Dowling JP, Cai Y, Bertin J, Gough PJ, Zhang J
Cell death & disease 2016 Sep 29;7(9):e2379
Cell death & disease 2016 Sep 29;7(9):e2379
Platelets confound the measurement of extracellular miRNA in archived plasma.
Mitchell AJ, Gray WD, Hayek SS, Ko YA, Thomas S, Rooney K, Awad M, Roback JD, Quyyumi A, Searles CD
Scientific reports 2016 Sep 13;6:32651
Scientific reports 2016 Sep 13;6:32651
Targeting methyltransferase PRMT5 eliminates leukemia stem cells in chronic myelogenous leukemia.
Jin Y, Zhou J, Xu F, Jin B, Cui L, Wang Y, Du X, Li J, Li P, Ren R, Pan J
The Journal of clinical investigation 2016 Oct 3;126(10):3961-3980
The Journal of clinical investigation 2016 Oct 3;126(10):3961-3980
TGF-β Inhibition Rescues Hematopoietic Stem Cell Defects and Bone Marrow Failure in Fanconi Anemia.
Zhang H, Kozono DE, O'Connor KW, Vidal-Cardenas S, Rousseau A, Hamilton A, Moreau L, Gaudiano EF, Greenberger J, Bagby G, Soulier J, Grompe M, Parmar K, D'Andrea AD
Cell stem cell 2016 May 5;18(5):668-81
Cell stem cell 2016 May 5;18(5):668-81
UTX inhibition as selective epigenetic therapy against TAL1-driven T-cell acute lymphoblastic leukemia.
Benyoucef A, Palii CG, Wang C, Porter CJ, Chu A, Dai F, Tremblay V, Rakopoulos P, Singh K, Huang S, Pflumio F, Hébert J, Couture JF, Perkins TJ, Ge K, Dilworth FJ, Brand M
Genes & development 2016 Mar 1;30(5):508-21
Genes & development 2016 Mar 1;30(5):508-21
Endothelium-targeted human Delta-like 1 enhances the regeneration and homing of human cord blood stem and progenitor cells.
Tian DM, Liang YM, Zhang YQ
Journal of translational medicine 2016 Jan 6;14:5
Journal of translational medicine 2016 Jan 6;14:5
Circulating tumor cell detection in hepatocellular carcinoma based on karyoplasmic ratios using imaging flow cytometry.
Liu Z, Guo W, Zhang D, Pang Y, Shi J, Wan S, Cheng K, Wang J, Cheng S
Scientific reports 2016 Dec 23;6:39808
Scientific reports 2016 Dec 23;6:39808
The Public Repository of Xenografts Enables Discovery and Randomized Phase II-like Trials in Mice.
Townsend EC, Murakami MA, Christodoulou A, Christie AL, Köster J, DeSouza TA, Morgan EA, Kallgren SP, Liu H, Wu SC, Plana O, Montero J, Stevenson KE, Rao P, Vadhi R, Andreeff M, Armand P, Ballen KK, Barzaghi-Rinaudo P, Cahill S, Clark RA, Cooke VG, Davids MS, DeAngelo DJ, Dorfman DM, Eaton H, Ebert BL, Etchin J, Firestone B, Fisher DC, Freedman AS, Galinsky IA, Gao H, Garcia JS, Garnache-Ottou F, Graubert TA, Gutierrez A, Halilovic E, Harris MH, Herbert ZT, Horwitz SM, Inghirami G, Intlekofer AM, Ito M, Izraeli S, Jacobsen ED, Jacobson CA, Jeay S, Jeremias I, Kelliher MA, Koch R, Konopleva M, Kopp N, Kornblau SM, Kung AL, Kupper TS, LeBoeuf NR, LaCasce AS, Lees E, Li LS, Look AT, Murakami M, Muschen M, Neuberg D, Ng SY, Odejide OO, Orkin SH, Paquette RR, Place AE, Roderick JE, Ryan JA, Sallan SE, Shoji B, Silverman LB, Soiffer RJ, Steensma DP, Stegmaier K, Stone RM, Tamburini J, Thorner AR, van Hummelen P, Wadleigh M, Wiesmann M, Weng AP, Wuerthner JU, Williams DA, Wollison BM, Lane AA, Letai A, Bertagnolli MM, Ritz J, Brown M, Long H, Aster JC, Shipp MA, Griffin JD, Weinstock DM
Cancer cell 2016 Apr 11;29(4):574-586
Cancer cell 2016 Apr 11;29(4):574-586
Metabolic reprogramming induces resistance to anti-NOTCH1 therapies in T cell acute lymphoblastic leukemia.
Herranz D, Ambesi-Impiombato A, Sudderth J, Sánchez-Martín M, Belver L, Tosello V, Xu L, Wendorff AA, Castillo M, Haydu JE, Márquez J, Matés JM, Kung AL, Rayport S, Cordon-Cardo C, DeBerardinis RJ, Ferrando AA
Nature medicine 2015 Oct;21(10):1182-9
Nature medicine 2015 Oct;21(10):1182-9
Human esophageal myofibroblasts secrete proinflammatory cytokines in response to acid and Toll-like receptor 4 ligands.
Gargus M, Niu C, Vallone JG, Binkley J, Rubin DC, Shaker A
American journal of physiology. Gastrointestinal and liver physiology 2015 Jun 1;308(11):G904-23
American journal of physiology. Gastrointestinal and liver physiology 2015 Jun 1;308(11):G904-23
Retinoic acid regulates hematopoietic development from human pluripotent stem cells.
Rönn RE, Guibentif C, Moraghebi R, Chaves P, Saxena S, Garcia B, Woods NB
Stem cell reports 2015 Feb 10;4(2):269-81
Stem cell reports 2015 Feb 10;4(2):269-81
Reprogramming human endothelial cells to haematopoietic cells requires vascular induction.
Sandler VM, Lis R, Liu Y, Kedem A, James D, Elemento O, Butler JM, Scandura JM, Rafii S
Nature 2014 Jul 17;511(7509):312-8
Nature 2014 Jul 17;511(7509):312-8
Hypoxia-cultured human adipose-derived mesenchymal stem cells are non-oncogenic and have enhanced viability, motility, and tropism to brain cancer.
Feng Y, Zhu M, Dangelmajer S, Lee YM, Wijesekera O, Castellanos CX, Denduluri A, Chaichana KL, Li Q, Zhang H, Levchenko A, Guerrero-Cazares H, Quiñones-Hinojosa A
Cell death & disease 2014 Dec 11;5(12):e1567
Cell death & disease 2014 Dec 11;5(12):e1567
Microvesicles derived from human umbilical cord Wharton's jelly mesenchymal stem cells attenuate bladder tumor cell growth in vitro and in vivo.
Wu S, Ju GQ, Du T, Zhu YJ, Liu GH
PloS one 2013;8(4):e61366
PloS one 2013;8(4):e61366
Plasmacytoid dendritic cells are scarcely represented in the human gut mucosa and are not recruited to the celiac lesion.
Ráki M, Beitnes AC, Lundin KE, Jahnsen J, Jahnsen FL, Sollid LM
Mucosal immunology 2013 Sep;6(5):985-92
Mucosal immunology 2013 Sep;6(5):985-92
Rapid accumulation of CD14+CD11c+ dendritic cells in gut mucosa of celiac disease after in vivo gluten challenge.
Beitnes AC, Ráki M, Brottveit M, Lundin KE, Jahnsen FL, Sollid LM
PloS one 2012;7(3):e33556
PloS one 2012;7(3):e33556
Yield and characterization of subcutaneous human adipose-derived stem cells by flow cytometric and adipogenic mRNA analyzes.
Yu G, Wu X, Dietrich MA, Polk P, Scott LK, Ptitsyn AA, Gimble JM
Cytotherapy 2010 Jul;12(4):538-46
Cytotherapy 2010 Jul;12(4):538-46
A highly efficient short hairpin RNA potently down-regulates CCR5 expression in systemic lymphoid organs in the hu-BLT mouse model.
Shimizu S, Hong P, Arumugam B, Pokomo L, Boyer J, Koizumi N, Kittipongdaja P, Chen A, Bristol G, Galic Z, Zack JA, Yang O, Chen IS, Lee B, An DS
Blood 2010 Feb 25;115(8):1534-44
Blood 2010 Feb 25;115(8):1534-44
A new protocol for multiple inhalation of IFN-gamma successfully treats MDR-TB: a case study.
Grahmann PR, Braun RK
The international journal of tuberculosis and lung disease : the official journal of the International Union against Tuberculosis and Lung Disease 2008 Jun;12(6):636-44
The international journal of tuberculosis and lung disease : the official journal of the International Union against Tuberculosis and Lung Disease 2008 Jun;12(6):636-44
No comments: Submit comment
Supportive validation
- Submitted by
- Invitrogen Antibodies (provider)
- Main image
- Experimental details
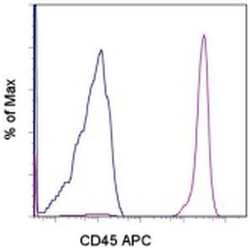
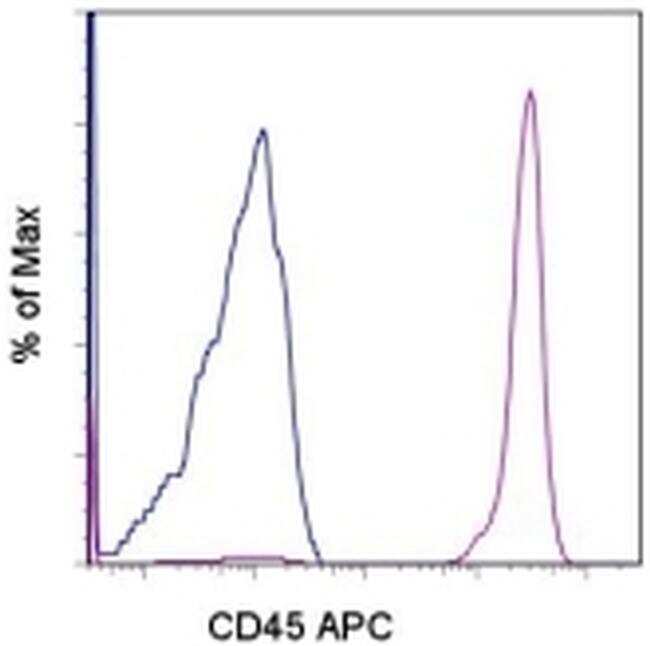
- Staining of normal human peripheral blood cells with Mouse IgG1 K Isotype Control APC (Product # 17-4714-81) (blue histogram) or Anti-Human CD45 APC (purple histogram). Cells in the lymphocyte gate were used for analysis.
Supportive validation
- Submitted by
- Invitrogen Antibodies (provider)
- Main image
- Experimental details
- NULL
- Submitted by
- Invitrogen Antibodies (provider)
- Main image
- Experimental details
- NULL
- Submitted by
- Invitrogen Antibodies (provider)
- Main image
- Experimental details
- NULL
- Submitted by
- Invitrogen Antibodies (provider)
- Main image
- Experimental details
- NULL
- Submitted by
- Invitrogen Antibodies (provider)
- Main image
- Experimental details
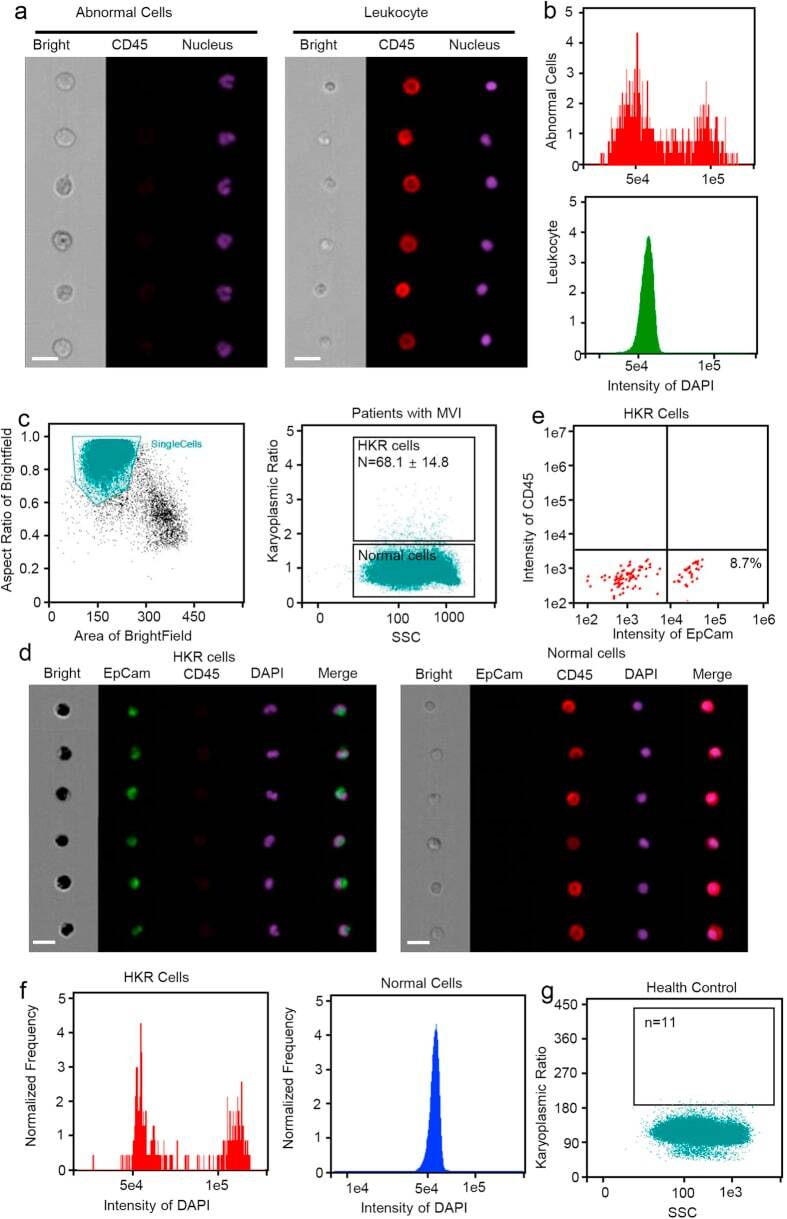
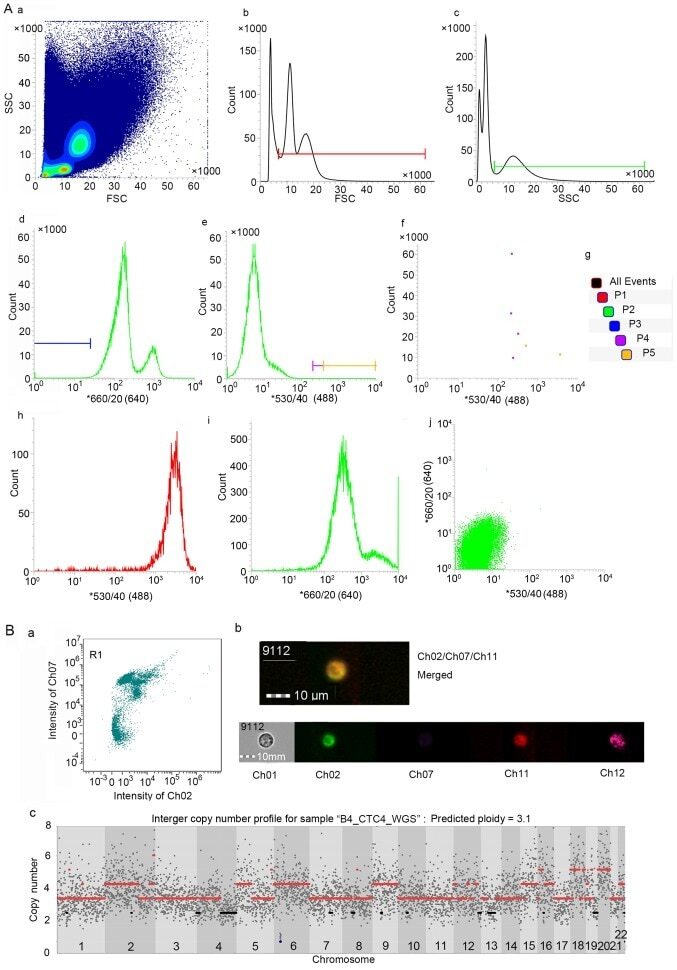
- Figure 1 Detection of cells with abnormal nuclei using imaging flow cytometry. ( a ) Representative cell images with the same DAPI intensity. CD45, a lymphocyte biomarker, was labeled with PE-Cy5. Upper panel: CD45 + lymphocyte with a smaller DAPI area. Lower panel: CD45 - cells with a larger DAPI area, showing a looser structure of nuclei. Scale bars represent 20 mum. ( b ) Mean DAPI fluorescence intensity in PBMCs. Unlike the cells with a normal DAPI area (lower panel), a G1 and G2 peak could be detected in the cells with larger DAPI areas (upper panel). ( c ) Imaging flow cytometry test results for the peripheral blood samples from MVI patients. Left panel, basic results for peripheral blood mononuclear cells (PBMCs), the horizontal axis indicates the cell area and the vertical axis indicates the aspect ratio. The gate displays the group of single cells. Right panel: patients with MVI had 68.1 +- 14.8 cells with large DAPI areas. ( d ) Representative images for PBMCs from HCC patients. CD45, a lymphocyte biomarker, was labeled with PE-Cy5. EpCAM, a biomarker of circulating tumor cells (CTCs), was labeled with FITC. Left panel: cells with high karyoplasmic ratios (HKR cells), which were EpCAM-positive and CD45-negative. Right panel: cells with normal karyoplasmic ratios (normal cells), which were EpCAM-negative and CD45-positive. Scale bars represent 20 mum. ( e ) Flow cytometry test results for HKR cells from MVI patients. All HKR cells were CD45 - , but only 8.7% of HKR c
- Submitted by
- Invitrogen Antibodies (provider)
- Main image
- Experimental details
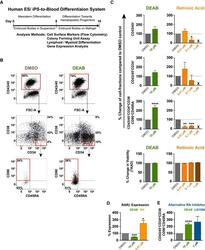
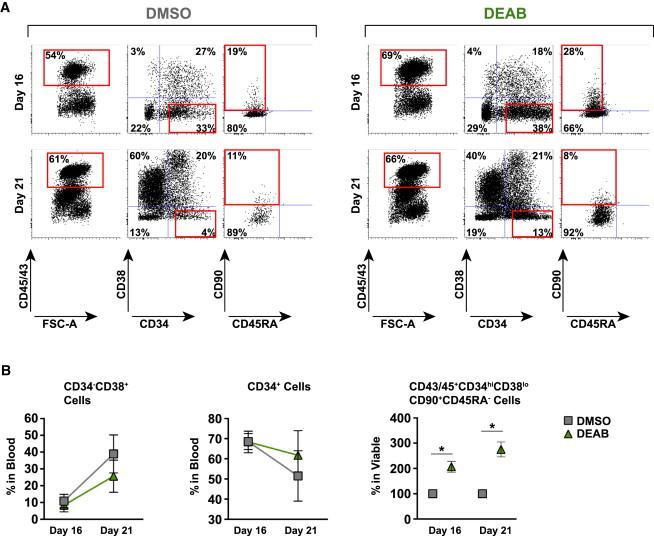
- Figure 1 Retinoic Acid Signaling Inhibition Increases the Yield of Hematopoietic Progenitors with an HSC-like Phenotype from Human Pluripotent Stem Cells (A) Schematic of pluripotent stem cell differentiation system used to model human hematopoietic development through mesoderm specification and blood commitment. RA inhibitors or RA was present continuously during the 16-day differentiation, except where otherwise stated. (B) Representative FACS plots showing the hematopoietic population derived from pluripotent stem cells at day 16 of differentiation. FACS gates show blood (CD45/43 + ), hematopoietic progenitors (CD45/43 + CD34 + ), and HSC-like immature progenitors (CD45/43 + CD34 hi CD38 lo CD90 + CD45RA - ). Gates are based on FMO controls with more stringent CD34 hi and CD38 lo gating based on cord blood hematopoietic stem and progenitor cell standards. Doublet exclusion and dead cell exclusion were done before applying the gates. (C) Frequency (%) of blood subfractions derived from cells treated with DEAB (green) at 10 muM from seven independent experiments (n = 7) (see also Figures S1 A and S1B) or RA (orange) (0.01, 0.1, 1.0 muM; n = 3). All values are normalized to the DMSO control (gray) as indicated by the dotted line (100%). X = no events. Bar graphs show change in cell viability as measured by 7AAD for tested conditions. (D) mRNA expression level of RA target gene RARbeta at day 8 of differentiation (n = 3). (E) Frequency of the HSC-like fraction in cells treated

- Submitted by
- Invitrogen Antibodies (provider)
- Main image

- Experimental details
- Figure 2. Feasible method to detect and isolate CTCs. (A) Gates were set to capture viable CTCs via FACS analysis. (A-b) The P1 gate was set to obtain cells with diameters larger than lymphocytes, and (A-c) the P2 gate was set to acquire granulocyte-like side scatter (SSC) cells. (A-a) P1 was combined with P2 to capture viable cells similar to tumour cells in size and SSC. (A-d and -f) The P3 and P4 gates were used to select hTERT-positive cells without leucocyte-common antigen (CD45) expression and collect highly hTERT-positive cells for further analysis. (A-e and -f) The sorted cells were detected at P5 gate (taking partial results from patient B1 for example). (A-i) The single-stained CD45-APC positive control of PBMC and (A-j) the infected control, including negative control (peripheral blood of a healthy person), (A-h) positive control (the hTERT-expressing SK-BR-3 cancer cell line). (B) Analysis of circulating breast tumour cells using imaging flow cytometry. (B-a) Cell image mapped with the point in the bottom right corner of R1 gate (high signal captured in ch02 and low signal captured in ch07, corresponding to the gate P5). Ch02 received signal emitted by GFP (hTERT), ch07 reflects the signal intensity of eFluor450 (CD45), ch11 represents the APC (ErbB2) intensity and ch12 is the SSC channel. (B-b) The merged image represents hTERT + CD45-ErbB2 + cells. (B-c) The copy number profiles of a near-triploid CTC.
- Submitted by
- Invitrogen Antibodies (provider)
- Main image
- Experimental details
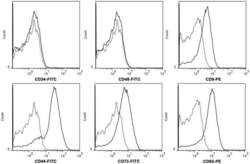
- Figure 2 hWJMSC-MVs surface expressed molecules analysis. Flow cytometery analysis showed hWJMSC-MVs were positive for some surface expressed molecules typically expressed by MSCs, such as CD9, CD44, CD63, CD73, and negative for CD34, CD45.

- Submitted by
- Invitrogen Antibodies (provider)
- Main image
- Experimental details
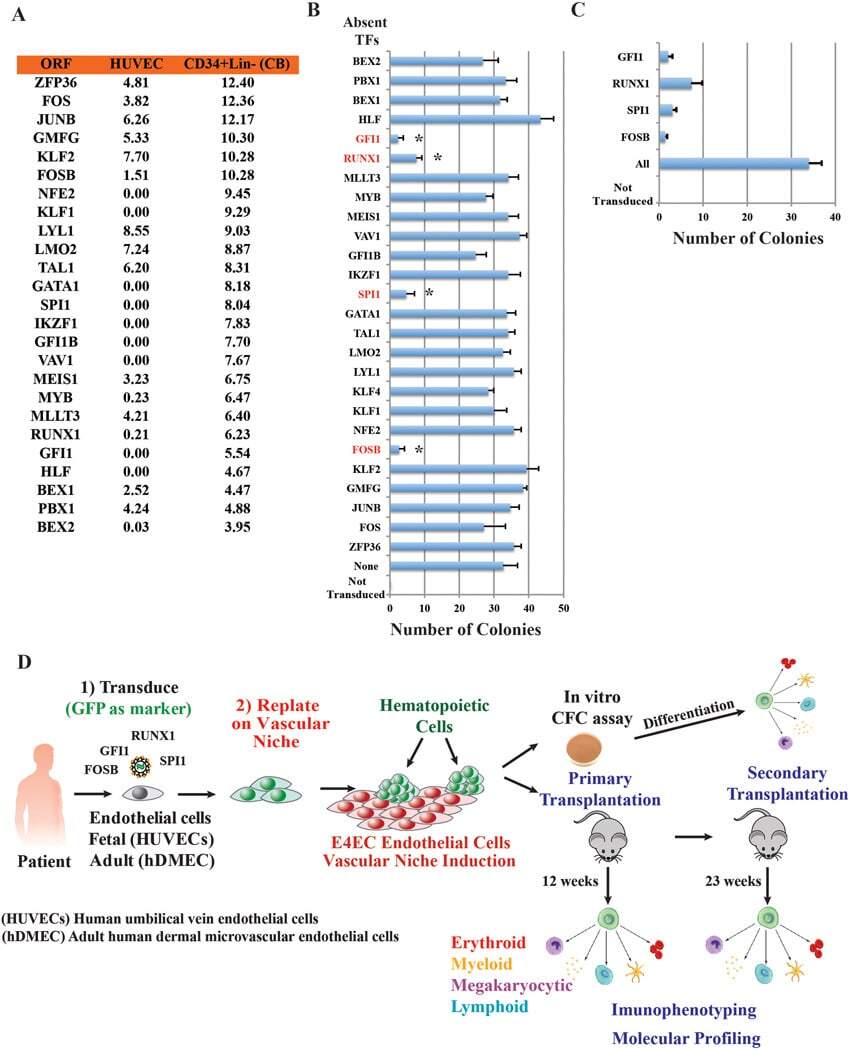
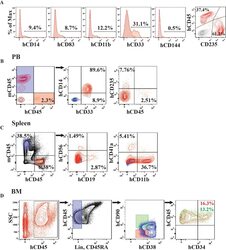
- Extended Data Figure 6 Conditional expression of FGRS is sufficient for optimal generation of rEC-hMPPs with multilineage potential, including T-Cell lymphoid cells A to C: Conditional expression of mouse inducible FGRS factors activates endogenous human FGRS in HUVECs sustaining functional hematopoietic cell fate of rEC-hMPPs. A . To test whether FGRS-induced reprogramming triggered expression of endogenous FGRS genes , HUVECs were transduced with lentivirus expressing FGRS-Tet-On and a trans-activator, and grown on E4EC-vascular niche for 18-22 days (n=4) in the presence of doxycycline. Doxycycline was removed from the culture medium after 18-22 days to shut off the expression of mouse FGRS and cells were cultured for additional 7-10 days. Human CD45 + CD34 + cells were FACS isolated for CFC assay and whole-transcriptome deep sequencing (RNA-seq). CFC assay revealed emergence of hematopoietic colonies with cells expressing human CD235, CD11b, CD83, and CD14. B . Comparison of transcriptional profiles of the human FGRS expression in human HUVECs, hCD45 + rEC-hMPPs programmed using inducible mouse FGRS, CD45 + CD34 + rEC-hMPPs, 22 weeks post-transplantation, hDMEC-derived CD45 + CD34 + rEC - hMPPs after 15 weeks post-secondary engraftment and naive CD34 + Lin + cells purified from cord blood. C . Analysis of whole-transcriptome RNA-Seq of rEC-hMPPs derived using inducible mouse FGRS (n=3). All RNA-Seq reads were aligned against human and mouse FGRS sequences. RNA-Seq reads th
- Submitted by
- Invitrogen Antibodies (provider)
- Main image
- Experimental details
- Extended Data Figure 2 FGRS-transduction and vascular-induction reprogram HUVECs, but not hES-ECs, to proliferating functional rEC-MPPs A. Multi-colony niche-like structure that physically separates developing hematopoietic colonies from surrounding E4EC vascular niche . The emerging multi-colony sinusoidal-like structures create a unique cellular interface between E4EC monolayers and transduced ECs giving rise to hematopoietic clusters (n=4, scale bar is 1000 um.) B. Expansion potential of reprogrammed CD45 + hematopoietic cells . CD45 + (12x103) and CD45- (60 x10 3 ) cells were sorted into separate wells and expanded for two days. We observed 5-fold expansion of CD45 + cells (56.6 x10 3 +-7.9 x10 3 ; n=3) and dramatic reduction of CD45 - cells number (4.6x10 3 +-1.0 x10 3 ; n=3). C . Clonal expansion of CD45 + cells. CD45 + cells were FACS sorted into 96-well plates at the density of 1 and 2 cells/well. After seven days of culture, we observed CD45 + cell expansion in 6.3+-2.1 wells (93.1+-14.5 cells/well) of 1-cell sort and 29.0+-4.3 wells (112.1+-21.2 cells/well) of the 2-cell sort (n=3). The difference between cell number in 1 and 2-cell sort was statistically not significant (p=0.78) suggesting that the difference in the number of wells with detected cell expansion was rather due to survival of sorted cells than a reflection of the number of cells sorted into a well. D. FGRS-induced generation of hematopoietic cells by hES-derived endothelium (hES-EC) . Representative e
- Submitted by
- Invitrogen Antibodies (provider)
- Main image
- Experimental details
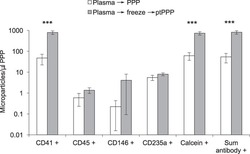
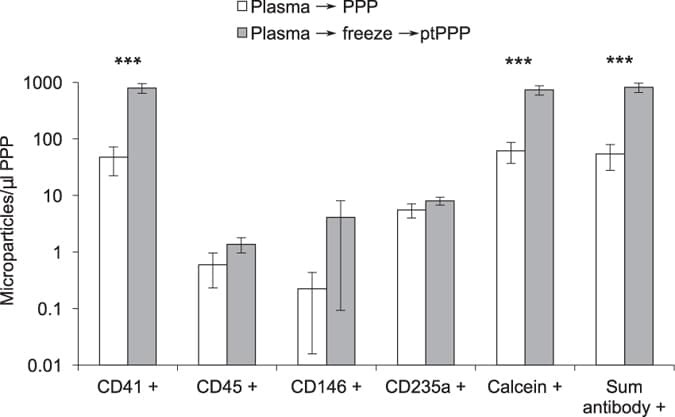
- Figure 3 Freeze/thaw of standard plasma increased platelet MPs in platelet poor plasma (PPP). Standard plasma from six healthy volunteers was either immediately processed to PPP or exposed to a single freeze/thaw cycle prior to a second centrifugation step to remove residual platelets. Platelet (CD41+), leukocyte (CD45+), endothelial (CD146+), and RBC (CD235a) MPs were quantified by flow cytometry. Total number of MPs in a sample was either calculated by the sum of positive events detected by antibody staining (Sum antibody+) or measured by staining with calcein-AM, a non-specific dye that fluorescently labels intact vesicles. Results were similar and showed marked increase after freeze-thaw of standard plasma *** indicates P < 0.001. This effect was largely due to an increase in platelet derived MPs (CD41+).
- Submitted by
- Invitrogen Antibodies (provider)
- Main image

- Experimental details
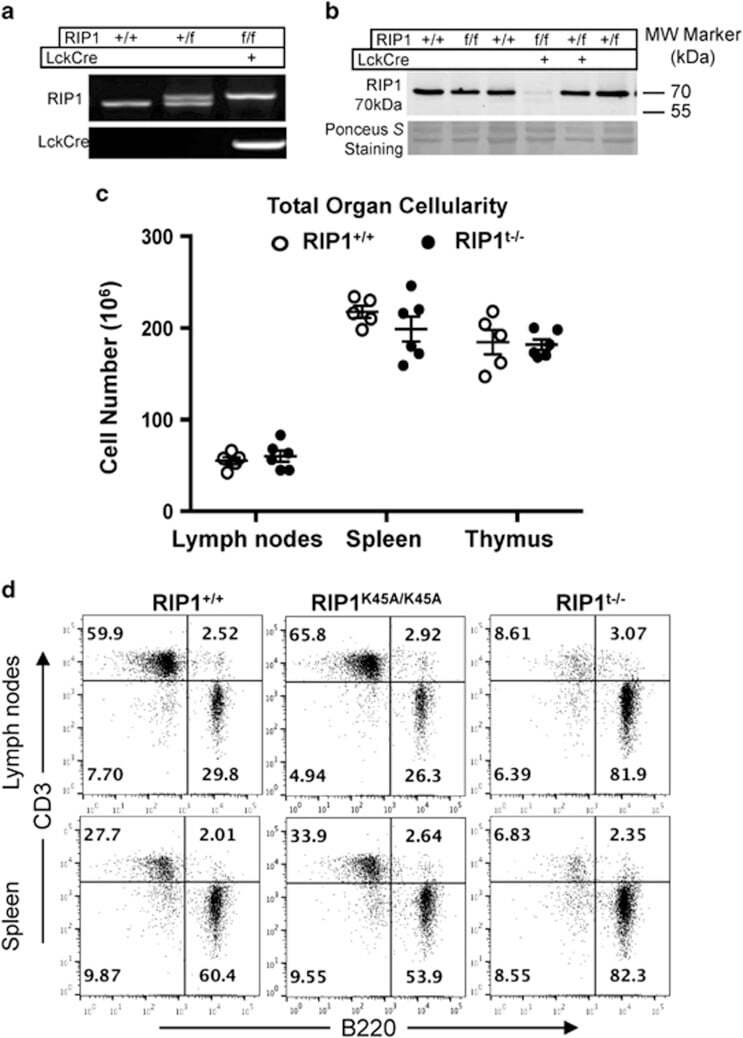
- Figure 2 T-cell-specific deletion of RIP1. ( a ) Genotyping by PCR of mouse ear DNA showing genotypes generated from a RIP1 +/f x RIP1 +/f Lckcre + mating cross. ( b ) Western blotting analysis of RIP1 in thymocytes from mice of the indicated genotypes. Ponceus S staining was performed as protein loading/transfer control. ( c ) Total organ cellularity of RIP1 t-/- mutant mice (filled circles) and RIP1 +/+ control mice (open circles) are shown. Error bars are average+-S.E.M. P -values >0.05. ( d ) Representative two-color flow cytometric plots showing the T cell (CD3 + ) and B cell (B220 + ) populations in the indicated peripheral lymphoid organs
- Submitted by
- Invitrogen Antibodies (provider)
- Main image
- Experimental details
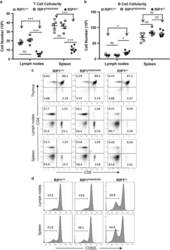
- Figure 3 Analysis of T-cell populations in RIP1 t-/- mice. ( a ) Absolute T cell (CD3 + ) and ( b ) B cell (B220 + ) numbers in the spleen and lymph nodes of mutant and control mice. * P

- Submitted by
- Invitrogen Antibodies (provider)
- Main image
- Experimental details
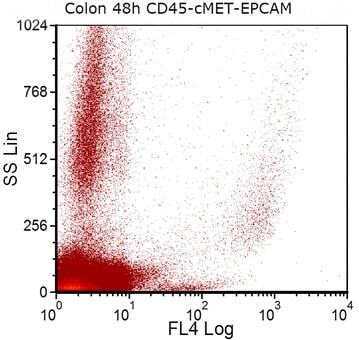
- Fig. 5 EPCAM (FL4) expression in a colon-cancer cell-line-spiked sample on day 3 of storage. Colon cancer cells from HCT-116 cancer cell line were spiked into whole blood from a healthy donor. After sample staining with CD45, PECAM1 and EPCAM antibodies, EPCAM positive cells were selected by excluding CD45 and PECAM1 positive cells during gating on FCSExpress V3
- Submitted by
- Invitrogen Antibodies (provider)
- Main image

- Experimental details
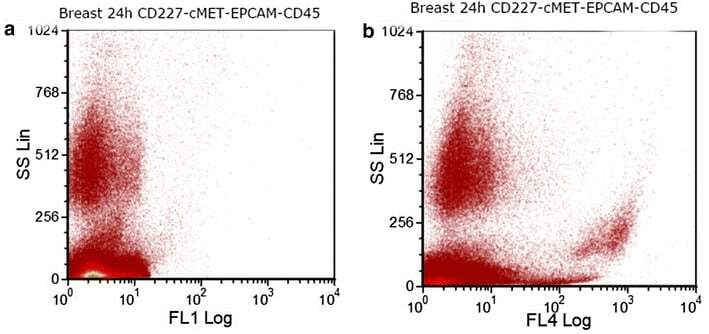
- Fig. 6 Dot plots showing a expression of CD227 (FL1) and b expression of EPCAM (FL4) in a breast-cancer cell-line-spiked sample on the day 2 of storage. Breast cancer cells from MDA-MB-231 cancer cell line were spiked into whole blood from a healthy donor. After sample staining with CD45, PECAM1, EPCAM and CD227 antibodies, EPCAM and CD227 positive cells were selected by excluding CD45 and PECAM1 positive cells during gating on FCSExpress V3
- Submitted by
- Invitrogen Antibodies (provider)
- Main image
- Experimental details
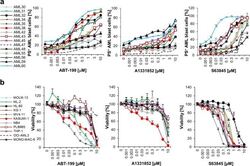
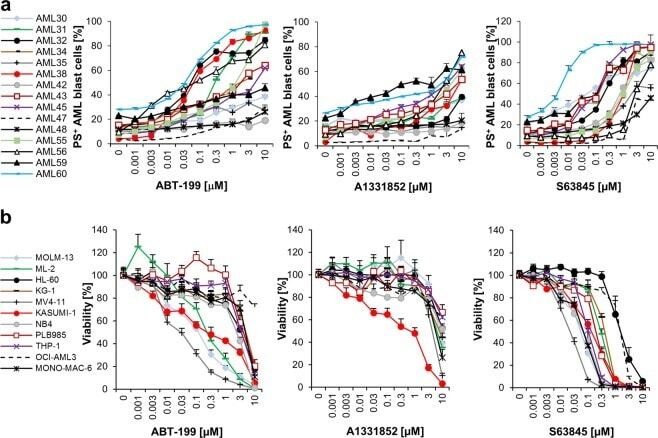
- Fig. 1 MCL-1 represents amongst the BCL-2 proteins the most promising therapeutic target in AML. a Primary AML samples were treated with indicated concentrations of ABT-199, A1331852 or S63845 for 20 h. Cell death was measured by FACS analysis using Annexin-V/FITC staining in combination with anti-CD45/APC staining. Mean of each experiment performed in duplicate or triplicate is shown. b Eleven AML cell lines were treated with indicated concentrations of ABT-199, A1331852 or S63845 for 72 h prior to analysis of viability using CellTiter-Glo. Data shown are mean and standard error of mean ( n = 3-7).
- Submitted by
- Invitrogen Antibodies (provider)
- Main image
- Experimental details
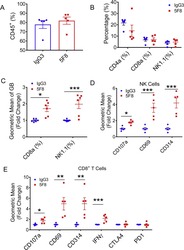
- Fig. 3. Administration of anti-DKK2 antibody enhanced cytotoxicity of NK and CD8 + T cells. (A-F) Flow cytometry analysis of tumor-in-filtrating lymphocytes in Kras G12D/+ ; Apc fl/fl mice. Leukocytes from tumors from Kras G12D/+ ; Apc fl/fl mice injected with of 5F8 or IgG (10 mg/Kg, i.p.) were prepared and analyzed by flow cytometry. (A) percentage of CD45 was shown. (B) CD4, CD8, NK were pre-gated from CD45 + population. (C) Granzyme B expression was measured in both CD8 and NK cells. (D) additional markers of tumor infiltrated NK1.1 + cells were described. (E) Flow cytometry analysis of additional markers of tumor infiltrated CD8 + T cells. Data are presented as means +- sem (Two-sided Student's t-test; n = 5) (*P < 0.05; **P < 0.01; ***P < 0.001).
- Submitted by
- Invitrogen Antibodies (provider)
- Main image
- Experimental details
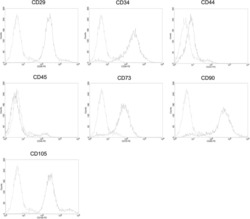
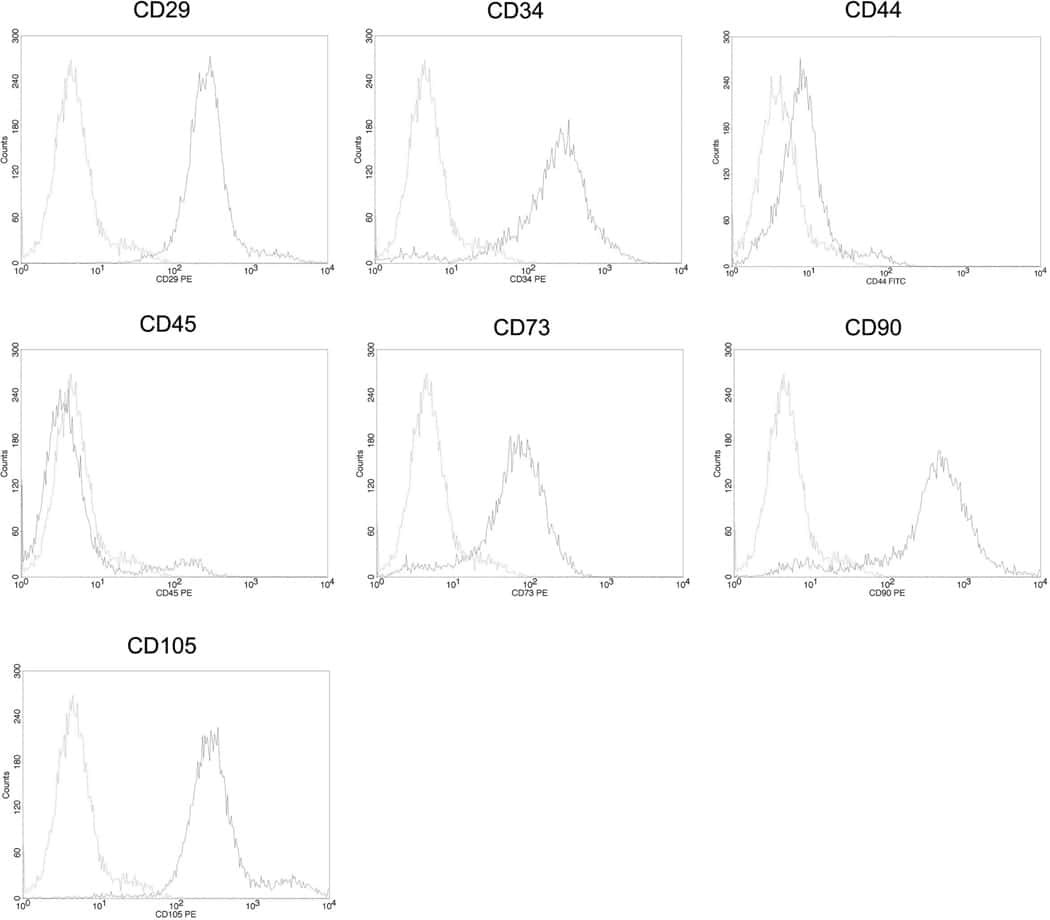
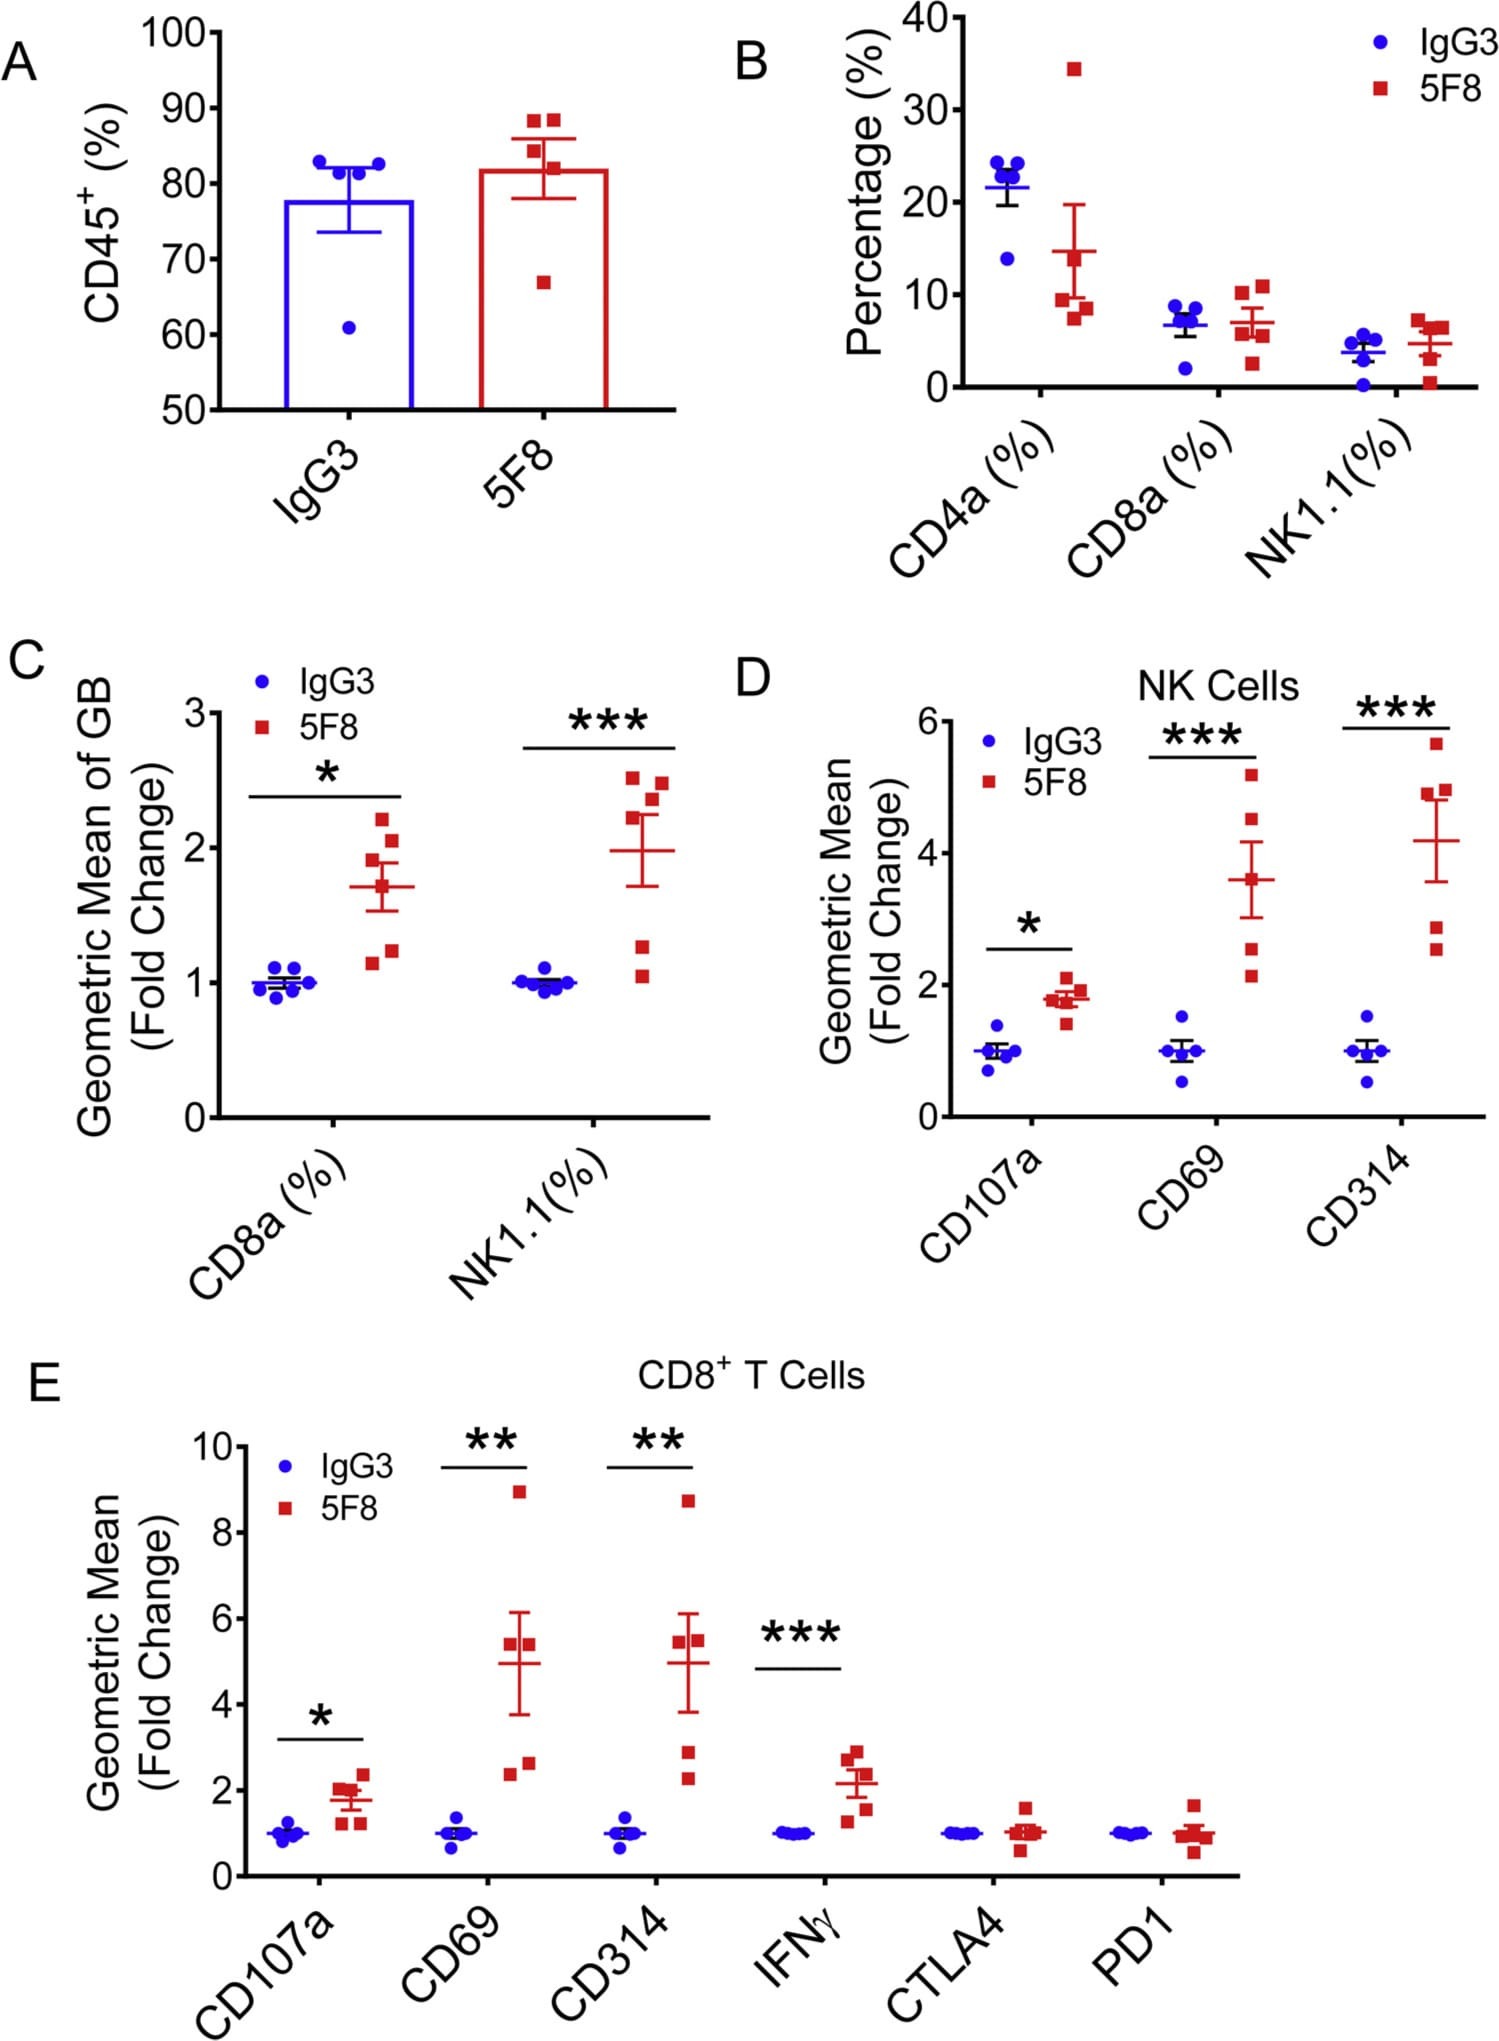
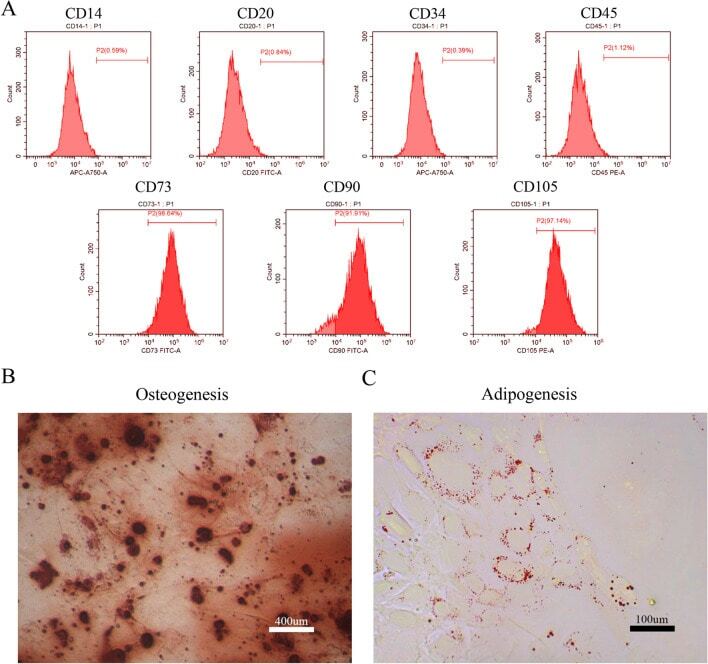
- Figure 1 Identification of dental pulp stem cells (DPSCs). Human DPSCs were positive for the cell surface antigens CD73, CD90, and CD105, as well as negative for CD14, CD20, CD34, and CD45 demonstrated by flow cytometry ( A ). DPSCs were cultured under osteogenic ( B , 14 days) or adipogenic ( C , 21 days) conditions, and showed mineralized nodules and lipid clusters as revealed by alizarin red and oil red staining, respectively. Scale bar = 400 ( B ) or 100 ( C ) mum.
- Submitted by
- Invitrogen Antibodies (provider)
- Main image
- Experimental details
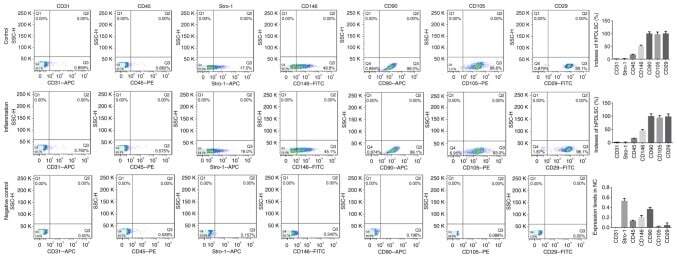
- Figure 2 Identification and purification of hPDLSCs by flow cytometry. hPDLSCs, human periodontal ligament stem cells.
- Submitted by
- Invitrogen Antibodies (provider)
- Main image
- Experimental details
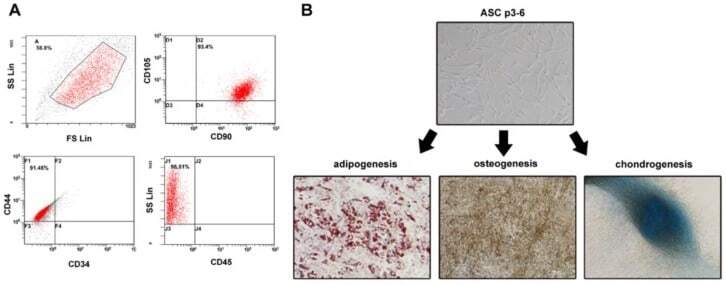
- Figure 1 Identification of ADSCs. ( A ) ADSCs were isolated from the adipose tissue of breast tumors. After two to three passages, the expressions of ADSCs markers (CD90FITC, CD105PE, and CD44FITC) and the lack of CD34PE and CD45FITC were confirmed by flow cytometry. ( B ) The differentiation ability of ADSCs was tested by adipogenesis, osteogenesis, and chondrogenesis.
- Submitted by
- Invitrogen Antibodies (provider)
- Main image
- Experimental details
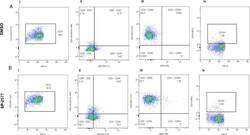
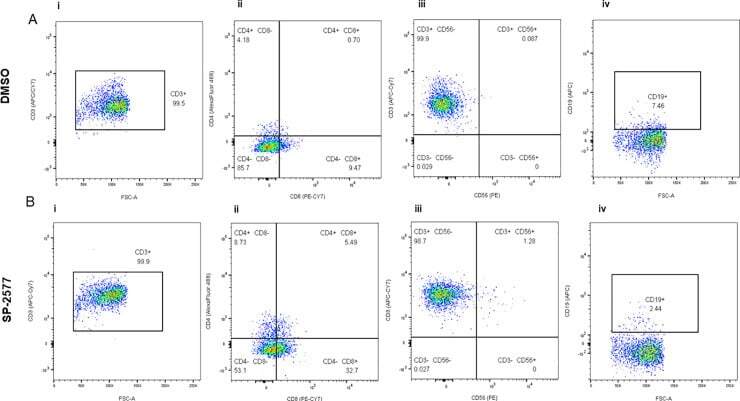
- 10.1371/journal.pone.0235705.g004 Fig 4 Flow cytometry analysis of the COV434 organoids after lymphocyte infiltration assay. COV434 organoids were dissociated and the infiltrated lymphocytes were stained with different markers and analyzed by flow cytometry as described in 'Materials and Methods'. Panel A and B are showing the status of lymphocytes infiltrated in DMSO control organoids and SP-2577 treated organoids, respectively, in the representative dot plots. (Ai and Bi) The dot plots showed the CD3 + population in CD45 + gated lymphocytes. (Aii and Bii) The status of CD4 + and CD8+ T cells gated on CD3 + cells are presented in different quadrants. (Aiii and Biii) Percentage of CD56+ NK in CD3+ cells are presented with quadrant statistics. (Aiv and Biv) The status of CD19+ B cells are shown in CD3+ cells.
- Submitted by
- Invitrogen Antibodies (provider)
- Main image
- Experimental details
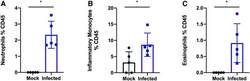
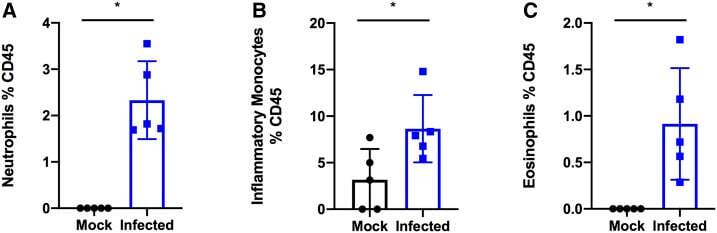
- Figure 3. SARS-COV-2 infection increases granulocytes and inflammatory monocytes in the bronchoalveolar lavage fluid. K18-hACE2 C57Bl/6J mice were intranasally inoculated with 8 x 10 4 TCID 50 of SARS-CoV-2 Hong Kong/VM20001061/2020 (Source: BEI Resources). Bronchoalveolar lavage was collected, cells isolated, and stained via flow cytometry. * P < 0.05. A two-tailed Student's t test was used to determine statistical significance.
- Submitted by
- Invitrogen Antibodies (provider)
- Main image
- Experimental details
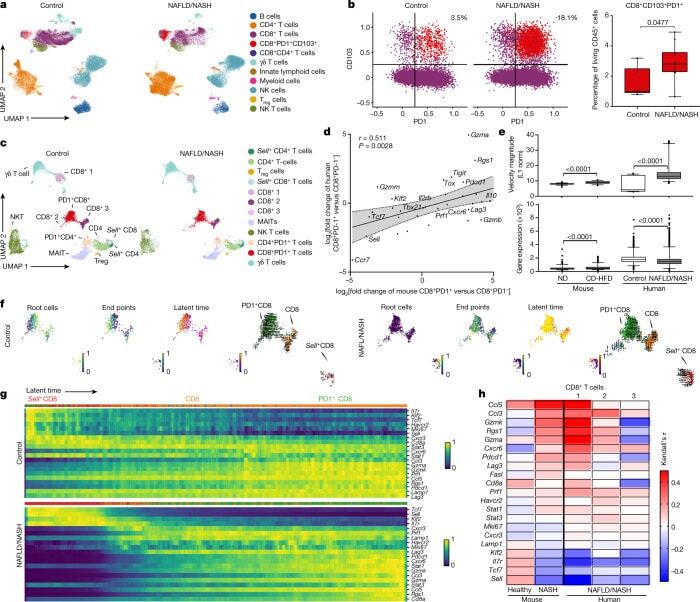
- Fig. 3 Hepatic resident-like CD8 + PD1 + T cells are increased in livers of patients with NAFLD patients. a , b , UMAP representation showing the FlowSOM-guided clustering of CD45 + cells ( a ) and flow cytometry plots ( b , left) and quantification ( b , right) of CD8 + PD1 + CD103 + cells derived from hepatic biopsies of healthy individuals or patients with NAFLD or NASH (Supplementary Table 2 ). Populations in b : violet, CD8 + ; red, CD8 + PD1 + CD103 + . T reg cells, regulatory T cells. c , UMAP representations and analyses of differential gene expression by scRNA-seq of CD3 + cells from control individuals or patients with NAFLD or NASH. MAITs, mucosal-associated invariant T cells. d , Correlation of significant differentially expressed genes in liver-derived CD8 + PD1 + T cells compared to CD8 + PD1 - T cells from mice fed with CD-HFD for 12 months and patients with NAFLD/NASH. Shading shows 95% CI. e - h , Expression ( e ) and transcriptional activity ( f ) of velocity analyses of scRNA-seq data, and gene expression ( g ) and correlation ( h ) of expression along the latent-time of selected genes along the latent-time of liver-derived CD8 + T cells from patients with NAFLD or NASH in comparison to control or NASH mouse liver-derived CD8 + T cells. Root cells: yellow, root cells; blue, cells furthest from the root by RNA velocity. End points: yellow, end-point cells; blue, cells furthest from defined end-point cells by RNA velocity. Latent time (pseudo-time by RNA velo
- Submitted by
- Invitrogen Antibodies (provider)
- Main image

- Experimental details
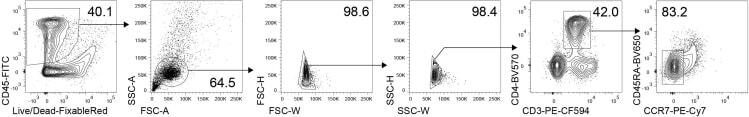
- Figure 6 Gating strategy Flow cytometric gating strategy to sort viable CD45 + CD3 + CD4 + CCR7 - CD45RA - cells from fetal intestinal lamina propria.
- Submitted by
- Invitrogen Antibodies (provider)
- Main image
- Experimental details
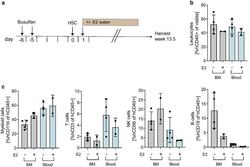
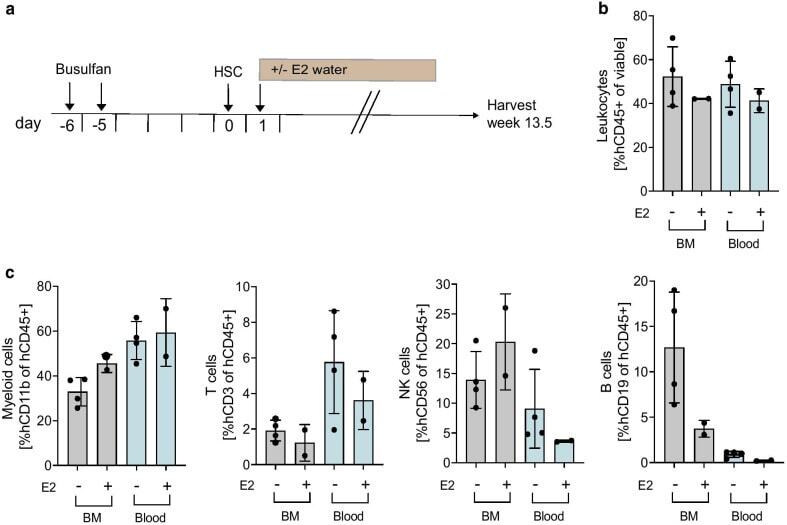
- Fig. 2 Effect of E2 supplementation on immune humanization in mice. a Experimental timeline. 6-7 weeks old NSG-SGM3 female mice were injected with 20 mg/kg/day busulfan on two consecutive days. Five days later, mice were IV injected with 85,000 hCD34 + HSCs and 24 h later received E2 supplemented acidified drinking water for 3.5 weeks ( n = 5, HSC donor ID 7734, KIR-mismatched to HCI-013). Control mice were kept on unsupplemented acidified drinking water. Mice were harvested 13.5 weeks post-humanization, at which point BM and blood were freshly isolated, and flow staining was performed. Flow cytometry was performed on the day of tissue harvest without fixation. b Flow cytometry analysis of hCD45 + cells in BM, and blood of humanized mice receiving E2 or unsupplemented acidified drinking water are shown as percent of viable cells ( n = 2-4). c Flow cytometry analysis of hCD11b + , hCD3 + , hCD56 + and hCD19 + cells in BM and blood of humanized mice receiving E2 or unsupplemented acidified drinking water are shown as percent of hCD45 + cells ( n = 2-4)
- Submitted by
- Invitrogen Antibodies (provider)
- Main image
- Experimental details
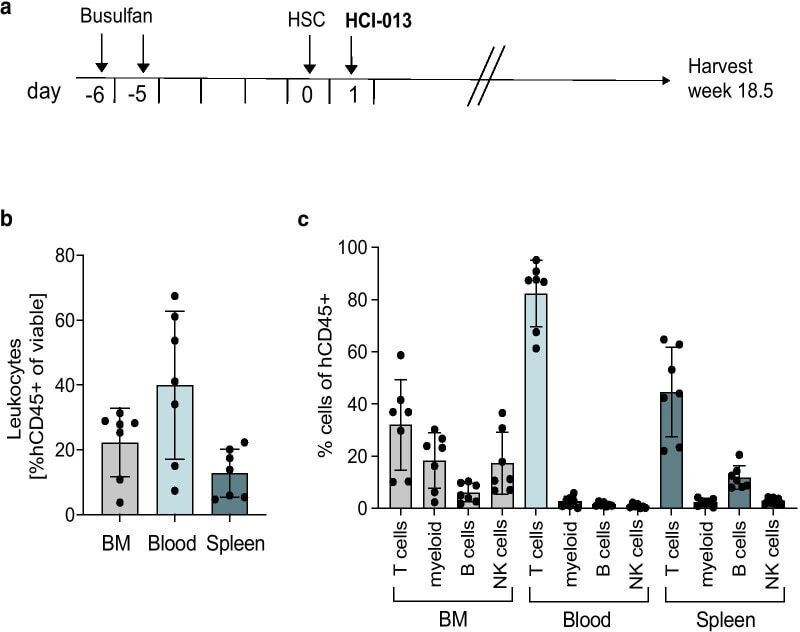
- Fig. 4 Immune humanization of mice bearing HCI-013 PDX tumors without exogenous E2. a Experimental timeline. 6-7 weeks old female NSG-SGM3 mice were injected with 20 mg/kg/day busulfan on two consecutive days. Five days later, mice were IV injected with 85,000 hCD34 + HSCs and 24 h later implanted with HCI-013 tumor fragments into the MFP. Animals were harvested 18.5 weeks post-humanization ( n = 10, HSC donor ID BM4410, KIR-matched to HCI-013). Control tumors were implanted into non-humanized NSG-SGM3 mice ( n = 3). On the day of harvest, BM, blood and spleens were isolated, and flow staining and flow cytometry were performed on the same day without fixation. b Flow cytometry analysis of hCD45 + cells in BM, blood and spleen of humanized mice are shown as percent of viable cells ( n = 8). c Flow cytometry analysis of hCD3 + , hCD11b + , hCD19 + and hCD56 + cells in BM, blood and spleens of humanized mice are shown as percent of hCD45 + cells ( n = 8). All data are shown as mean +- SEM
- Submitted by
- Invitrogen Antibodies (provider)
- Main image
- Experimental details
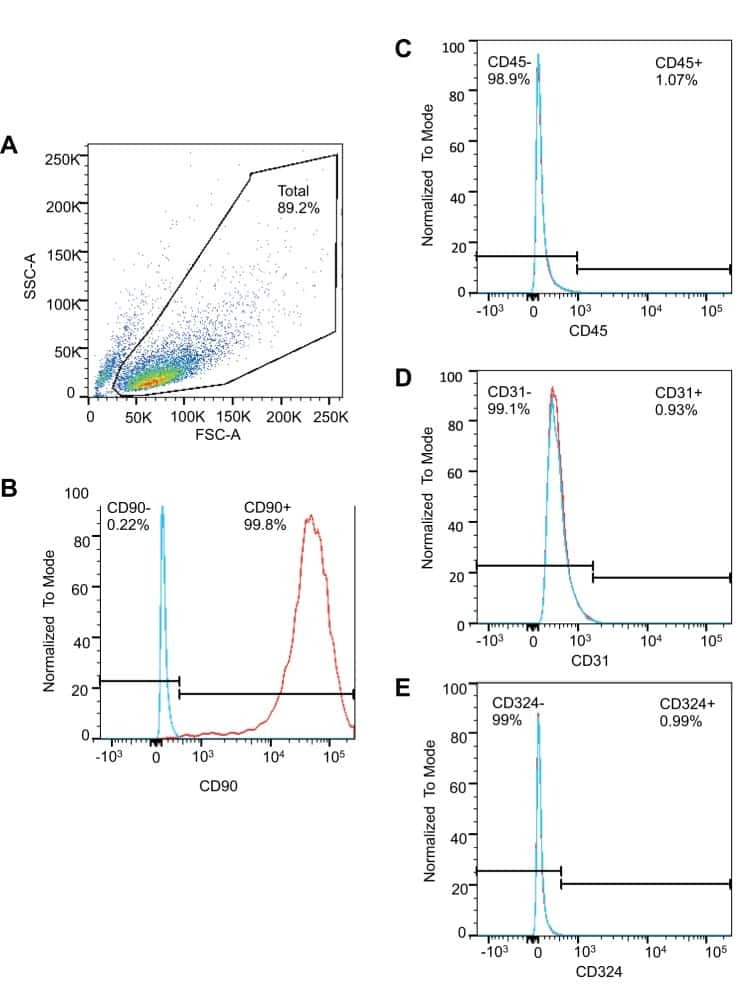
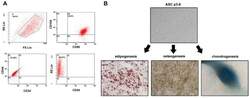
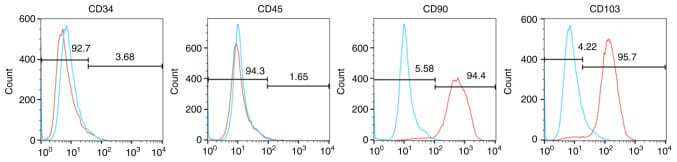
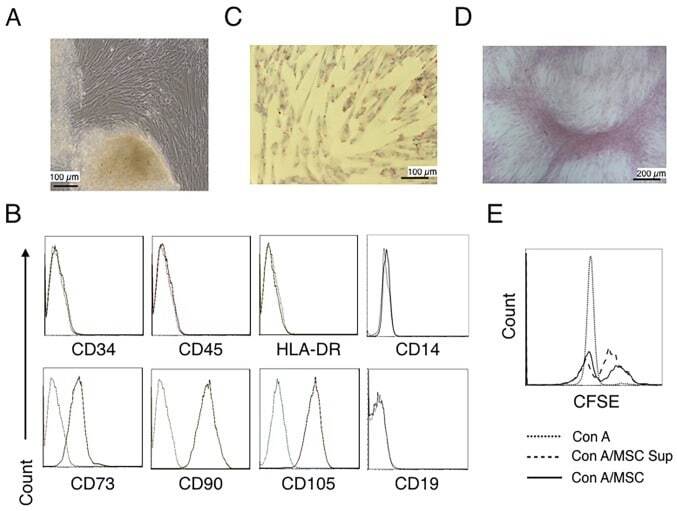
- Hemangioma-derived mesenchymal stem cells (Hem-MSCs) express CD103 and CD90, but do not express CD34 or CD45, according to flow cytometry.
- Submitted by
- Invitrogen Antibodies (provider)
- Main image
- Experimental details
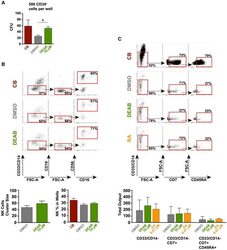
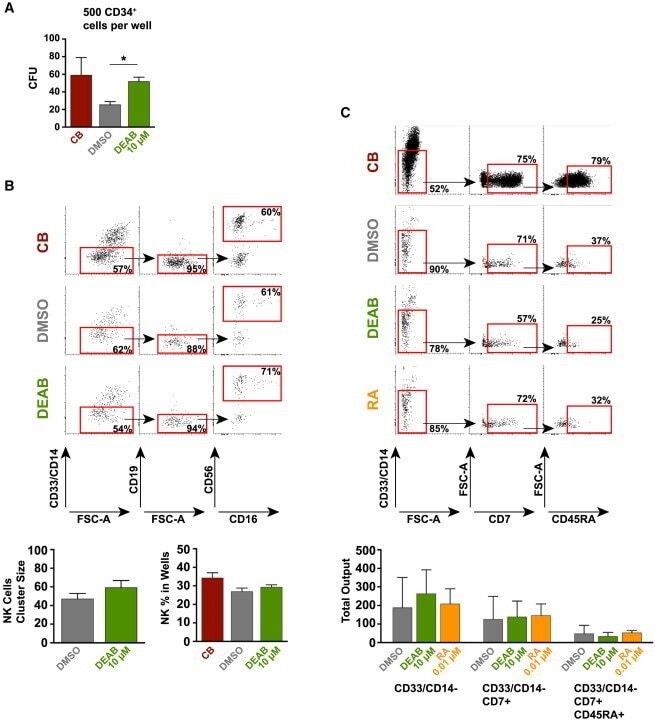
- Figure 3 Retinoic Acid Inhibition Increases the Differentiation Capacity of Hematopoietic Progenitors toward Myeloid and Lymphoid Lineage (A) CFU potential of 500 sorted progenitors (CD45/CD43 + CD34 + ) from DEAB-treated cultures (green) and DMSO control (gray) from four independent experiments (n = 4). CFU potential of progenitors similarly sorted from cord blood (CD45/CD43 + CD34 + ) is shown in red. (B) Lymphoid/myeloid differentiation assay performed on iPSC-derived hematopoietic cells. FACS plots and bar graphs showing non-myeloid (CD33/CD14 - ), CD19 - , CD56 + , and CD56 + CD16 + NK fraction from wells seeded with 50 HSC-like cells (CD45/43 + CD34 hi CD38 lo CD90 + CD45RA - ) (17 individual wells) cultured on OP9 stroma for 4 weeks. Left bar graph shows the cluster size of the NK fraction. Right bar graph shows the frequency of this population in the viable non-stroma fraction. See also Figure S2 . (C) FACS plots showing non-myeloid, CD7 + , CD45RA + multipotent early lymphoid progenitors from 3,500 sorted CD34 + cells cultured on OP9DL1 stroma for 3 weeks from one out of two independent experiments (n = 2). FACS plots are gated on the viable non-stroma fraction. Bar graph show the total output of differentiated cells from progenitors generated with DMSO, DEAB, or RA. FACS gates are based on FMO controls. Data represent mean +- SEM. Asterisks indicate significant differences ( * p < 0.05).
- Submitted by
- Invitrogen Antibodies (provider)
- Main image
- Experimental details
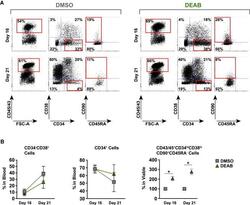
- Figure 5 Decreased Retinoic Acid Signaling Maintains the Primitiveness of Generated Hematopoietic Progenitors (A) Representative FACS profiles of cells harvested at day 16 and after extended culture period at day 21. Cells were treated with or without DEAB at 10 muM during the whole culture period. (B) Graphs showing fold changes in maturation of the hematopoietic population (CD45/43 + ) observed between day 16 and day 21 for cells treated with DEAB or DMSO from three independent experiments (n = 3). Data represent mean +- SEM. Asterisks indicate significant differences ( * p < 0.05).
- Submitted by
- Invitrogen Antibodies (provider)
- Main image

- Experimental details
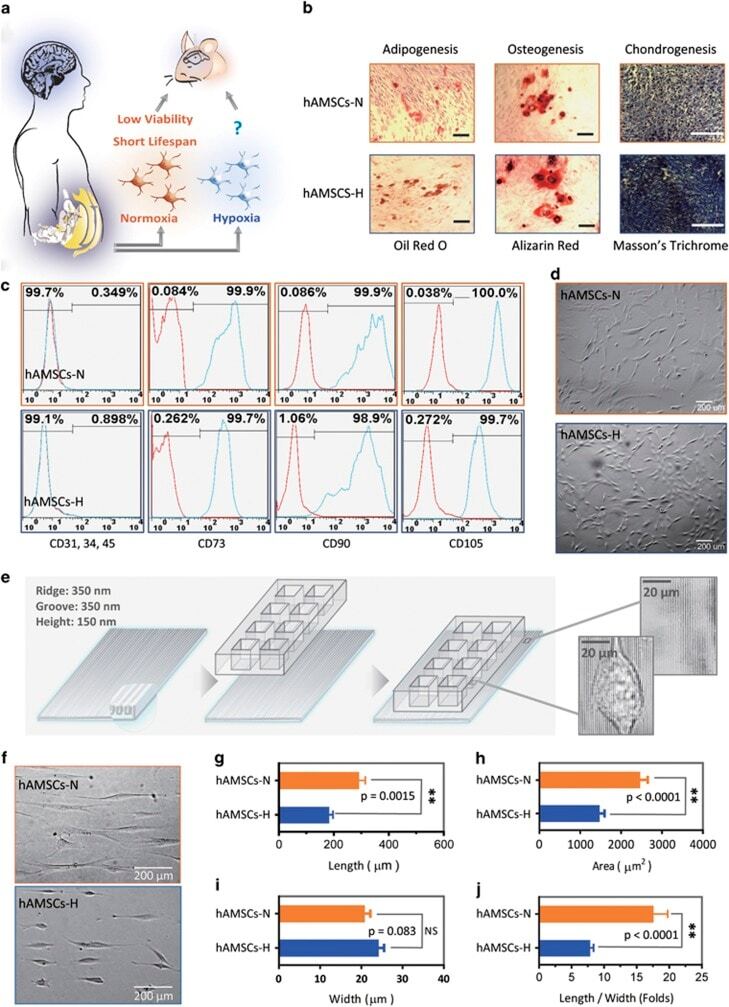
- Figure 1 Primary human adipose-derived cells cultured in hypoxia (hAMSCs-H) and normoxia (hAMSCs-N) are both MSCs but normoxia-cultured cells show increased signs of senescence, such as increased area and elongated morphology, compared with hypoxia-cultured cells. ( a ) hAMSCs were isolated from human fat tissue and cultured in hypoxic (1.5% oxygen) or normoxic (21% oxygen) conditions in vitro . The viability, mobility, tumor tropism, safety, and tumorigenic potential were subsequently compared in vitro and in vivo . ( b ) Differentiation assay. hAMSCs were cultured in control media and differentiation media for 3 weeks, 10 days after the second passage. Three different stains were performed to assess differentiation capabilities (scale bar, 100 mu m). ( c ) Flow cytometric analysis was performed to confirm the absence of CD31-, CD34-, and CD45-positive cells in both cell cultures. In addition, primary hAMSC cultures expressed high levels of CD73, CD90, and CD105, both in hypoxic and normoxic culture conditions at day 10 after passage 2. ( d ) Representative images of cell morphologies of hAMSCs on 2D surface (scale bar, 200 mu m). ( e ) Schematic of 3D-nanopatterned surface used to assess morphology and motility. ( f ) Images of cell morphologies of hAMSCs on 3D-nanopatterned surface (scale bar, 200 mu m). ( g - j ) The length, width, area, and length-to-width ratio were measured and compared after cell aligned on the nanopattern surface. Error bars represent S.E.M. * P
- Submitted by
- Invitrogen Antibodies (provider)
- Main image
- Experimental details
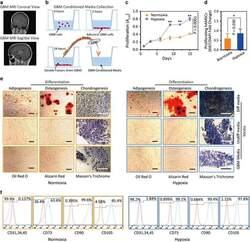
- Figure 3 Hypoxia-cultured primary human adipose-derived mesenchymal stem cells (hAMSCs-H) retain a greater proliferation capacity compared with normoxia-cultured primary hAMSCs (hAMSCs-N) when exposed to GBM media. hAMSCs-H maintain stem cell characteristics when exposed to GBM media. ( a ) Representative MRI of GBM from a patient. ( b ) Schema showing the collection of GBM CM and culture of hAMSCs in filtered GBM CM for proliferation and migration assays. ( c ) MTT assay was used to determine the effects of hypoxic conditions on the proliferative capacity of primary hAMSCs in GBM CM. In GBM CM, hAMSCs-H showed greater proliferation at day 10 and 15 compared with hAMSCs-N. ( d ) Ki-67 immunostaining was performed to quantify the number of proliferating cells in GBM CM. Proliferative capacities of hAMSCs-H and hAMSCs-N are shown in GBM CM (normalized to hAMSC-N proliferative capacity in control media). In GBM CM, hAMSCs-H had a greater proportion of proliferating cells than hAMSCs-N. ( e) Differentiation assay. hAMSCs were cultured in control media, differentiation media, and GBM CM for 3 weeks, 10 days after the second passage. Three stainings were performed to assess the differentiation capabilities (scale bar, 100 mu m). Both hAMSCs-N and hAMSCs-H maintained tri-lineage differentiation capability in GBM CM. ( f ) Flow cytometric analysis for CD31, CD34, CD45, CD73, CD90, and CD105 in hAMSC-N and hAMSC-H cultures after exposure to GBM CM for 20 days. hAMSCs-H maintained MSC

- Submitted by
- Invitrogen Antibodies (provider)
- Main image
- Experimental details
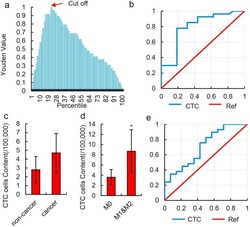
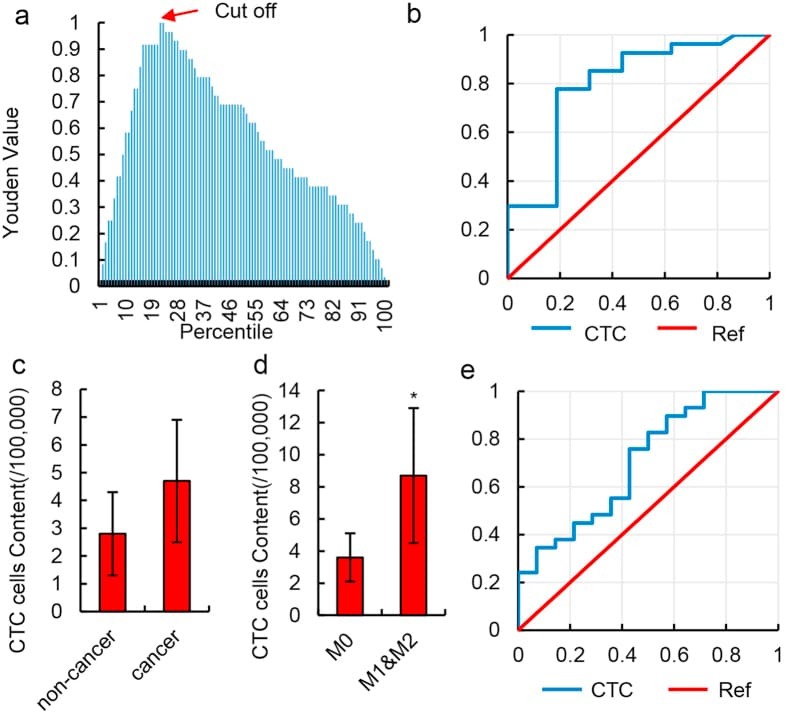
- Figure 3 Diagnostic value of HKR cell content. ( a ) Youden curve for HKR cells in 52 HCC patients and 12 normal individuals. Arrow refers to the maximum Youden index, which was defined as the threshold. ( b ) ROC curve of HKR cells for 23 HCC patients with MVI (M1 & M2) and 18 HCC patients without MVI (M0). HKR cells were identified by imaging flow cytometry. ( c ) Relative number of CTCs in 100,000 peripheral blood mononuclear cells in non-cancer liver disease patients and HCC patients. CTCs were defined as CD45 - & EpCAM + cells in the peripheral blood and detected by imaging flow cytometry. Data are presented as means +- SD of independent experiments. ( d ) Relative number of CTCs in 100,000 peripheral blood mononuclear cells in HCC patients with MVI (M1 & M2) and HCC patients without MVI (M0). CTCs were defined as CD45 - & EpCAM + cells in peripheral blood and detected by imaging flow cytometry. Data are presented as means +- SD of independent experiments. * P < 0.05. ( e ) ROC curve of CTCs for 23 HCC patients with MVI (M1 & M2) and 18 HCC patients without MVI (M0) in 52 total samples. CTCs were defined as CD45 - & EpCAM + cells in peripheral blood and detected by imaging flow cytometry.
- Submitted by
- Invitrogen Antibodies (provider)
- Main image
- Experimental details
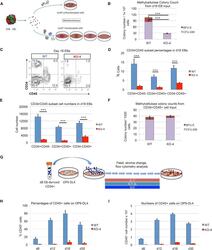
- Figure 5 Inefficient Hematopoietic Outcomes from HEB -/- hESC-Derived Progenitors (A) Experimental overview for the colony-forming unit (CFU) assay of erythromyeloid potential. Cell suspensions from day-18 (d18) EBs were obtained and placed into methylcellulose cultures either as an unfractionated population (top) or as four sorted subsets based on combinatorial expression of CD34 and CD45 (bottom). (B) Numbers of erythroid (BFU-E) and myeloid (CFU-GM) arising from unfractionated WT and HEB -/- d18 EB-derived cells in methylcellulose cultures. (C) Flow-cytometric analysis for CD34 and CD45 expression of unfractionated WT and HEB -/- d18 EB-derived cells. (D and E) The percentages (D) and cell numbers (E) of CD34 + CD45 - , CD34 + CD45 + , and CD34 - CD45 + subsets within WT and HEB -/- d18 EBs. (F) Numbers of erythroid (BFU-E) and myeloid (CFU-GM) arising from CD34 + CD45 + cells sorted from WT and HEB -/- d18 EBs. (G) Experimental overview for T cell differentiation. CD34 + cells were sorted from d8 EBs and co-cultured with OP9-DL4 cells. (H and I) Percentages (H) and numbers (I) of CD45 + cells at successive days (d) of OP9-DL4 co-cultures. Error bars represent mean +- SD (n = 3 independent experiments). *** p < 0.005 by Student's t test. Plots in (C) are representative of three independent experiments. See also Figures S5 and S6 .
- Submitted by
- Invitrogen Antibodies (provider)
- Main image
- Experimental details
- Figure 6 Ectopic Expression of HEBCan in HEB -/- hESCs Restores Lineage-Specific Gene Expression and Hematopoietic Specification (A) Western blot analysis for HEB expression in WT, KO (HEB -/- ), KO + GFP (HEB -/- hESCs transduced with GFP control vector) and KO + HEBCan (HEB -/- hESCs transduced with HEBCan-encoding vector) hESCs. (B) Bright-field (top) and fluorescent (bottom) images of day-8 (d8) EBs derived from HEB -/- hESCs transduced with control or HEBCan-expressing lentiviral particles. Scale bar, 100 mum. (C and D) qRT-PCR analysis for the expression of pluripotency-associated genes (C) and mesoendodermal genes (D) in WT, KO + GFP, and KO + HEBCan hESC-derived cells at d0 and d4 of EB culture. mRNA levels are shown relative to GAPDH. (E) Flow-cytometric analysis of CD34 and KDR, CD144, and CD31 on WT, KO + GFP, and KO + HEBCan d8 EB-derived cells. (F and G) Percentages (F) and numbers (G) of CD34 + cells in WT, KO + GFP, and KO + HEBCan d8 EBs. (H) Flow-cytometric analysis for CD34 and CD45 on WT, KO + GFP, and KO + HEBCan d18 EB-derived cells. (I and J) Percentages (I) and numbers (J) of CD34/CD45 subsets in WT, KO + GFP, and KO + HEBCan d18 EB-derived cells. (K) Numbers of erythroid (BFU-E) and myeloid (CFU-GM) arising from unfractionated WT, KO + GFP, and KO + HEBCan d18 EBs. Error bars represent mean +- SD (n = 3 independent experiments). * p < 0.05, ** p < 0.01, *** p < 0.005 by Student's t test. Images in (A) and (B) and plots in (E) and (H) are represent

- Submitted by
- Invitrogen Antibodies (provider)
- Main image
- Experimental details
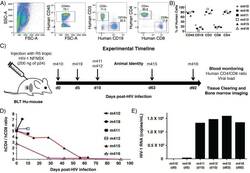
- Figure 1--figure supplement 1. Human cell reconstitution and HIV-1 infection in BLT hu-mice. ( A ) Representative flow analysis plots showing side scatter (SSC-A) and forward scatter (FSC-A), human CD45+ hematopoietic cell population, human CD3+ T lymphocyte and CD19+ B lymphocyte, and human CD4+ T and CD8+ T lymphocyte populations in peripheral blood at 13 weeks post-BLT transplant. ( B ) Percentage of reconstituted human hematopoietic cell populations in peripheral blood in all BLT mice. ( C ) Schematic for infection and analysis of BLT hu-mice. Animals were euthanized at days 0, 5, 10, 63, and 92 post-HIV-1 injection for analysis of blood and bone marrow. ( D ) Human CD4/CD8 ratios were monitored in peripheral blood by flow cytometry. ( E ) Quantification of HIV-1 viral load in peripheral blood at the time of euthanasia.
- Submitted by
- Invitrogen Antibodies (provider)
- Main image
- Experimental details
- Figure 1. Characterization of hUC-MSCs. (A) Morphological observations of hUC-MSCs. Umbilical cord tissues were cultured for >15 days and long spindle-shaded fibroblastic cells were observed around the tissue using Zeiss light microscopy (scale bar, 100 um). (B) Phenotyping of hUC-MSCs. hUC-MSCs were stained with a fluorescein-labeled antibodies (CD34, CD45, CD73, CD90, CD105, CD14, CD19 and HLA-DR) and analyzed with a flow cytometer. (C) Adipogenic and (D) osteogenic differentiation of hUC-MSCs. hUC-MSCs were cultured in adipogenic and osteogenic medium, respectively. Lipid droplets in the adipocytes are presented with Oil Red O staining (scale bar, 100 um). hUC-MSCs-derived osteoblasts were detected with Alizarin Red staining (scale bar, 200 um). (E) hUC-MSCs inhibit the proliferation of CFSE-labeled CD4 + T cells, which were activated by Con A stimulation. Experiments were repeated three times and representative graphs and images are presented. hUC-MSC, human umbilical cord-derived mesenchymal stem cell; MSC Sup, culture supernatant of hUC-MSCs; Con A, concanavalin A; CFSE, carboxyfluorescein succinimidyl ester.
- Submitted by
- Invitrogen Antibodies (provider)
- Main image
- Experimental details
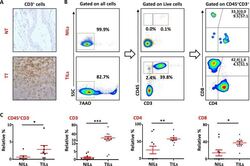
- Figure 1 T-cell infiltration in normal and tumor tissues in primary breast cancer ( A ). Representative images of immunohistochemical staining of tumor-infiltrating CD3 + T cells in formalin-fixed paraffin embedded breast non-tumor (NT) and tumor tissues (TT). ( B ). Freshly isolated immune cells infiltrating NT (NILs) and TT (TILs) from 11 PBC patients were stained with 7AAD, CD45, CD3, CD4 and CD8 antibodies for identification of T cells and their subsets. Representative flow cytometric plots of surface staining from one cancer patient are shown. 7AAD dye was used to gate live cells, followed by lymphocyte identification by CD45 and CD3 stainings. Different subsets of T cells were then characterized using CD4 and CD8 antibodies. ( C ). Scatter plots showing the differences in tissue-infiltrating CD45 + CD3 - , CD45 + CD3 + , CD4 + and CD8 + cells between NILs and TILs.
