Explore
 Validate
 Learn
Learn Flow cytometry
Antibody data
- Antibody Data
- Antigen structure
- References [58]
- Comments [0]
- Validations
- Flow cytometry [1]
- Other assay [69]
Submit
Validation data
Reference
Comment
Report error
- Product number
- 35-0452-80 - Provider product page

- Provider
- Invitrogen Antibodies
- Product name
- CD45R (B220) Monoclonal Antibody (RA3-6B2), PE-Cyanine5.5, eBioscience™
- Antibody type
- Monoclonal
- Antigen
- Other
- Description
- Description: The RA3-6B2 monoclonal antibody reacts with exon A-restricted isoform of mouse CD45, a 220 kDa surface molecule. CD45R/B220 epitope is mainly expressed by the B cell lineage from early Pro-B to mature B cells. However, some activated T cells, lymphokine activated killer cells (LAK), NK cell progenitors in the bone marrow, and T cells of the lpr/lpr mutant mouse also express this antigen. Applications Reported: This RA3-6B2 antibody has been reported for use in flow cytometric analysis. Applications Tested: This RA3-6B2 antibody has been tested by flow cytometric analysis of mouse splenocytes. This can be used at less than or equal to 0.125 µg per test. A test is defined as the amount (µg) of antibody that will stain a cell sample in a final volume of 100 µL. Cell number should be determined empirically but can range from 10^5 to 10^8 cells/test. It is recommended that the antibody be carefully titrated for optimal performance in the assay of interest. Light sensitivity: This tandem dye is sensitive photo-induced oxidation. Please protect this vial and stained samples from light. Fixation: Samples can be stored in IC Fixation Buffer (Product # 00-822-49) (100 µL cell sample + 100 µL IC Fixation Buffer) or 1-step Fix/Lyse Solution (Product # 00-5333-54) for up to 3 days in the dark at 4°C with minimal impact on brightness and FRET efficiency/compensation. Some generalizations regarding fluorophore performance after fixation can be made, but clone specific performance should be determined empirically. Excitation: 488-561 nm; Emission: 695 nm; Laser: Blue Laser, Green Laser, Yellow-Green Laser.
- Reactivity
- Human, Mouse
- Host
- Rat
- Isotype
- IgG
- Antibody clone number
- RA3-6B2
- Vial size
- 25 µg
- Concentration
- 0.2 mg/mL
- Storage
- 4° C, store in dark, DO NOT FREEZE!
Submitted references Lenvatinib for effectively treating antiangiogenic drug-resistant nasopharyngeal carcinoma.
Transient expansion and myofibroblast conversion of adipogenic lineage precursors mediate bone marrow repair after radiation.
A rapid CRISPR competitive assay for in vitro and in vivo discovery of potential drug targets affecting the hematopoietic system.
Polyvinyl alcohol hydrolysis rate and molecular weight influence human and murine HSC activity ex vivo.
Type 2 diabetic mice enter a state of spontaneous hibernation-like suspended animation following accumulation of uric acid.
Metabolic preconditioning in CD4+ T cells restores inducible immune tolerance in lupus-prone mice.
Impaired HA-specific T follicular helper cell and antibody responses to influenza vaccination are linked to inflammation in humans.
The folate cycle enzyme MTHFD2 induces cancer immune evasion through PD-L1 up-regulation.
Myeloid Cell CK2 Regulates Inflammation and Resistance to Bacterial Infection.
Shp1 Loss Enhances Macrophage Effector Function and Promotes Anti-Tumor Immunity.
The lysophospholipase D enzyme Gdpd3 is required to maintain chronic myelogenous leukaemia stem cells.
Use of Busulfan to Condition Mice for Bone Marrow Transplantation.
Tpl2 Protects Against Fulminant Hepatitis Through Mobilization of Myeloid-Derived Suppressor Cells.
Bacteroides fragilis polysaccharide A induces IL-10 secreting B and T cells that prevent viral encephalitis.
The Hematopoietic Oxidase NOX2 Regulates Self-Renewal of Leukemic Stem Cells.
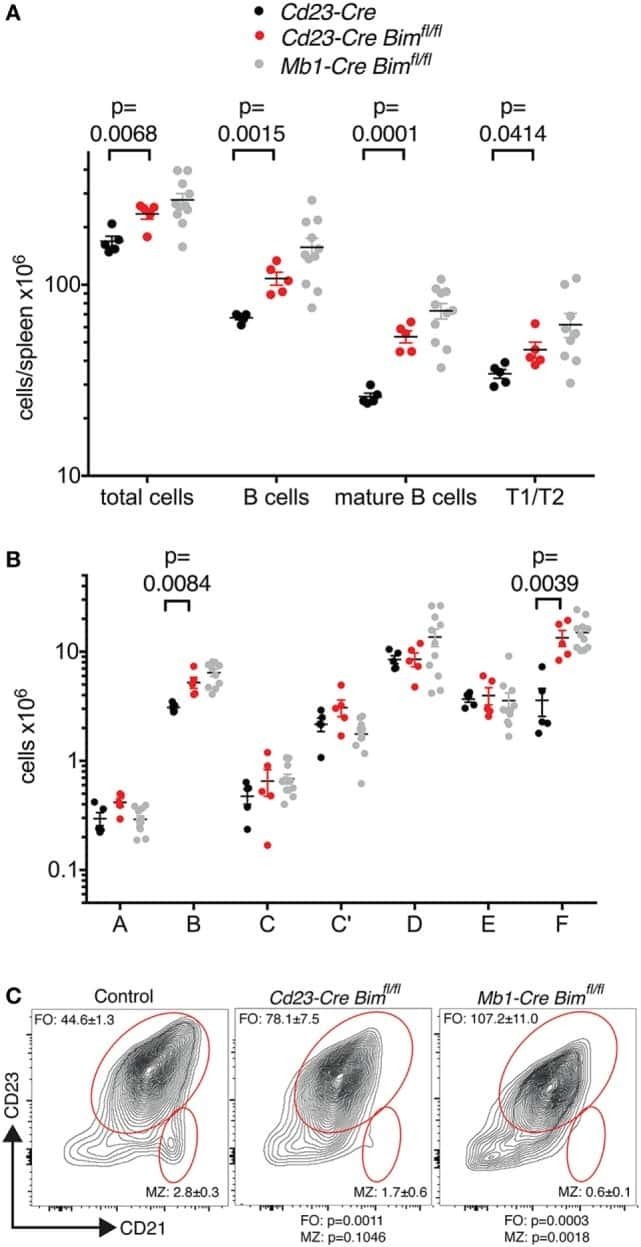
Proapoptotic BIM Impacts B Lymphoid Homeostasis by Limiting the Survival of Mature B Cells in a Cell-Autonomous Manner.
Dysregulated TRAF3 and BCL2 Expression Promotes Multiple Classes of Mature Non-hodgkin B Cell Lymphoma in Mice.
ATF3 Sustains IL-22-Induced STAT3 Phosphorylation to Maintain Mucosal Immunity Through Inhibiting Phosphatases.
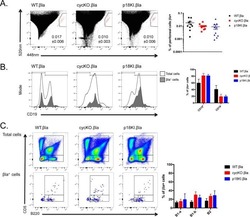
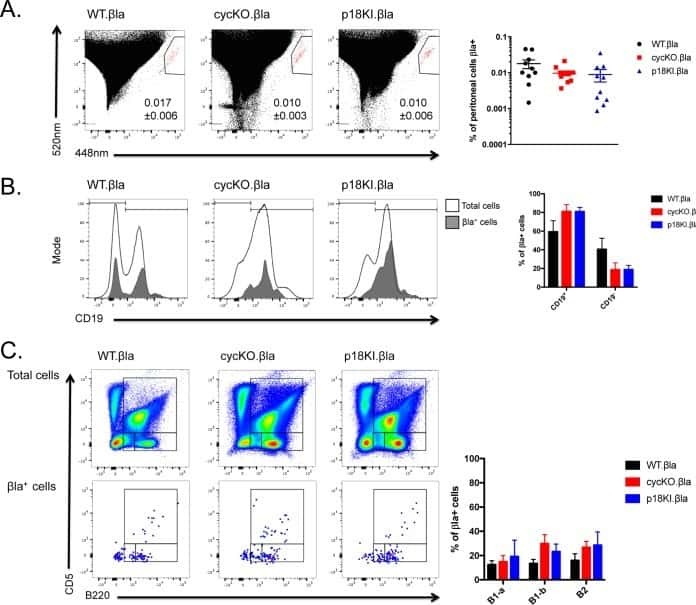
Host Tumor Suppressor p18(INK4c) Functions as a Potent Cell-Intrinsic Inhibitor of Murine Gammaherpesvirus 68 Reactivation and Pathogenesis.
Adrenergic nerve degeneration in bone marrow drives aging of the hematopoietic stem cell niche.
Mitophagy in Intestinal Epithelial Cells Triggers Adaptive Immunity during Tumorigenesis.
miR-143/145 differentially regulate hematopoietic stem and progenitor activity through suppression of canonical TGFβ signaling.
Tanshinone IIA and Astragaloside IV promote the angiogenesis of mesenchymal stem cell-derived endothelial cell-like cells via upregulation of Cx37, Cx40 and Cx43.
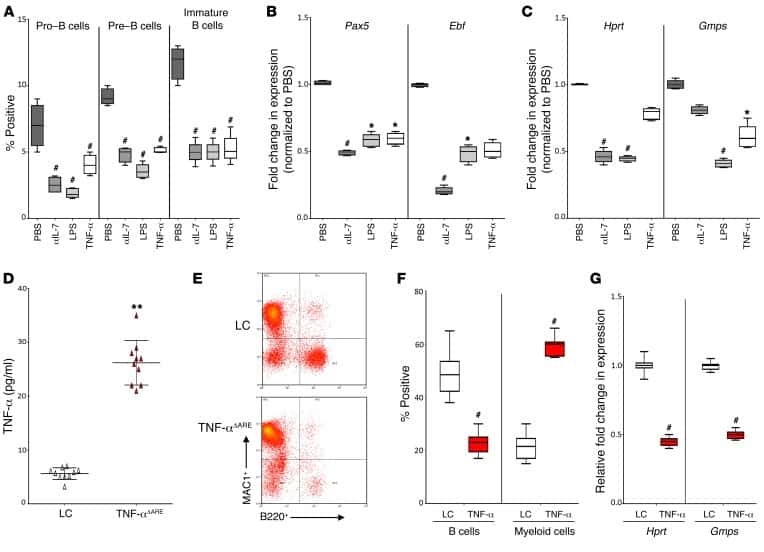
Inactivation of mTORC1 Signaling in Osterix-Expressing Cells Impairs B-cell Differentiation.
The Interleukin (IL)-1R1 pathway is a critical negative regulator of PyMT-mediated mammary tumorigenesis and pulmonary metastasis.
Multiple functional therapeutic effects of TnP: A small stable synthetic peptide derived from fish venom in a mouse model of multiple sclerosis.
DNA-binding of the Tet-transactivator curtails antigen-induced lymphocyte activation in mice.
EZH2 enables germinal centre formation through epigenetic silencing of CDKN1A and an Rb-E2F1 feedback loop.
Differential cytokine contributions of perivascular haematopoietic stem cell niches.
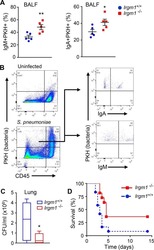
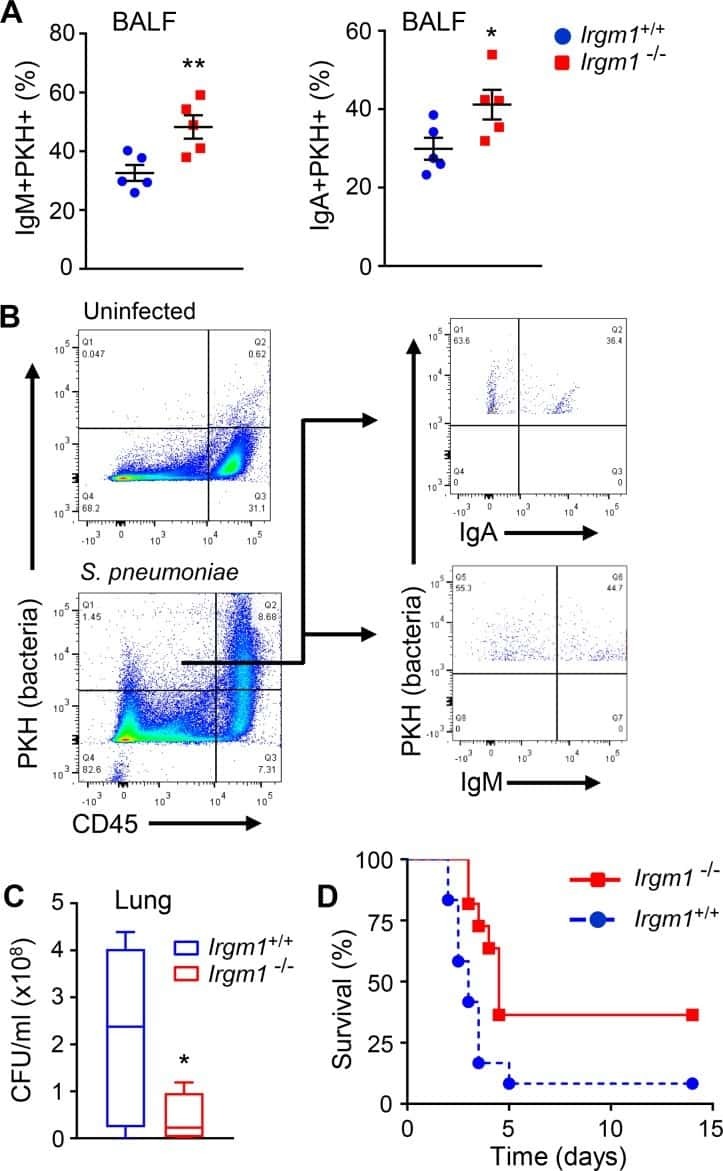
Irgm1 coordinately regulates autoimmunity and host defense at select mucosal surfaces.
Epithelial Fli1 deficiency drives systemic autoimmunity and fibrosis: Possible roles in scleroderma.
Murine iPSC-Derived Macrophages as a Tool for Disease Modeling of Hereditary Pulmonary Alveolar Proteinosis due to Csf2rb Deficiency.
Resident T Cells Are Unable To Control Herpes Simplex Virus-1 Activity in the Brain Ependymal Region during Latency.
Overexpression of Bovine FcRn in Mice Enhances T-Dependent Immune Responses by Amplifying T Helper Cell Frequency and Germinal Center Enlargement in the Spleen.
Mitochondrial ATP transporter Ant2 depletion impairs erythropoiesis and B lymphopoiesis.
Endothelial Gata5 transcription factor regulates blood pressure.
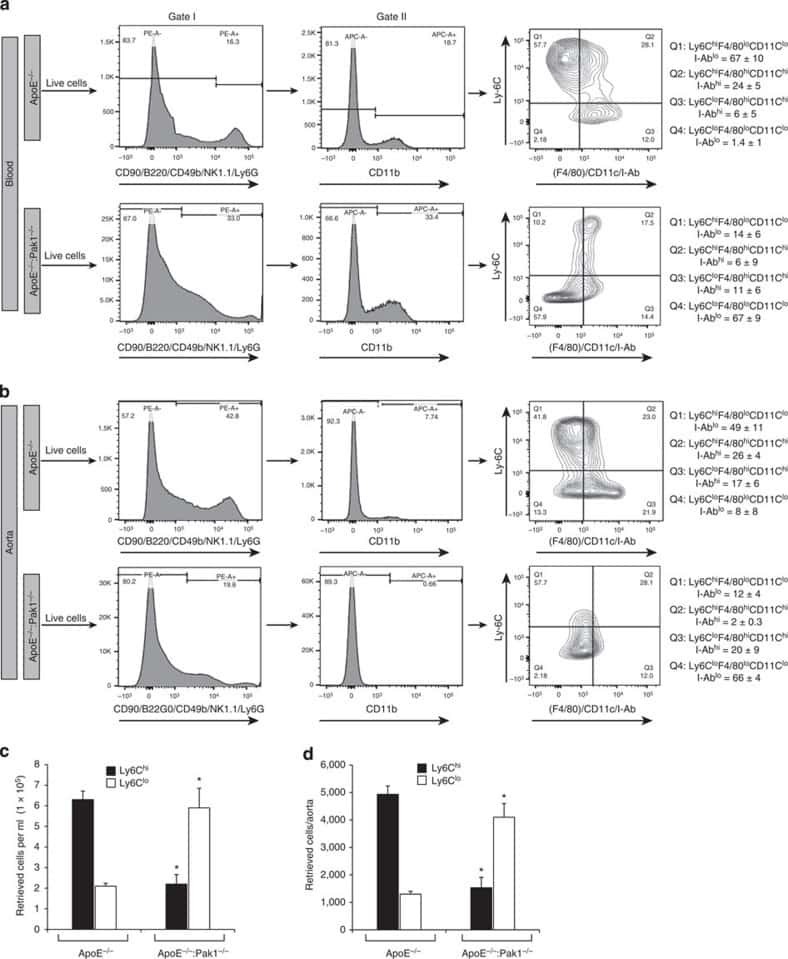
Disruption of p21-activated kinase 1 gene diminishes atherosclerosis in apolipoprotein E-deficient mice.
Aging-associated inflammation promotes selection for adaptive oncogenic events in B cell progenitors.
B-cell-intrinsic hepatitis C virus expression leads to B-cell-lymphomagenesis and induction of NF-κB signalling.
Transcription elongation factor ELL2 drives Ig secretory-specific mRNA production and the unfolded protein response.
Rhof promotes murine marginal zone B cell development.
IκBε is a key regulator of B cell expansion by providing negative feedback on cRel and RelA in a stimulus-specific manner.
Siglec-G deficiency leads to more severe collagen-induced arthritis and earlier onset of lupus-like symptoms in MRL/lpr mice.
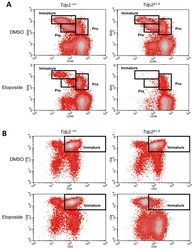
TDP2-dependent non-homologous end-joining protects against topoisomerase II-induced DNA breaks and genome instability in cells and in vivo.
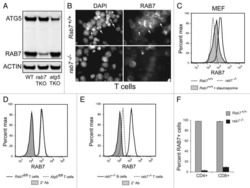
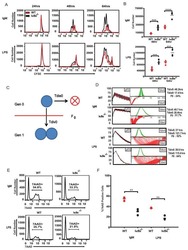
Reciprocal effects of rab7 deletion in activated and neglected T cells.
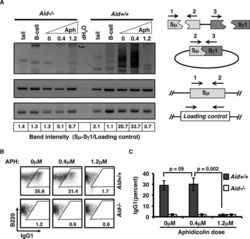
Activation-induced cytidine deaminase-initiated off-target DNA breaks are detected and resolved during S phase.
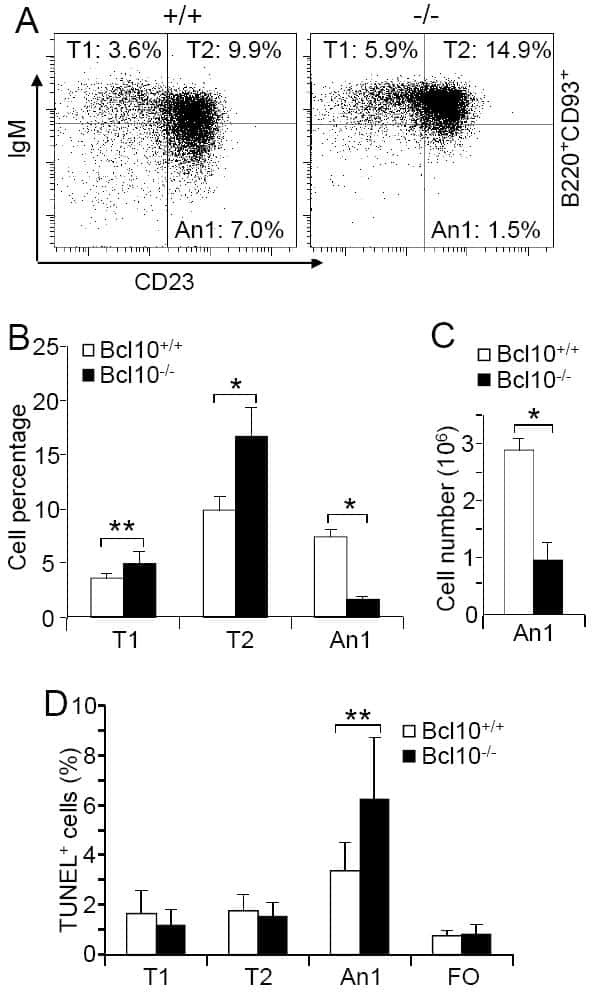
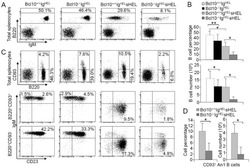
Critical role of B cell lymphoma 10 in BAFF-regulated NF-κB activation and survival of anergic B cells.
PAD4-mediated neutrophil extracellular trap formation is not required for immunity against influenza infection.
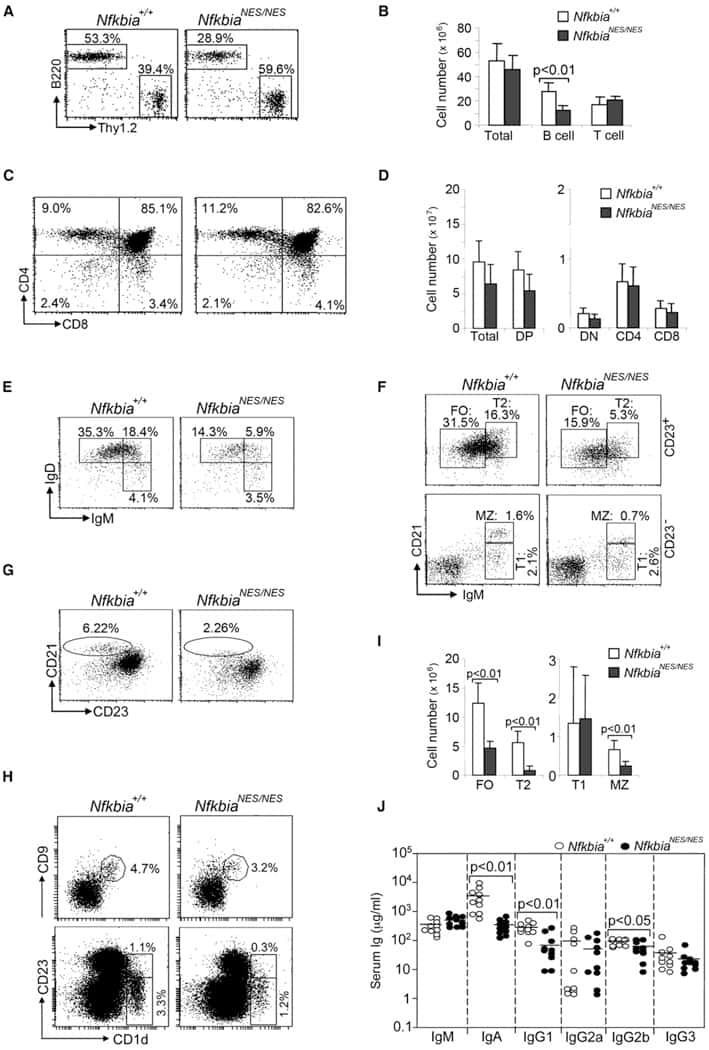
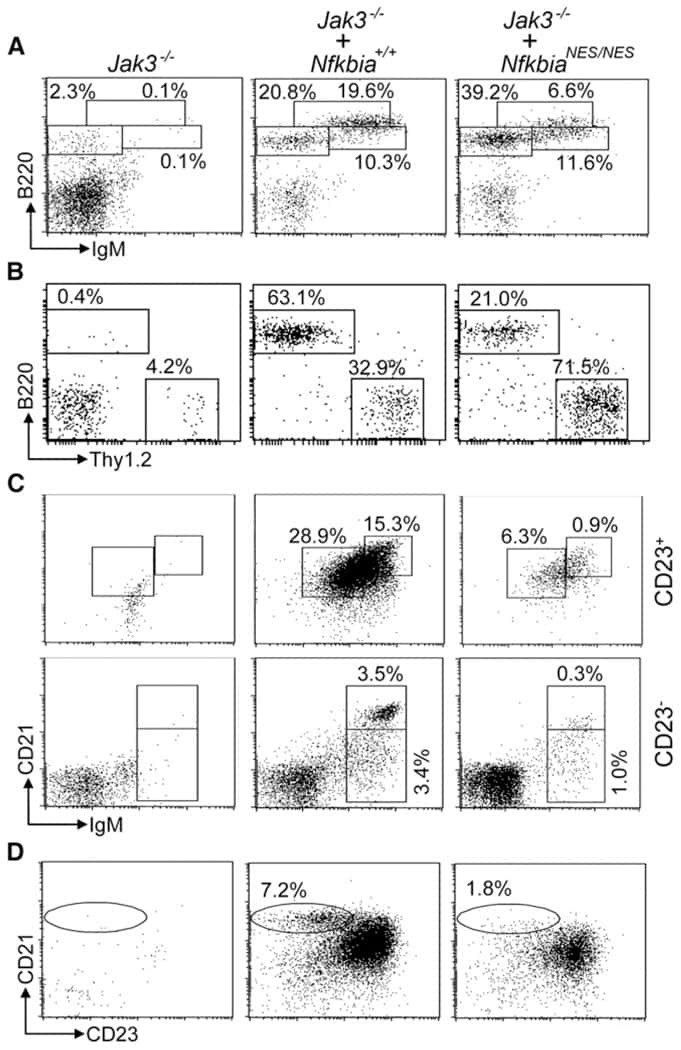
Nuclear export of the NF-κB inhibitor IκBα is required for proper B cell and secondary lymphoid tissue formation.
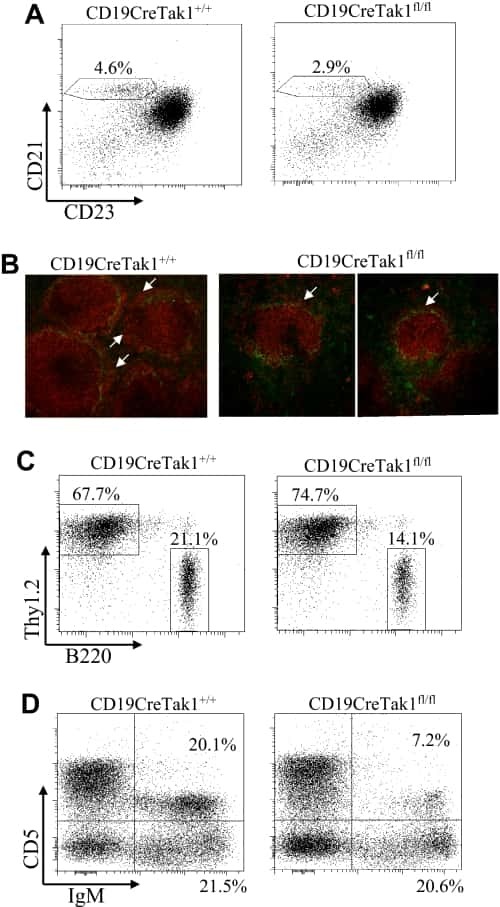
A critical role of TAK1 in B-cell receptor-mediated nuclear factor kappaB activation.
p27 deficiency cooperates with Bcl-2 but not Bax to promote T-cell lymphoma.
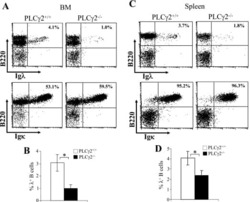
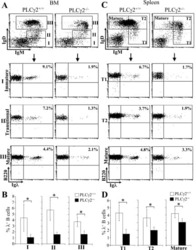
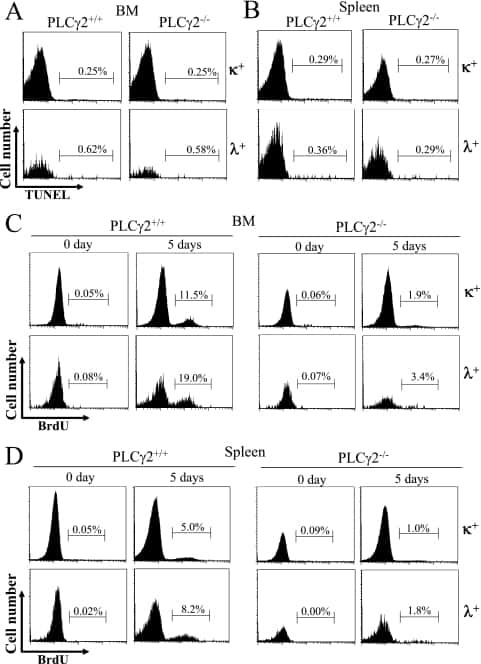
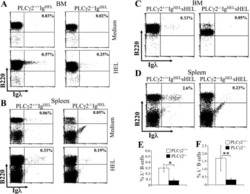
Phospholipase Cgamma2 contributes to light-chain gene activation and receptor editing.
Essential role of phospholipase C gamma 2 in early B-cell development and Myc-mediated lymphomagenesis.
A role for brain-derived neurotrophic factor in B cell development.
Impaired immune responses and B-cell proliferation in mice lacking the Id3 gene.
Identification of monoclonal antibodies for immunohistochemical staining of feline B lymphocytes in frozen and formalin-fixed paraffin-embedded tissues.
Surface antigen expression and immunoglobulin gene rearrangement during mouse pre-B cell development.
Abnormalities induced by the mutant gene Ipr: expansion of a unique lymphocyte subset.
Sun Q, Wang Y, Ji H, Sun X, Xie S, Chen L, Li S, Zeng W, Chen R, Tang Q, Zuo J, Hou L, Hosaka K, Lu Y, Liu Y, Ye Y, Yang Y
Cell death & disease 2022 Aug 19;13(8):724
Cell death & disease 2022 Aug 19;13(8):724
Transient expansion and myofibroblast conversion of adipogenic lineage precursors mediate bone marrow repair after radiation.
Zhong L, Yao L, Holdreith N, Yu W, Gui T, Miao Z, Elkaim Y, Li M, Gong Y, Pacifici M, Maity A, Busch TM, Joeng KS, Cengel K, Seale P, Tong W, Qin L
JCI insight 2022 Apr 8;7(7)
JCI insight 2022 Apr 8;7(7)
A rapid CRISPR competitive assay for in vitro and in vivo discovery of potential drug targets affecting the hematopoietic system.
Shen Y, Jiang L, Iyer VS, Raposo B, Dubnovitsky A, Boddul SV, Kasza Z, Wermeling F
Computational and structural biotechnology journal 2021;19:5360-5370
Computational and structural biotechnology journal 2021;19:5360-5370
Polyvinyl alcohol hydrolysis rate and molecular weight influence human and murine HSC activity ex vivo.
Sudo K, Yamazaki S, Wilkinson AC, Nakauchi H, Nakamura Y
Stem cell research 2021 Oct;56:102531
Stem cell research 2021 Oct;56:102531
Type 2 diabetic mice enter a state of spontaneous hibernation-like suspended animation following accumulation of uric acid.
Zhao Y, Cheng R, Zhao Y, Ge W, Yang Y, Ding Z, Xu X, Wang Z, Wu Z, Zhang J
The Journal of biological chemistry 2021 Oct;297(4):101166
The Journal of biological chemistry 2021 Oct;297(4):101166
Metabolic preconditioning in CD4+ T cells restores inducible immune tolerance in lupus-prone mice.
Wilson CS, Stocks BT, Hoopes EM, Rhoads JP, McNew KL, Major AS, Moore DJ
JCI insight 2021 Oct 8;6(19)
JCI insight 2021 Oct 8;6(19)
Impaired HA-specific T follicular helper cell and antibody responses to influenza vaccination are linked to inflammation in humans.
Hill DL, Whyte CE, Innocentin S, Lee JL, Dooley J, Wang J, James EA, Lee JC, Kwok WW, Zand MS, Liston A, Carr EJ, Linterman MA
eLife 2021 Nov 2;10
eLife 2021 Nov 2;10
The folate cycle enzyme MTHFD2 induces cancer immune evasion through PD-L1 up-regulation.
Shang M, Yang H, Yang R, Chen T, Fu Y, Li Y, Fang X, Zhang K, Zhang J, Li H, Cao X, Gu J, Xiao J, Zhang Q, Liu X, Yu Q, Wang T
Nature communications 2021 Mar 29;12(1):1940
Nature communications 2021 Mar 29;12(1):1940
Myeloid Cell CK2 Regulates Inflammation and Resistance to Bacterial Infection.
Larson SR, Bortell N, Illies A, Crisler WJ, Matsuda JL, Lenz LL
Frontiers in immunology 2020;11:590266
Frontiers in immunology 2020;11:590266
Shp1 Loss Enhances Macrophage Effector Function and Promotes Anti-Tumor Immunity.
Myers DR, Abram CL, Wildes D, Belwafa A, Welsh AMN, Schulze CJ, Choy TJ, Nguyen T, Omaque N, Hu Y, Singh M, Hansen R, Goldsmith MA, Quintana E, Smith JAM, Lowell CA
Frontiers in immunology 2020;11:576310
Frontiers in immunology 2020;11:576310
The lysophospholipase D enzyme Gdpd3 is required to maintain chronic myelogenous leukaemia stem cells.
Naka K, Ochiai R, Matsubara E, Kondo C, Yang KM, Hoshii T, Araki M, Araki K, Sotomaru Y, Sasaki K, Mitani K, Kim DW, Ooshima A, Kim SJ
Nature communications 2020 Sep 17;11(1):4681
Nature communications 2020 Sep 17;11(1):4681
Use of Busulfan to Condition Mice for Bone Marrow Transplantation.
Montecino-Rodriguez E, Dorshkind K
STAR protocols 2020 Dec 18;1(3):100159
STAR protocols 2020 Dec 18;1(3):100159
Tpl2 Protects Against Fulminant Hepatitis Through Mobilization of Myeloid-Derived Suppressor Cells.
Xu J, Pei S, Wang Y, Liu J, Qian Y, Huang M, Zhang Y, Xiao Y
Frontiers in immunology 2019;10:1980
Frontiers in immunology 2019;10:1980
Bacteroides fragilis polysaccharide A induces IL-10 secreting B and T cells that prevent viral encephalitis.
Ramakrishna C, Kujawski M, Chu H, Li L, Mazmanian SK, Cantin EM
Nature communications 2019 May 14;10(1):2153
Nature communications 2019 May 14;10(1):2153
The Hematopoietic Oxidase NOX2 Regulates Self-Renewal of Leukemic Stem Cells.
Adane B, Ye H, Khan N, Pei S, Minhajuddin M, Stevens BM, Jones CL, D'Alessandro A, Reisz JA, Zaberezhnyy V, Gasparetto M, Ho TC, Kelly KK, Myers JR, Ashton JM, Siegenthaler J, Kume T, Campbell EL, Pollyea DA, Becker MW, Jordan CT
Cell reports 2019 Apr 2;27(1):238-254.e6
Cell reports 2019 Apr 2;27(1):238-254.e6
Proapoptotic BIM Impacts B Lymphoid Homeostasis by Limiting the Survival of Mature B Cells in a Cell-Autonomous Manner.
Liu R, King A, Bouillet P, Tarlinton DM, Strasser A, Heierhorst J
Frontiers in immunology 2018;9:592
Frontiers in immunology 2018;9:592
Dysregulated TRAF3 and BCL2 Expression Promotes Multiple Classes of Mature Non-hodgkin B Cell Lymphoma in Mice.
Perez-Chacon G, Adrados M, Vallejo-Cremades MT, Lefebvre S, Reed JC, Zapata JM
Frontiers in immunology 2018;9:3114
Frontiers in immunology 2018;9:3114
ATF3 Sustains IL-22-Induced STAT3 Phosphorylation to Maintain Mucosal Immunity Through Inhibiting Phosphatases.
Glal D, Sudhakar JN, Lu HH, Liu MC, Chiang HY, Liu YC, Cheng CF, Shui JW
Frontiers in immunology 2018;9:2522
Frontiers in immunology 2018;9:2522
Host Tumor Suppressor p18(INK4c) Functions as a Potent Cell-Intrinsic Inhibitor of Murine Gammaherpesvirus 68 Reactivation and Pathogenesis.
Niemeyer BF, Oko LM, Medina EM, Oldenburg DG, White DW, Cool CD, Clambey ET, van Dyk LF
Journal of virology 2018 Mar 15;92(6)
Journal of virology 2018 Mar 15;92(6)
Adrenergic nerve degeneration in bone marrow drives aging of the hematopoietic stem cell niche.
Maryanovich M, Zahalka AH, Pierce H, Pinho S, Nakahara F, Asada N, Wei Q, Wang X, Ciero P, Xu J, Leftin A, Frenette PS
Nature medicine 2018 Jun;24(6):782-791
Nature medicine 2018 Jun;24(6):782-791
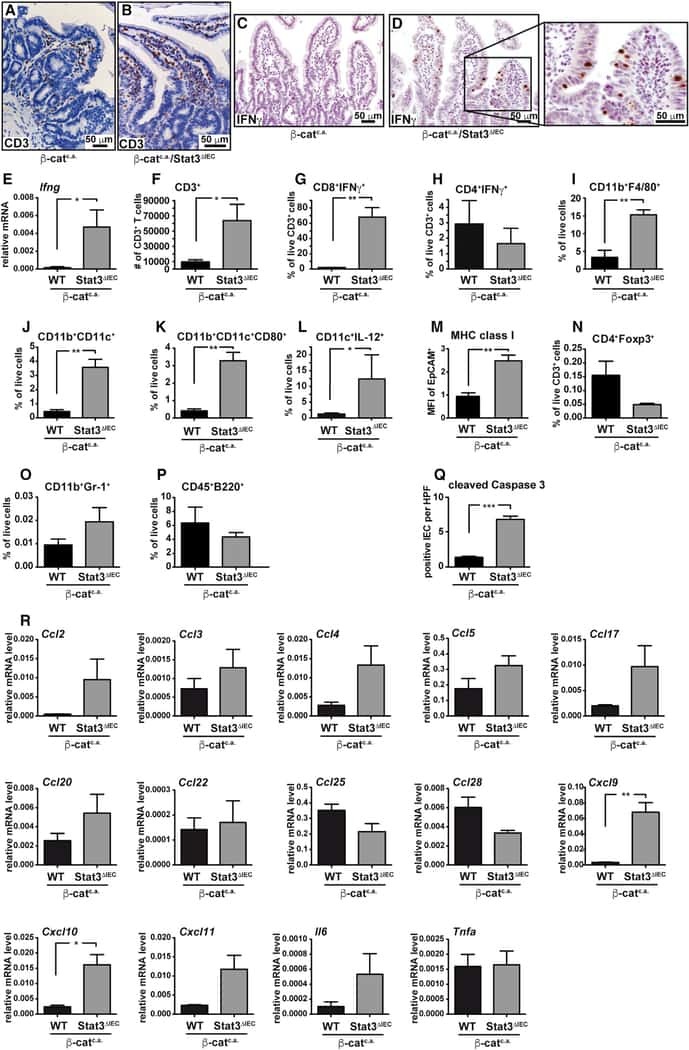
Mitophagy in Intestinal Epithelial Cells Triggers Adaptive Immunity during Tumorigenesis.
Ziegler PK, Bollrath J, Pallangyo CK, Matsutani T, Canli Ö, De Oliveira T, Diamanti MA, Müller N, Gamrekelashvili J, Putoczki T, Horst D, Mankan AK, Öner MG, Müller S, Müller-Höcker J, Kirchner T, Slotta-Huspenina J, Taketo MM, Reinheckel T, Dröse S, Larner AC, Wels WS, Ernst M, Greten TF, Arkan MC, Korn T, Wirth D, Greten FR
Cell 2018 Jun 28;174(1):88-101.e16
Cell 2018 Jun 28;174(1):88-101.e16
miR-143/145 differentially regulate hematopoietic stem and progenitor activity through suppression of canonical TGFβ signaling.
Lam J, van den Bosch M, Wegrzyn J, Parker J, Ibrahim R, Slowski K, Chang L, Martinez-Høyer S, Condorelli G, Boldin M, Deng Y, Umlandt P, Fuller M, Karsan A
Nature communications 2018 Jun 20;9(1):2418
Nature communications 2018 Jun 20;9(1):2418
Tanshinone IIA and Astragaloside IV promote the angiogenesis of mesenchymal stem cell-derived endothelial cell-like cells via upregulation of Cx37, Cx40 and Cx43.
Li Z, Zhang S, Cao L, Li W, Ye YC, Shi ZX, Wang ZR, Sun LX, Wang JW, Jia LT, Wang W
Experimental and therapeutic medicine 2018 Feb;15(2):1847-1854
Experimental and therapeutic medicine 2018 Feb;15(2):1847-1854
Inactivation of mTORC1 Signaling in Osterix-Expressing Cells Impairs B-cell Differentiation.
Wang Y, Xiao M, Tao C, Chen J, Wang Z, Yang J, Chen Z, Zou Z, Liu A, Cai D, Jiang Y, Ding C, Li M, Bai X
Journal of bone and mineral research : the official journal of the American Society for Bone and Mineral Research 2018 Apr;33(4):732-742
Journal of bone and mineral research : the official journal of the American Society for Bone and Mineral Research 2018 Apr;33(4):732-742
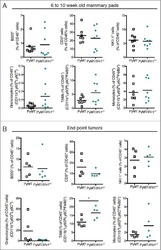
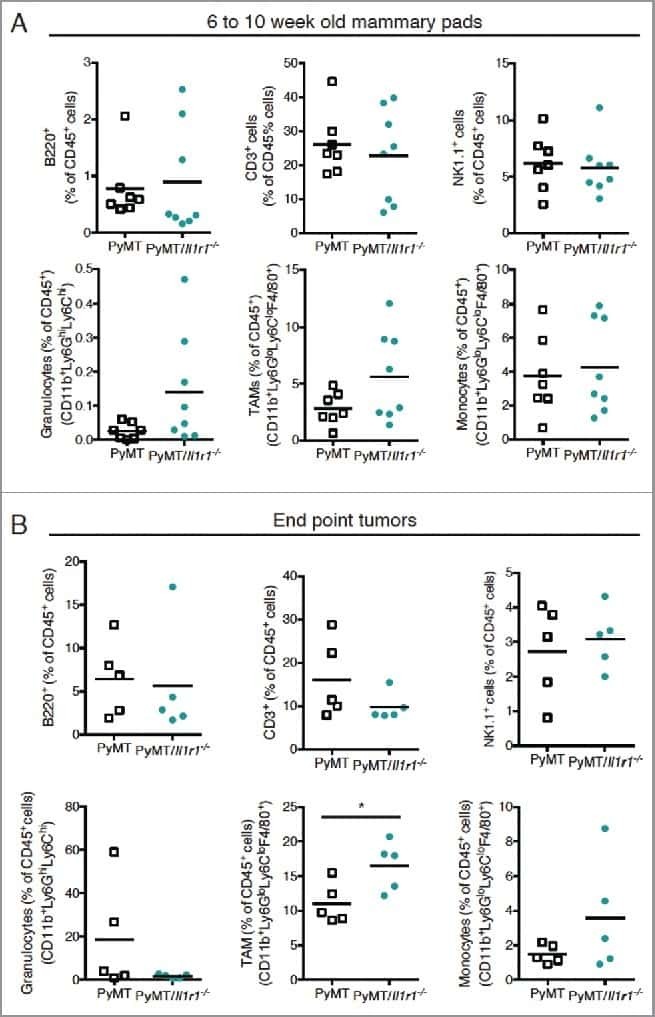
The Interleukin (IL)-1R1 pathway is a critical negative regulator of PyMT-mediated mammary tumorigenesis and pulmonary metastasis.
Dagenais M, Dupaul-Chicoine J, Douglas T, Champagne C, Morizot A, Saleh M
Oncoimmunology 2017;6(3):e1287247
Oncoimmunology 2017;6(3):e1287247
Multiple functional therapeutic effects of TnP: A small stable synthetic peptide derived from fish venom in a mouse model of multiple sclerosis.
Komegae EN, Souza TA, Grund LZ, Lima C, Lopes-Ferreira M
PloS one 2017;12(2):e0171796
PloS one 2017;12(2):e0171796
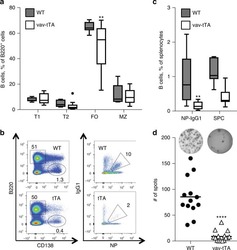
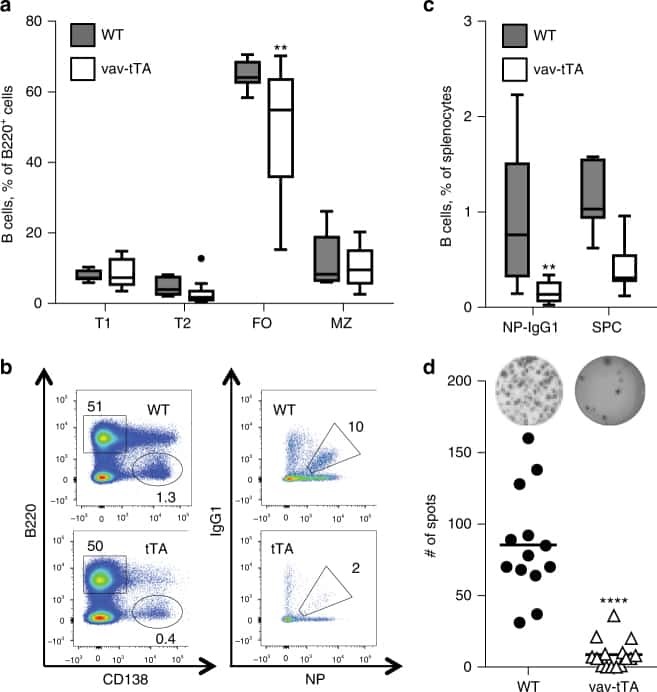
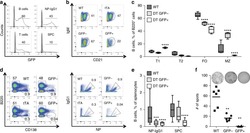
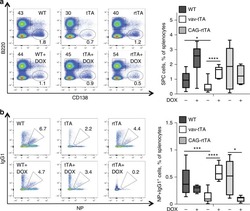
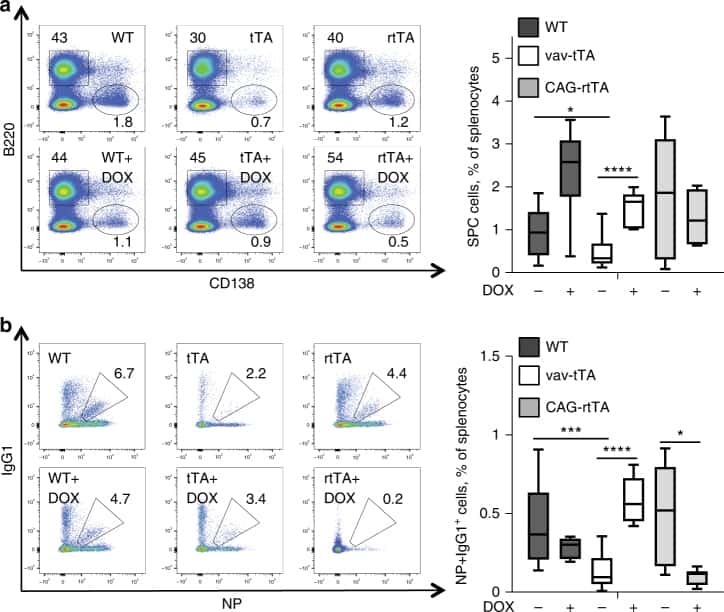
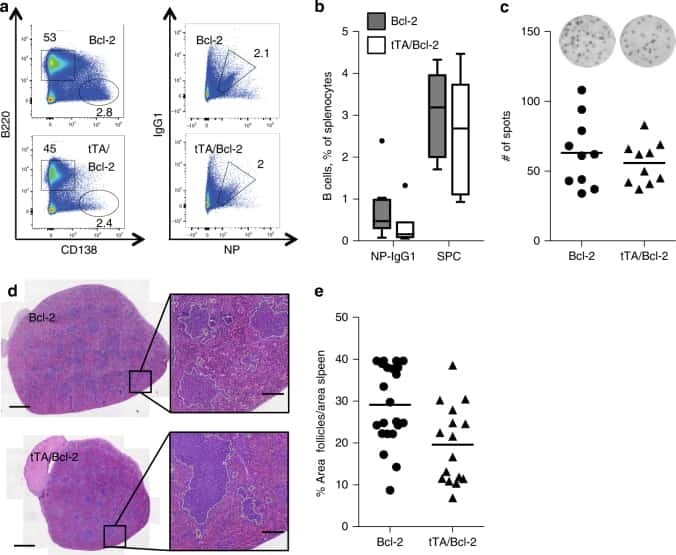
DNA-binding of the Tet-transactivator curtails antigen-induced lymphocyte activation in mice.
Ottina E, Peperzak V, Schoeler K, Carrington E, Sgonc R, Pellegrini M, Preston S, Herold MJ, Strasser A, Villunger A
Nature communications 2017 Oct 18;8(1):1028
Nature communications 2017 Oct 18;8(1):1028
EZH2 enables germinal centre formation through epigenetic silencing of CDKN1A and an Rb-E2F1 feedback loop.
Béguelin W, Rivas MA, Calvo Fernández MT, Teater M, Purwada A, Redmond D, Shen H, Challman MF, Elemento O, Singh A, Melnick AM
Nature communications 2017 Oct 12;8(1):877
Nature communications 2017 Oct 12;8(1):877
Differential cytokine contributions of perivascular haematopoietic stem cell niches.
Asada N, Kunisaki Y, Pierce H, Wang Z, Fernandez NF, Birbrair A, Ma'ayan A, Frenette PS
Nature cell biology 2017 Mar;19(3):214-223
Nature cell biology 2017 Mar;19(3):214-223
Irgm1 coordinately regulates autoimmunity and host defense at select mucosal surfaces.
Azzam KM, Madenspacher JH, Cain DW, Lai L, Gowdy KM, Rai P, Janardhan K, Clayton N, Cunningham W, Jensen H, Patel PS, Kearney JF, Taylor GA, Fessler MB
JCI insight 2017 Aug 17;2(16)
JCI insight 2017 Aug 17;2(16)
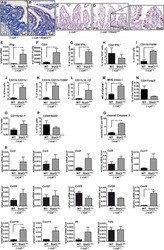
Epithelial Fli1 deficiency drives systemic autoimmunity and fibrosis: Possible roles in scleroderma.
Takahashi T, Asano Y, Sugawara K, Yamashita T, Nakamura K, Saigusa R, Ichimura Y, Toyama T, Taniguchi T, Akamata K, Noda S, Yoshizaki A, Tsuruta D, Trojanowska M, Sato S
The Journal of experimental medicine 2017 Apr 3;214(4):1129-1151
The Journal of experimental medicine 2017 Apr 3;214(4):1129-1151
Murine iPSC-Derived Macrophages as a Tool for Disease Modeling of Hereditary Pulmonary Alveolar Proteinosis due to Csf2rb Deficiency.
Mucci A, Kunkiel J, Suzuki T, Brennig S, Glage S, Kühnel MP, Ackermann M, Happle C, Kuhn A, Schambach A, Trapnell BC, Hansen G, Moritz T, Lachmann N
Stem cell reports 2016 Aug 9;7(2):292-305
Stem cell reports 2016 Aug 9;7(2):292-305
Resident T Cells Are Unable To Control Herpes Simplex Virus-1 Activity in the Brain Ependymal Region during Latency.
Menendez CM, Jinkins JK, Carr DJ
Journal of immunology (Baltimore, Md. : 1950) 2016 Aug 15;197(4):1262-75
Journal of immunology (Baltimore, Md. : 1950) 2016 Aug 15;197(4):1262-75
Overexpression of Bovine FcRn in Mice Enhances T-Dependent Immune Responses by Amplifying T Helper Cell Frequency and Germinal Center Enlargement in the Spleen.
Schneider Z, Jani PK, Szikora B, Végh A, Kövesdi D, Iliás A, Cervenak J, Balogh P, Kurucz I, Kacskovics I
Frontiers in immunology 2015;6:357
Frontiers in immunology 2015;6:357
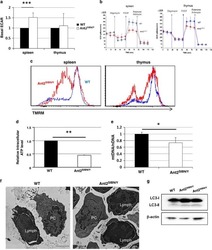
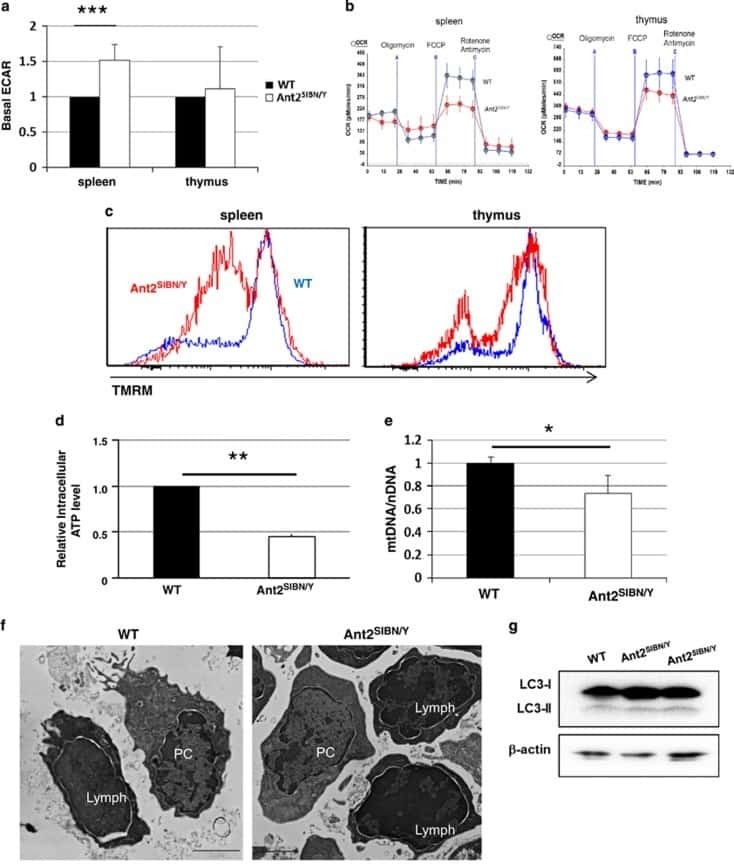
Mitochondrial ATP transporter Ant2 depletion impairs erythropoiesis and B lymphopoiesis.
Cho J, Seo J, Lim CH, Yang L, Shiratsuchi T, Lee MH, Chowdhury RR, Kasahara H, Kim JS, Oh SP, Lee YJ, Terada N
Cell death and differentiation 2015 Sep;22(9):1437-50
Cell death and differentiation 2015 Sep;22(9):1437-50
Endothelial Gata5 transcription factor regulates blood pressure.
Messaoudi S, He Y, Gutsol A, Wight A, Hébert RL, Vilmundarson RO, Makrigiannis AP, Chalmers J, Hamet P, Tremblay J, McPherson R, Stewart AFR, Touyz RM, Nemer M
Nature communications 2015 Nov 30;6:8835
Nature communications 2015 Nov 30;6:8835
Disruption of p21-activated kinase 1 gene diminishes atherosclerosis in apolipoprotein E-deficient mice.
Singh NK, Kotla S, Dyukova E, Traylor JG Jr, Orr AW, Chernoff J, Marion TN, Rao GN
Nature communications 2015 Jun 24;6:7450
Nature communications 2015 Jun 24;6:7450
Aging-associated inflammation promotes selection for adaptive oncogenic events in B cell progenitors.
Henry CJ, Casás-Selves M, Kim J, Zaberezhnyy V, Aghili L, Daniel AE, Jimenez L, Azam T, McNamee EN, Clambey ET, Klawitter J, Serkova NJ, Tan AC, Dinarello CA, DeGregori J
The Journal of clinical investigation 2015 Dec;125(12):4666-80
The Journal of clinical investigation 2015 Dec;125(12):4666-80
B-cell-intrinsic hepatitis C virus expression leads to B-cell-lymphomagenesis and induction of NF-κB signalling.
Kasama Y, Mizukami T, Kusunoki H, Peveling-Oberhag J, Nishito Y, Ozawa M, Kohara M, Mizuochi T, Tsukiyama-Kohara K
PloS one 2014;9(3):e91373
PloS one 2014;9(3):e91373
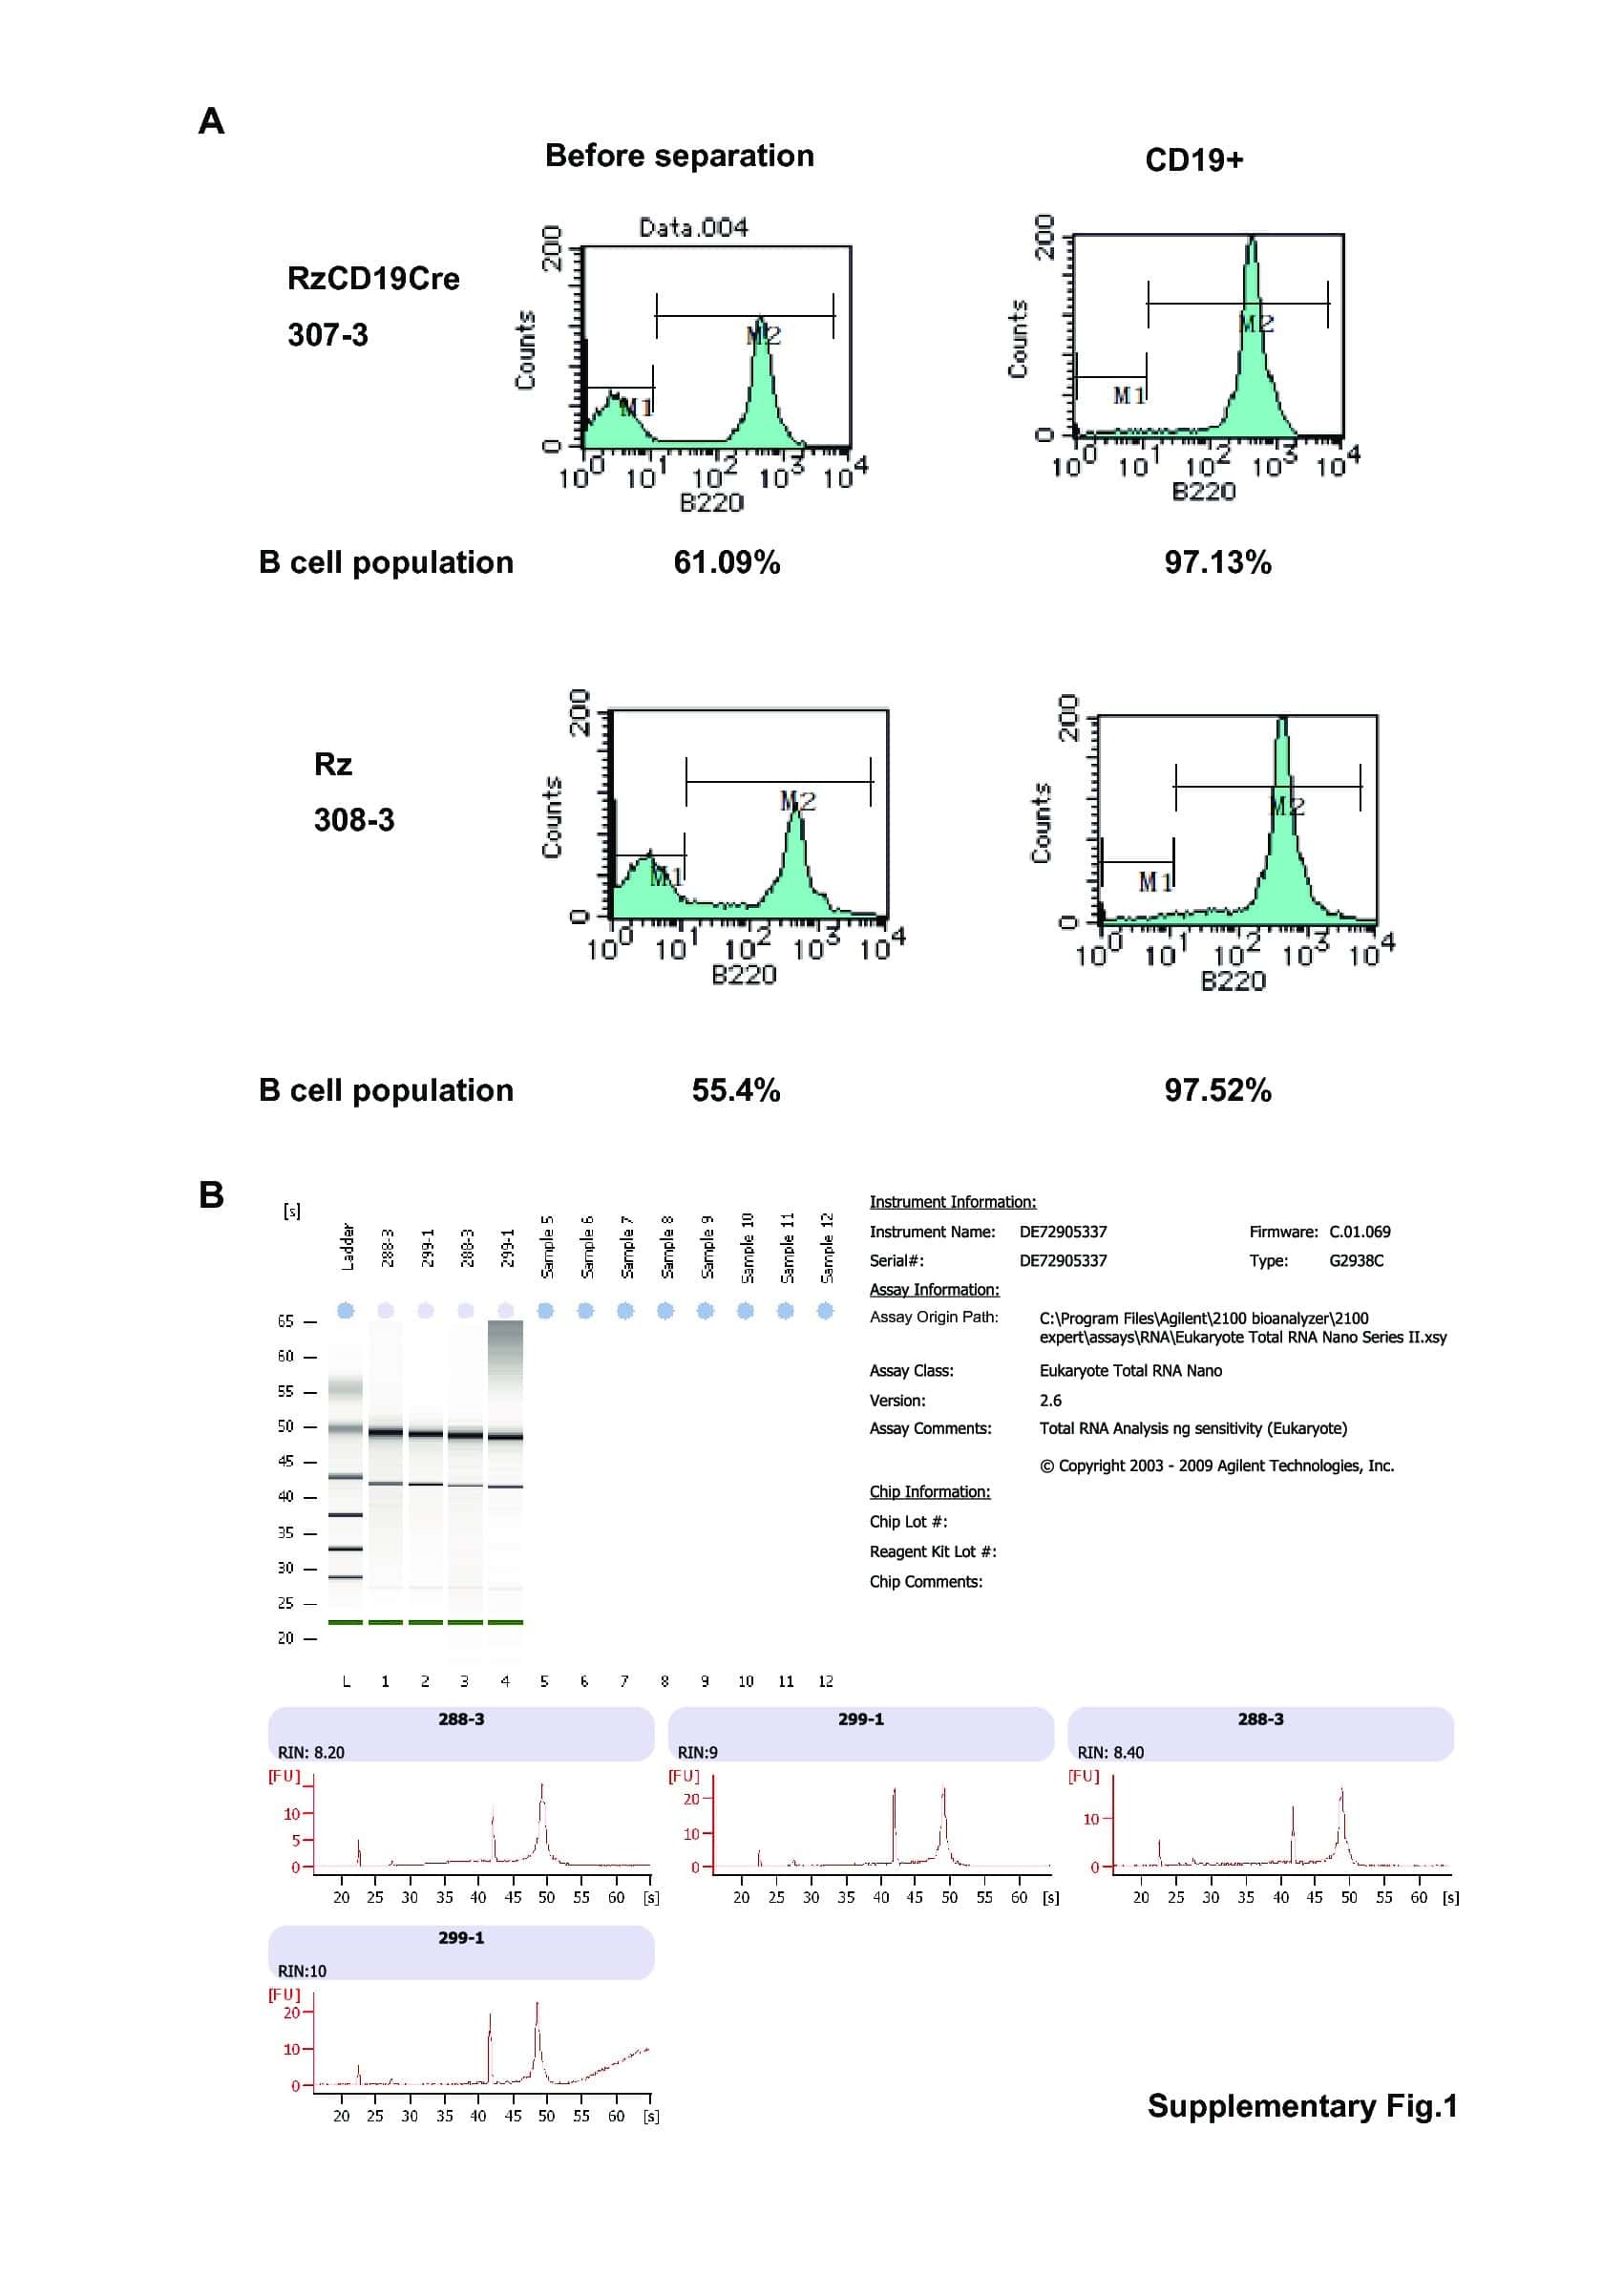
Transcription elongation factor ELL2 drives Ig secretory-specific mRNA production and the unfolded protein response.
Park KS, Bayles I, Szlachta-McGinn A, Paul J, Boiko J, Santos P, Liu J, Wang Z, Borghesi L, Milcarek C
Journal of immunology (Baltimore, Md. : 1950) 2014 Nov 1;193(9):4663-74
Journal of immunology (Baltimore, Md. : 1950) 2014 Nov 1;193(9):4663-74
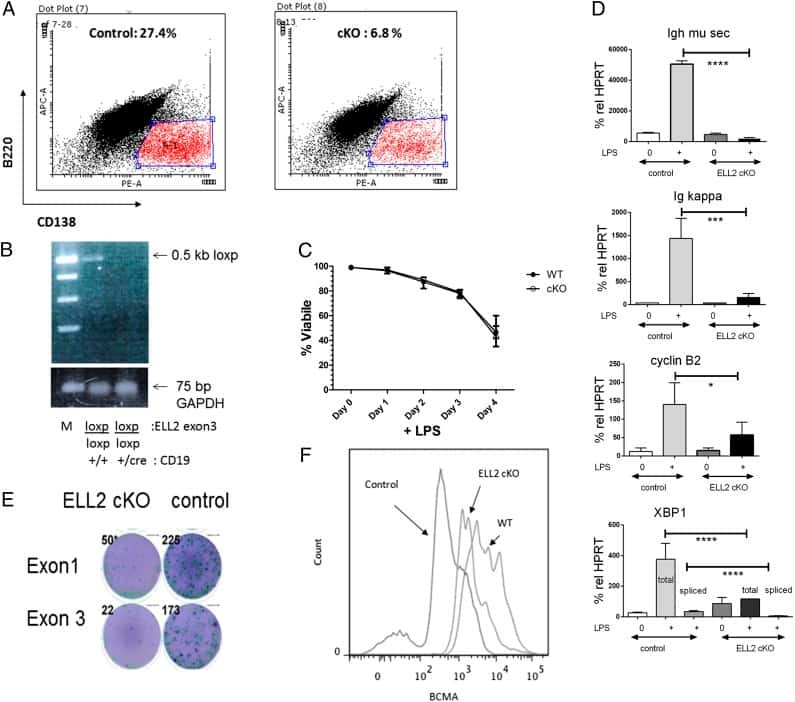
Rhof promotes murine marginal zone B cell development.
Kishimoto M, Matsuda T, Yanase S, Katsumi A, Suzuki N, Ikejiri M, Takagi A, Ikawa M, Kojima T, Kunishima S, Kiyoi H, Naoe T, Matsushita T, Maruyama M
Nagoya journal of medical science 2014 Aug;76(3-4):293-305
Nagoya journal of medical science 2014 Aug;76(3-4):293-305
IκBε is a key regulator of B cell expansion by providing negative feedback on cRel and RelA in a stimulus-specific manner.
Alves BN, Tsui R, Almaden J, Shokhirev MN, Davis-Turak J, Fujimoto J, Birnbaum H, Ponomarenko J, Hoffmann A
Journal of immunology (Baltimore, Md. : 1950) 2014 Apr 1;192(7):3121-32
Journal of immunology (Baltimore, Md. : 1950) 2014 Apr 1;192(7):3121-32
Siglec-G deficiency leads to more severe collagen-induced arthritis and earlier onset of lupus-like symptoms in MRL/lpr mice.
Bökers S, Urbat A, Daniel C, Amann K, Smith KG, Espéli M, Nitschke L
Journal of immunology (Baltimore, Md. : 1950) 2014 Apr 1;192(7):2994-3002
Journal of immunology (Baltimore, Md. : 1950) 2014 Apr 1;192(7):2994-3002
TDP2-dependent non-homologous end-joining protects against topoisomerase II-induced DNA breaks and genome instability in cells and in vivo.
Gómez-Herreros F, Romero-Granados R, Zeng Z, Alvarez-Quilón A, Quintero C, Ju L, Umans L, Vermeire L, Huylebroeck D, Caldecott KW, Cortés-Ledesma F
PLoS genetics 2013;9(3):e1003226
PLoS genetics 2013;9(3):e1003226
Reciprocal effects of rab7 deletion in activated and neglected T cells.
Roy SG, Stevens MW, So L, Edinger AL
Autophagy 2013 Jul;9(7):1009-23
Autophagy 2013 Jul;9(7):1009-23
Activation-induced cytidine deaminase-initiated off-target DNA breaks are detected and resolved during S phase.
Hasham MG, Snow KJ, Donghia NM, Branca JA, Lessard MD, Stavnezer J, Shopland LS, Mills KD
Journal of immunology (Baltimore, Md. : 1950) 2012 Sep 1;189(5):2374-82
Journal of immunology (Baltimore, Md. : 1950) 2012 Sep 1;189(5):2374-82
Critical role of B cell lymphoma 10 in BAFF-regulated NF-κB activation and survival of anergic B cells.
Yu M, Chen Y, He Y, Podd A, Fu G, Wright JA, Kleiman E, Khan WN, Wen R, Wang D
Journal of immunology (Baltimore, Md. : 1950) 2012 Dec 1;189(11):5185-93
Journal of immunology (Baltimore, Md. : 1950) 2012 Dec 1;189(11):5185-93
PAD4-mediated neutrophil extracellular trap formation is not required for immunity against influenza infection.
Hemmers S, Teijaro JR, Arandjelovic S, Mowen KA
PloS one 2011;6(7):e22043
PloS one 2011;6(7):e22043
Nuclear export of the NF-κB inhibitor IκBα is required for proper B cell and secondary lymphoid tissue formation.
Wuerzberger-Davis SM, Chen Y, Yang DT, Kearns JD, Bates PW, Lynch C, Ladell NC, Yu M, Podd A, Zeng H, Huang TT, Wen R, Hoffmann A, Wang D, Miyamoto S
Immunity 2011 Feb 25;34(2):188-200
Immunity 2011 Feb 25;34(2):188-200
A critical role of TAK1 in B-cell receptor-mediated nuclear factor kappaB activation.
Schuman J, Chen Y, Podd A, Yu M, Liu HH, Wen R, Chen ZJ, Wang D
Blood 2009 May 7;113(19):4566-74
Blood 2009 May 7;113(19):4566-74
p27 deficiency cooperates with Bcl-2 but not Bax to promote T-cell lymphoma.
Cheng N, van de Wetering CI, Knudson CM
PloS one 2008 Apr 2;3(4):e1911
PloS one 2008 Apr 2;3(4):e1911
Phospholipase Cgamma2 contributes to light-chain gene activation and receptor editing.
Bai L, Chen Y, He Y, Dai X, Lin X, Wen R, Wang D
Molecular and cellular biology 2007 Sep;27(17):5957-67
Molecular and cellular biology 2007 Sep;27(17):5957-67
Essential role of phospholipase C gamma 2 in early B-cell development and Myc-mediated lymphomagenesis.
Wen R, Chen Y, Bai L, Fu G, Schuman J, Dai X, Zeng H, Yang C, Stephan RP, Cleveland JL, Wang D
Molecular and cellular biology 2006 Dec;26(24):9364-76
Molecular and cellular biology 2006 Dec;26(24):9364-76
A role for brain-derived neurotrophic factor in B cell development.
Schuhmann B, Dietrich A, Sel S, Hahn C, Klingenspor M, Lommatzsch M, Gudermann T, Braun A, Renz H, Nockher WA
Journal of neuroimmunology 2005 Jun;163(1-2):15-23
Journal of neuroimmunology 2005 Jun;163(1-2):15-23
Impaired immune responses and B-cell proliferation in mice lacking the Id3 gene.
Pan L, Sato S, Frederick JP, Sun XH, Zhuang Y
Molecular and cellular biology 1999 Sep;19(9):5969-80
Molecular and cellular biology 1999 Sep;19(9):5969-80
Identification of monoclonal antibodies for immunohistochemical staining of feline B lymphocytes in frozen and formalin-fixed paraffin-embedded tissues.
Monteith CE, Chelack BJ, Davis WC, Haines DM
Canadian journal of veterinary research = Revue canadienne de recherche veterinaire 1996 Jul;60(3):193-8
Canadian journal of veterinary research = Revue canadienne de recherche veterinaire 1996 Jul;60(3):193-8
Surface antigen expression and immunoglobulin gene rearrangement during mouse pre-B cell development.
Coffman RL
Immunological reviews 1982;69:5-23
Immunological reviews 1982;69:5-23
Abnormalities induced by the mutant gene Ipr: expansion of a unique lymphocyte subset.
Morse HC 3rd, Davidson WF, Yetter RA, Murphy ED, Roths JB, Coffman RL
Journal of immunology (Baltimore, Md. : 1950) 1982 Dec;129(6):2612-5
Journal of immunology (Baltimore, Md. : 1950) 1982 Dec;129(6):2612-5
No comments: Submit comment
Supportive validation
- Submitted by
- Invitrogen Antibodies (provider)
- Main image

- Experimental details
- Staining of BALB/c splenocytes with Anti-Mouse CD3e FITC (Product # 11-0031-82) and 0.06 µg of Rat IgG2a K Isotype Control PE-Cyanine5-5 (Product # 35-4321-82) (left) or 0.06 µg of Anti-Human/Mouse CD45R (B220) PE-Cyanine5-5 (right). Total viable cells were used for analysis.

Supportive validation
- Submitted by
- Invitrogen Antibodies (provider)
- Main image
- Experimental details
- NULL

- Submitted by
- Invitrogen Antibodies (provider)
- Main image

- Experimental details
- NULL
- Submitted by
- Invitrogen Antibodies (provider)
- Main image
- Experimental details
- NULL
- Submitted by
- Invitrogen Antibodies (provider)
- Main image

- Experimental details
- NULL
- Submitted by
- Invitrogen Antibodies (provider)
- Main image

- Experimental details
- NULL
- Submitted by
- Invitrogen Antibodies (provider)
- Main image
- Experimental details
- NULL

- Submitted by
- Invitrogen Antibodies (provider)
- Main image
- Experimental details
- NULL

- Submitted by
- Invitrogen Antibodies (provider)
- Main image
- Experimental details
- NULL

- Submitted by
- Invitrogen Antibodies (provider)
- Main image

- Experimental details
- NULL
- Submitted by
- Invitrogen Antibodies (provider)
- Main image
- Experimental details
- NULL

- Submitted by
- Invitrogen Antibodies (provider)
- Main image
- Experimental details
- NULL
- Submitted by
- Invitrogen Antibodies (provider)
- Main image

- Experimental details
- NULL
- Submitted by
- Invitrogen Antibodies (provider)
- Main image
- Experimental details
- NULL

- Submitted by
- Invitrogen Antibodies (provider)
- Main image
- Experimental details
- NULL

- Submitted by
- Invitrogen Antibodies (provider)
- Main image
- Experimental details
- NULL

- Submitted by
- Invitrogen Antibodies (provider)
- Main image
- Experimental details
- NULL
- Submitted by
- Invitrogen Antibodies (provider)
- Main image

- Experimental details
- NULL
- Submitted by
- Invitrogen Antibodies (provider)
- Main image

- Experimental details
- NULL
- Submitted by
- Invitrogen Antibodies (provider)
- Main image
- Experimental details
- NULL

- Submitted by
- Invitrogen Antibodies (provider)
- Main image
- Experimental details
- NULL

- Submitted by
- Invitrogen Antibodies (provider)
- Main image
- Experimental details
- NULL

- Submitted by
- Invitrogen Antibodies (provider)
- Main image
- Experimental details
- NULL

- Submitted by
- Invitrogen Antibodies (provider)
- Main image

- Experimental details
- NULL
- Submitted by
- Invitrogen Antibodies (provider)
- Main image
- Experimental details
- NULL

- Submitted by
- Invitrogen Antibodies (provider)
- Main image
- Experimental details
- NULL

- Submitted by
- Invitrogen Antibodies (provider)
- Main image
- Experimental details
- NULL
- Submitted by
- Invitrogen Antibodies (provider)
- Main image
- Experimental details
- NULL
- Submitted by
- Invitrogen Antibodies (provider)
- Main image
- Experimental details
- NULL
- Submitted by
- Invitrogen Antibodies (provider)
- Main image
- Experimental details
- NULL
- Submitted by
- Invitrogen Antibodies (provider)
- Main image
- Experimental details
- NULL
- Submitted by
- Invitrogen Antibodies (provider)
- Main image
- Experimental details
- NULL

- Submitted by
- Invitrogen Antibodies (provider)
- Main image
- Experimental details
- NULL
- Submitted by
- Invitrogen Antibodies (provider)
- Main image

- Experimental details
- NULL
- Submitted by
- Invitrogen Antibodies (provider)
- Main image
- Experimental details
- NULL
- Submitted by
- Invitrogen Antibodies (provider)
- Main image
- Experimental details
- NULL
- Submitted by
- Invitrogen Antibodies (provider)
- Main image
- Experimental details
- NULL
- Submitted by
- Invitrogen Antibodies (provider)
- Main image

- Experimental details
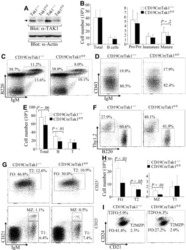
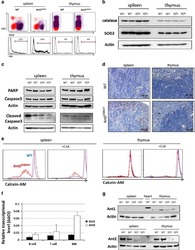
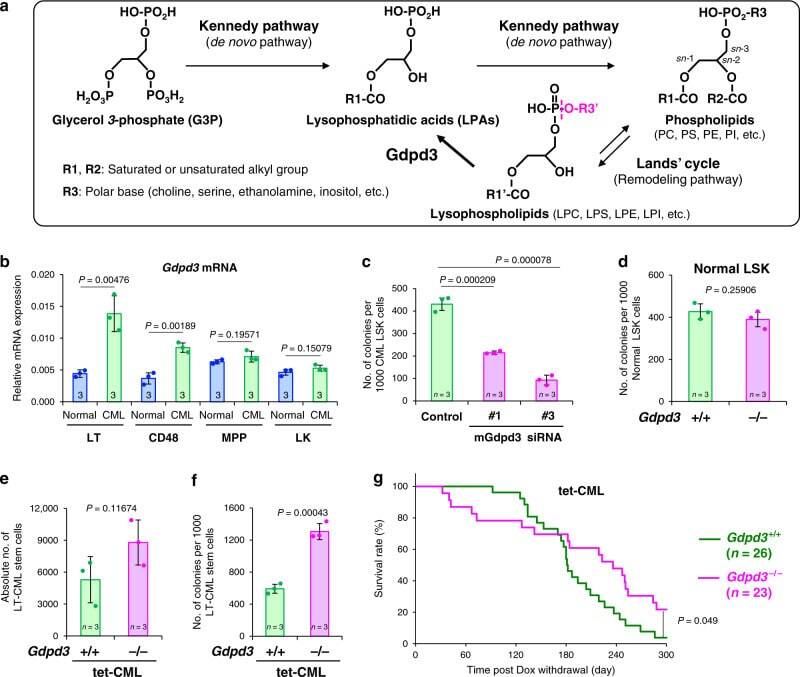
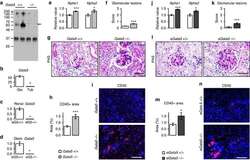
- Fig. 1 Gdpd3 is implicated in CML disease initiation in vivo. a Diagram of pathways of lysophospholipid biosynthesis. G3P is converted into LPAs, and LPAs are then converted into phospholipids by the addition of polar bases via the Kennedy (de novo) pathway. The Lands'' cycle (remodelling pathway) generates lysophospholipids of distinct composition by substituting fatty acid ester and polar base groups of phospholipids. Lysophospholipase D Gdpd3 converts lysophospholipids back into LPAs by catalysing hydrolysis (magenta dotted line). (PC Phosphatidylcholine, PS Phosphatidylserine, PE Phosphatidylethanolamine, PI Phosphatidylinositol, LPC Lysophosphatidylcholine, LPS Lysophosphatidylserine, LPE Lysophosphatidylethanolamine, LPI Lysophosphatidylinositol). b qRT-PCR determination of Gdpd3 mRNA expression in LT-stem (LT), CD48, MPP, and LK cells (see Supplementary Fig.2) isolated from Gdpd3 +/+ tet-CML-affected (SCL-tTA + TRE-BCR-ABL1 + ) mice (one male, six females) or normal littermate (SCL-tTA + ) mice (four males, four females). Data are the mean ratio +- s.d. of transcript levels normalised to Actb ( n = 3 biologically independent samples) ( P -value, unpaired two-sided Student''s t -test). c Quantitation of the colony-forming capacity of Gdpd3 +/+ CML-LSK cells that were transduced with/without Cy3-labelled siRNA targetting mouse Gdpd3 mRNA (mGdpd3 siRNA #1 or #3). Cy3 + and Cy3 - CML-LSK cells were purified at 3 days post-transduction and plated in semi-solid methylcellulo
- Submitted by
- Invitrogen Antibodies (provider)
- Main image
- Experimental details
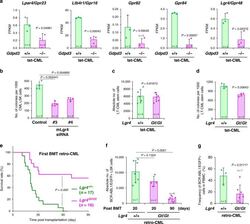
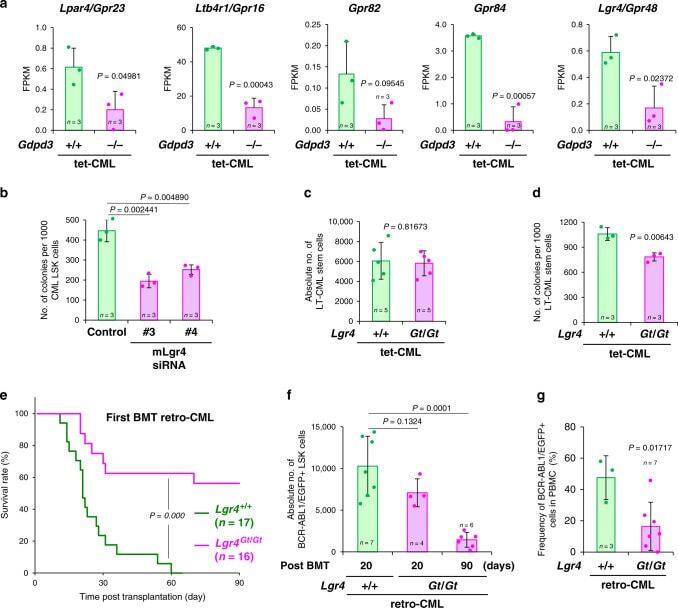
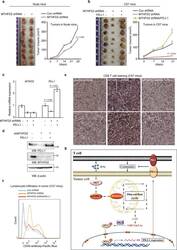
- Fig. 7 Lgr4/Gpr48 is involved in CML stem cell self-renewal in vivo. a RNA-Seq determinations of mRNA levels of the indicated GPCR family genes in LT-CML stem cells isolated from Gdpd3 +/+ tet-CML-affected mice (22 males, 12 females) and Gdpd3 -/- tet-CML-affected mice (five males, five females). Results are expressed as FPKM (see Methods). Data are the mean FPKM +- s.d. ( n = 3 biologically independent samples) ( P -value, unpaired two-sided Student''s t -test). Results of the MA-plot and GO term enrichment analyses for these RNA-Seq data are shown in Supplementary Fig. 11a, b . b Quantitation of the colony-forming capacity of Gdpd3 +/+ CML-LSK cells that were transduced with/without Cy3-labelled siRNA targetting mouse Lgr4/Gpr48 mRNA (mLgr4 #3 or Lgr4 #4). Cy3 + and Cy3 - CML-LSK cells were purified at 3 days post-transduction and plated in a semi-solid methylcellulose medium. Data are the mean colony number +- s.d. ( n = 3) and are representative of three biologically independent experiments. ( P -value compared with control, unpaired two-sided Student''s t -test). The relevant FACS data are shown in Supplementary Fig. 12 . c Absolute numbers of LT-CML stem cells isolated from BM of the two hind limbs of Lgr4 +/+ tet-CML-affected mice (four males, one female) and Lgr4 Gt/Gt tet-CML-affected mice (five females) ( n = 5 biologically independent samples). Data are the mean absolute numbers +- s.d. of LT-CML stem cells ( P -value, unpaired two-sided Student''s t -test). (See S
- Submitted by
- Invitrogen Antibodies (provider)
- Main image

- Experimental details
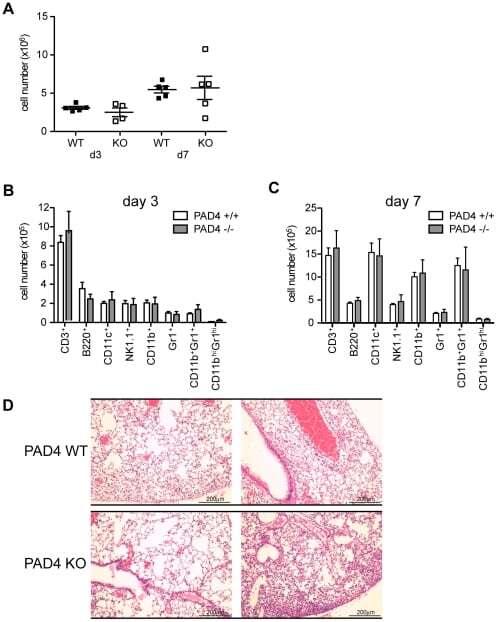
- Figure 4 Lung leukocyte infiltration during influenza infection is comparable between PAD4 WT and KO mice. Experimental setup as described in Figure 2 . (A-C) Five mice per group were analyzed at d3 or d7 post infection. Leukocytes were isolated from infected lungs. (A) Total cell numbers of lung-infiltrating leukocytes at d3 and d7 p.i. Each symbol represents an individual mouse, filled squares represent PAD4 WT, open squares depict PAD4 KO mice. (B+C) The subsets of infiltrating leukocytes were enumerated by flow cytometry both at d3 p.i. (B) and d7 p.i. (C). Gated populations are indicated at the bottom of the graph. Total numbers of infiltrating cells are shown. WT mice are depicted in white bars, KO mice as grey bars. Bars represent mean + SEM. (D) Lungs for histological examination were harvested at d8 p.i. (5 mice/group). Leukocyte infiltration was assessed on H&E stained paraffin sections. Sections from two representative mice per group are shown. The scale bar indicates 200 um. Data is representative of two independent experiments.
- Submitted by
- Invitrogen Antibodies (provider)
- Main image
- Experimental details
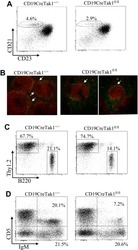
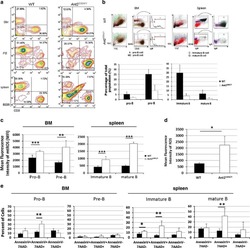
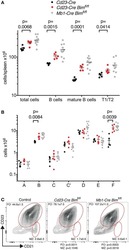
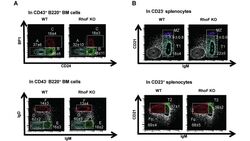
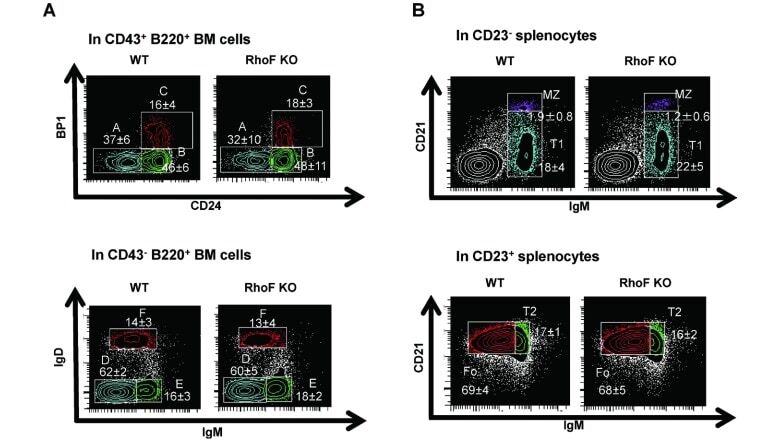
- Fig. 4 Analysis of B cell development in bone marrow and spleen. A. FACS analysis of BM B cells. BM cells from WT and RhoF KO mice (6-7 weeks old, n = 5, male: 40%) were stained with antibodies against CD43, B220, BP1, and CD24 and analyzed by flow cytometry. The number shows the percentage (mean +- standard deviation) of the indicated subpopulation within the parent population; Fraction A (germline pro-B cells), fraction B (DJ-rearranged pro-B cells), fraction C (Early pre-B cells), fraction D (Late pre-B cells), fraction E (newly formed B cells), and fraction F (follicular-type recirculating B cells). The figures are representatives of three independent experiments. B. FACS analysis of B cells from the spleen. Splenocytes from WT and RhoF KO mice (6-7 weeks old, n = 6, male: 33%) were stained with antibodies against CD23, CD21, and IgM and analyzed by flow cytometry. The number shows the percentage (mean +- standard deviation) of the indicated subpopulation within the parent population; T1 (Transitional 1), T2 (Transitional 2), Fo (mature follicular B cells), and MZ (MZ B cells). C. The number of B cell subsets in BM was calculated by multiplying the total number of viable (trypan blue negative) BM cells by the fraction of the target population in viable (7AAD negative) cells. The data are shown as mean +- standard deviation (6-7 weeks old, n = 5, male: 40%). White bars: WT. Black bars: RhoF KO. D. The number of B cell subsets in the spleen was also calculated by multiplyin
- Submitted by
- Invitrogen Antibodies (provider)
- Main image
- Experimental details
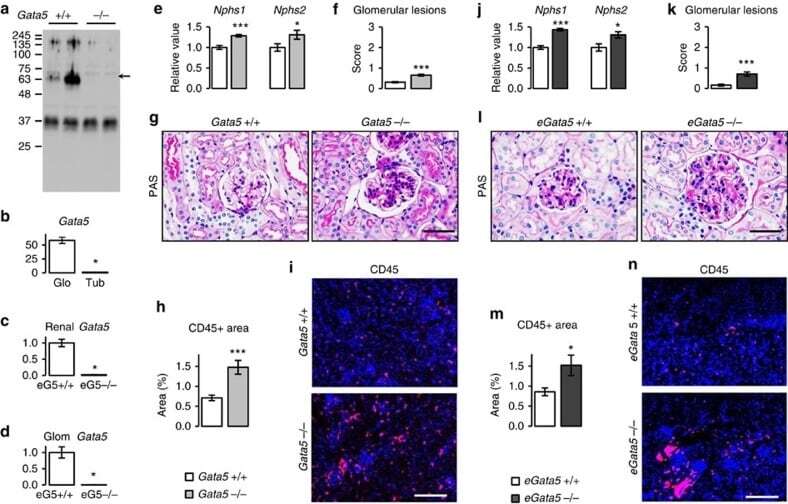
- Figure 2 Loss of Gata5 from renal endothelial cells leads to renal alterations. ( a ) GATA5 is expressed in the kidney as assessed by western blot performed on total kidney extracts. ( b ) Gata5 is essentially expressed in the glomeruli as assessed by qPCR on isolated glomeruli (Glo) and microdissected tubules (Tub) from Wt mice kidneys. ( n =3-5 per group). The results are reported as mean+-s.e.m. * P
- Submitted by
- Invitrogen Antibodies (provider)
- Main image
- Experimental details
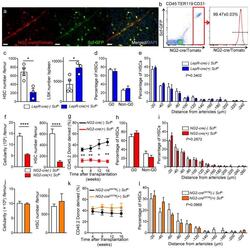
- Figure 5 NG2-cre, but not NG2-cre ERTM , targeted cells are the source of Scf in the bone marrow (a) Whole-mount sternum from NG2-cre/ iTdTomato/ Scf-GFP mice, anti-VE-cadherin. Representative images from 3 mice. Scale bars, 20 mum. (b) Representative FACS plot showing percentage of NG2-cre/ iTdTomato + cells within CD45 - TER119 - CD31 - Scf-GFP + cells. n=3 mice. (c-e) Analyses of LepR-cre/ Scf fl/- mice. (c) Numbers of HSCs (left) in BM and LSK cells in spleen (right). n=4 mice for cre (-), n=3 mice for cre (+). (d) FACS analyses of HSC (CD150 + CD48 - LSK) cell cycle with Ki-67 and Hoechst 33342 staining. n=5 mice for cre (-), n=6 mice for cre (+). (e) HSC localization relative to arterioles. Error bars: n=3 mice. P value has been calculated using n=272 HSCs for cre (-), 293 HSCs for cre (+) pooled from 3 mice per group. P =0.3402. (f-i) Analyses of NG2-cre/ Scf fl/- mice. (f) Numbers of total BM cells (left) and CD150 + CD48 - LSK HSCs (right) in BM. n=5 mice for cre (-), n=7 mice for cre (+). (g) Percentages of donor-derived cells after competitive reconstitution. n=5 mice for cre (-), n=7 mice for cre (+). (h) FACS analyses of HSC cell cycle with Ki-67 and Hoechst 33342 staining. n=6 mice for cre (-), n=7 mice for cre (+). (i) HSC localization relative to arterioles. Error bars: n=3 mice. P value has been calculated using n=224 HSCs for cre (-), 274 HSCs for cre (+) pooled from 3 mice per group. P =0.2872. (j-l) Analyses of NG2-cre ERTM / Scf fl/- mice. (j) Absolute nu
- Submitted by
- Invitrogen Antibodies (provider)
- Main image
- Experimental details
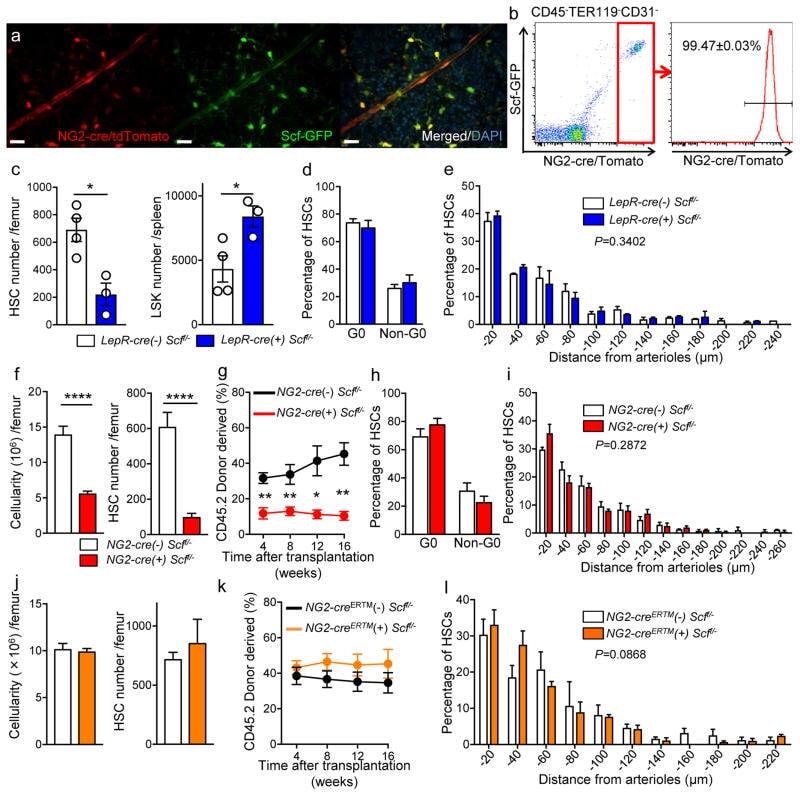
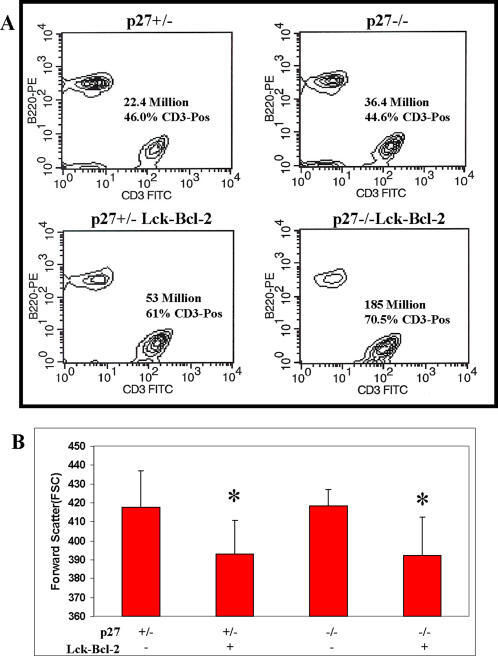
- Figure 2 Splenic T cell hyperplasia and T cell size in p27 -/- Lck-Bcl-2 mice. A) Total splenic cells from mice of the indicated genotypes were isolated and stained with anti-B220-PE and anti-CD3-FITC antibodies as described in the Materials and Methods . The percentage of CD3-positive cells and the total number of splenic T cells (total # of splenic cells X %CD3) is shown. The data are representative of at least three mice from each genotype. B) The Mean Forward Scatter of CD3 positive splenic T cells was determined by staining with an anti-CD3 antibody as described in the Materials and Methods . The Mean+-SD of at least 5 mice is shown for the genotypes indicated. * P
- Submitted by
- Invitrogen Antibodies (provider)
- Main image
- Experimental details
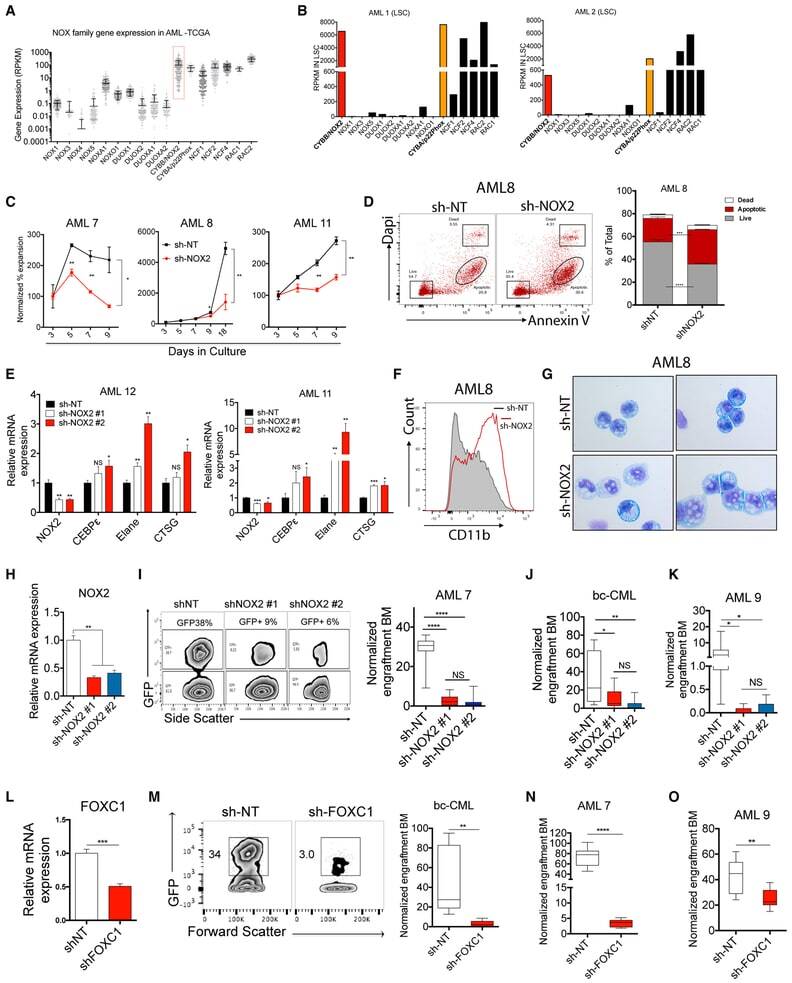
- Figure 7. NOX2 and FOXC1 Are Important for the Growth of Primary Human Myeloid Leukemia Cells (A) The Cancer Genome Atlas (TCGA) database for AML was used to analyze the expression levels of several NADPH-dependent oxidases (NOX1-NOX5), accessory subunits (NCF1, NCF2, NCF4, NOXA1, NOXO1, p22Phox, RAC1, and RAC2) as well as related oxido-reductase enzymes (dual-oxidases 1,2, A2). The reads per kilobase of transcript per million mapped reads (RPKM) values for each gene in a total of 188 AMLs are shown. (B) RNA-seq analysis was performed on functionally validated leukemic stem cells isolated from human primary AMLs. The RPKM value for each gene is shown. Unpublished data are used with permission. Additional supporting data are shown in Figure S7A . (C) Equal numbers of control or shNOX2-transduced primary AML cells were cultured in vitro in the presence of 10 ng/mL of IL-3, SCF, and FL3, and the relative percent expansion is reported for each specimen. n = 3, mean +- SD. *p < 0.05; **p < 0.01. (D) Control and shNOX2 primary AML cells were purified and cultured in vitro for 12 days. Annexin V, DAPI staining was performed to evaluate the degree of apoptotic cell death. A representative flow plot (left) and quantitation of 3 technical triplicates (right) are shown. Additional data are shown in Figure S7B . (E) The relative expression level of NOX2 , CEBP epsilon, Elane , and CTSG is shown in AML specimens in which NOX2 was knocked down using shRNAs. Additional supporting data are p
- Submitted by
- Invitrogen Antibodies (provider)
- Main image

- Experimental details
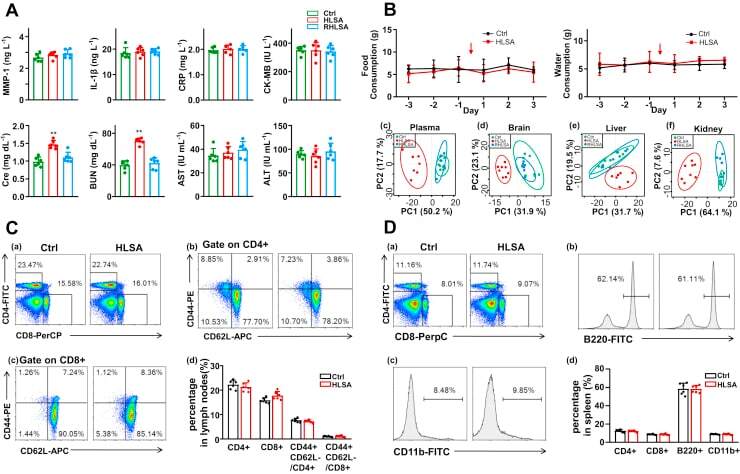
- Figure 6 Assessments of organ damage and mouse metabolites during HLSA or recovery from HLSA. A , upper left panel , MMP-1, IL-1beta, and CRP levels in plasma had no significant change between the control group, HLSA group, and R-HLSA group. Upper right panel , CK-MB as a marker of heart injury in the plasma had no significant change between the control group, HLSA group, and R-HLSA group. Lower left panel , creatinine and BUN as markers of kidney injury in the plasma slightly increased in the HLSA group and returned to normal level after recovery from HLSA. Lower right panel , AST and ALT as markers of liver injury in the plasma showed no change between the control group, HLSA group, and R-HLSA group. Data were presented as mean +- SD (N = 6; ANOVA: ** p < 0.01). B , upper panel , food consumption and water consumption 3 days before and 3 days after a single ATP-induced HLSA depicted no change. Data were presented as mean +- SD (N = 6; ANOVA: p > 0.05). Lower panel , metabolomics analysis of scores plot from PCA analysis based on 1 H NMR data from the plasma, brain, liver, and kidney of the control group, HLSA group, and R-HLSA group. The PCA score showcased clusters correspond to metabolic patterns in different groups, with each point representing one sample. Circles represent 95% confidence interval for each score in each group (see also Figs. S5-S8 ). C , draining lymph nodes of mice that underwent HLSA once a day for 10 consecutive days were analyzed with FACS. CD44 and
- Submitted by
- Invitrogen Antibodies (provider)
- Main image
- Experimental details
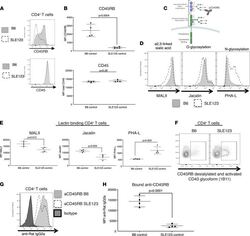
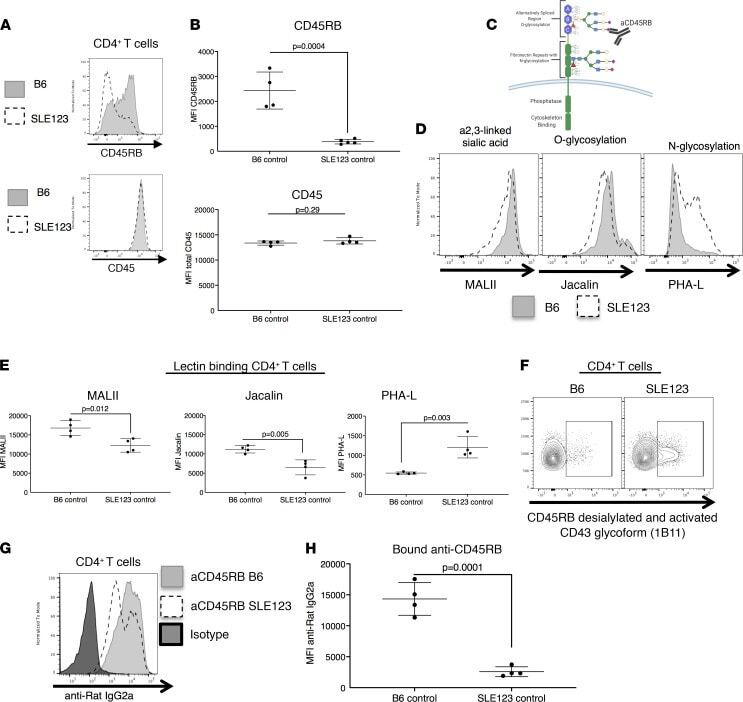
- Figure 5 CD4 surface expression of CD45RB and global glycosylation are altered in SLE123 mice. ( A and B ) Cell surface expression of CD45RB and total CD45 were measured by flow cytometry on CD4 + T cells. SLE123 demonstrated a downregulation of CD45RB on the cell surface as compared with B6 CD4 + T cells. There was no difference in pan-CD45 expression. Quantified in B . ( C ) CD45 is composed of an intracellular region that controls cytoskeletal binding and its phosphatase activity. The extracellular domain is composed of a region with fibronectin repeats that is heavily N-glycosylated. An alternatively spliced region is heavily O-glycosylated, and this region imparts unique functions to each CD45 isoform. Additionally, a sialic acid residue on the B portion of this region is essential for the binding of therapeutic aCD45RB. ( D and E ) We utilized lectins to detect the level of alpha-2,3-linked sialylation (MALII), O-linked glycosylation (Jacalin), and N-linked glycosylation (PHA-L) in CD4 + T cells from B6 and SLE123 mice. We determined SLE123 CD4 + T cells had reduced levels of alpha-2,3-linked sialic acids and O-glycosylation and an increase in N-glycosylation. Quantified in E . ( F ) Utilizing an antibody that detects a desialylated form of anti-CD45RB, we determined SLE123 CD4 + T cells possessed increased binding of this antibody compared with B6. ( G and H ) To determine the binding of therapeutic aCD45RB to B6 and SLE123 CD4 + T cells, we incubated splenocytes from
- Submitted by
- Invitrogen Antibodies (provider)
- Main image
- Experimental details
- Fig. 7 Upregulation of PD-L1 by MTHFD2 is required for tumorigenesis. a - b A total of 2 x 10 6 ( a ) or 5 x 10 6 ( b ) Pan02 cells stably infected with lentivirus carrying indicated shRNAs or exogenous expressed PD-L1, were subcutaneously injected into athymic nude mice ( a ) or C57 mice ( b ), tumor volume was calculated every 7 days. Tumor xenografts at the 28th day in nude mice ( a ) or the 21th day in C57 mice ( b ) were shown. Data represent the means +- s.e.m ( n = 8 mice per group); p value (Student's t test, two-sided) with control is presented. c , PD-L1 mRNA levels in tumor tissues in C57 mice were analyzed by real-time PCR. The values are presented as mean +- s.e.m ( n = 3); p values (Student's t test, two-sided) with control or the indicated groups are presented. d The lysates of 8 pooled tumor tissues in C57 mice were subjected to immunoblotting analyses using the indicated antibodies. e Immunohistochemical staining was performed on tumor sections in C57 mice with anti-CD8 antibody. Representative images are shown. Scale bars, 50 mum. Histological semi-quantification was performed. f Cells digested from indicate tumor tissues in C57 mice were stained with anti-CD45 antibody and subjected to flow cytometric analyses (also see Supplementary Fig. 7b ). Representative images (1 out of 3 experiments) are shown. g A schematic model showing the role of MTHFD2 in tumor immune evasion. MTHFD2 promotes PD-L1 mediated tumor immune evasion through the folate-cycle-UTP-UDP-G

- Submitted by
- Invitrogen Antibodies (provider)
- Main image
- Experimental details
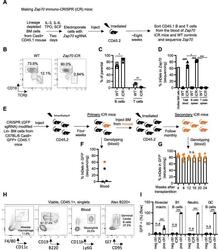
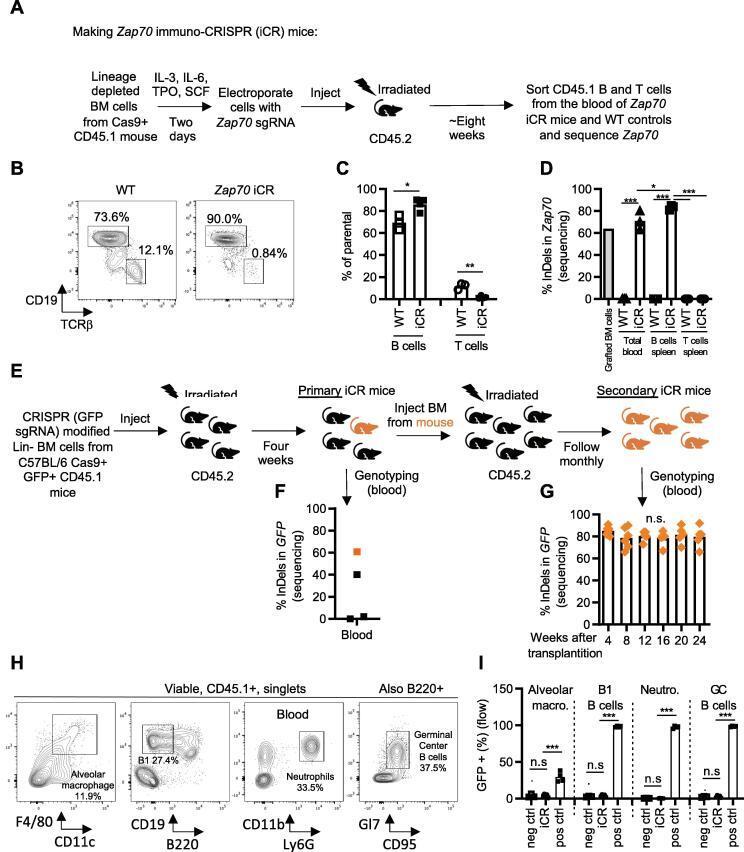
- Fig. 2 Generating immuno-CRISPR (iCR) mice and evaluating the CRISPR-mediated modifications by sequencing. ( A ) Model describing the experimental setup where CD45.1 + Lin- BM cells were modified by CRISPR targeting Zap70 and grafted into irradiated CD45.2 + recipients. ( B ) Flow cytometry analysis of cells in the blood of Zap70 iCR mice and WT control mice eight weeks post transplantation. Cells gated on viable, CD45.1+, single lymphocytes. ( C ) Quantification of B and T cells in the blood of WT and Zap70 iCR mice in (B). ( D ) Analysis of the level of mutations in the sgRNA targeted Zap70 region in the BM cells used for transplantation, total cells from the blood, as well as in B and T cells sorted from the spleen of Zap70 iCR mice and WT control mice 8 weeks after engraftment. ( E ) Model describing the experimental setup where a secondary transplantation was used to amplify the population of successfully modified mice. ( F ) Analysis of the level of mutations in the sgRNA targeted GFP region in blood cells of the GFP iCR mice four weeks after transplantation, in an experiment with low efficiency. One mouse showed good knockout efficiency (labeled in orange) and was used as BM donor for secondary transplantation. ( G ) Kinetics of the level of mutations of GFP in the secondary iCR mice. ( H ) As examples, representative flow cytometry plots and ( I ) GFP + cell population percentage of alveolar macrophages, B1 cells, neutrophils and germinal center B cells from secondary
- Submitted by
- Invitrogen Antibodies (provider)
- Main image
- Experimental details
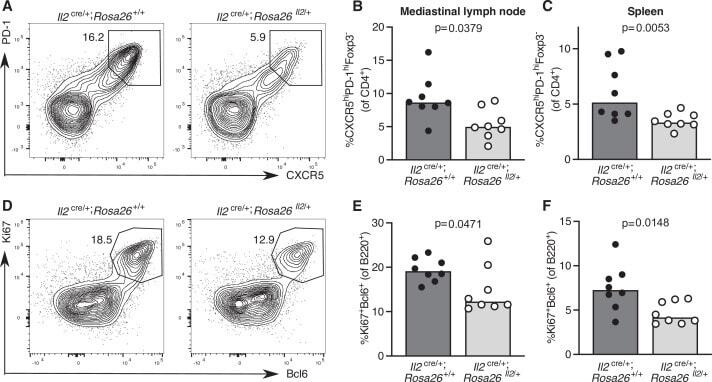
- Figure 8. Increased IL-2 production impairs T follicular helper (Tfh) cell formation and the germinal centre response. Assessment of the Tfh cell and germinal centre response in Il2 cre/+ ; Rosa26 stop-flox-Il2/+ transgenic mice that do not switch off IL-2 production, and Il2 cre/+ ; Rosa26 +/+ control mice 12 days after influenza A infection. Flow cytometric contour plots ( A ) and quantification of the percentage of CXCR5 high PD-1 high Foxp3 - CD4 + Tfh cells in the mediastinal lymph node ( B ) and spleen ( C ). Flow cytometric contour plots ( D ) and quantification of the percentage of Bcl6 + Ki67 + B220 + germinal centre B cells in the mediastinal lymph node ( E ) and spleen ( F ). The height of the bars indicates the median, each symbol represents one mouse, data are pooled from two independent experiments. p-Values calculated between genotype groups by Mann-Whitney U test.
- Submitted by
- Invitrogen Antibodies (provider)
- Main image

- Experimental details
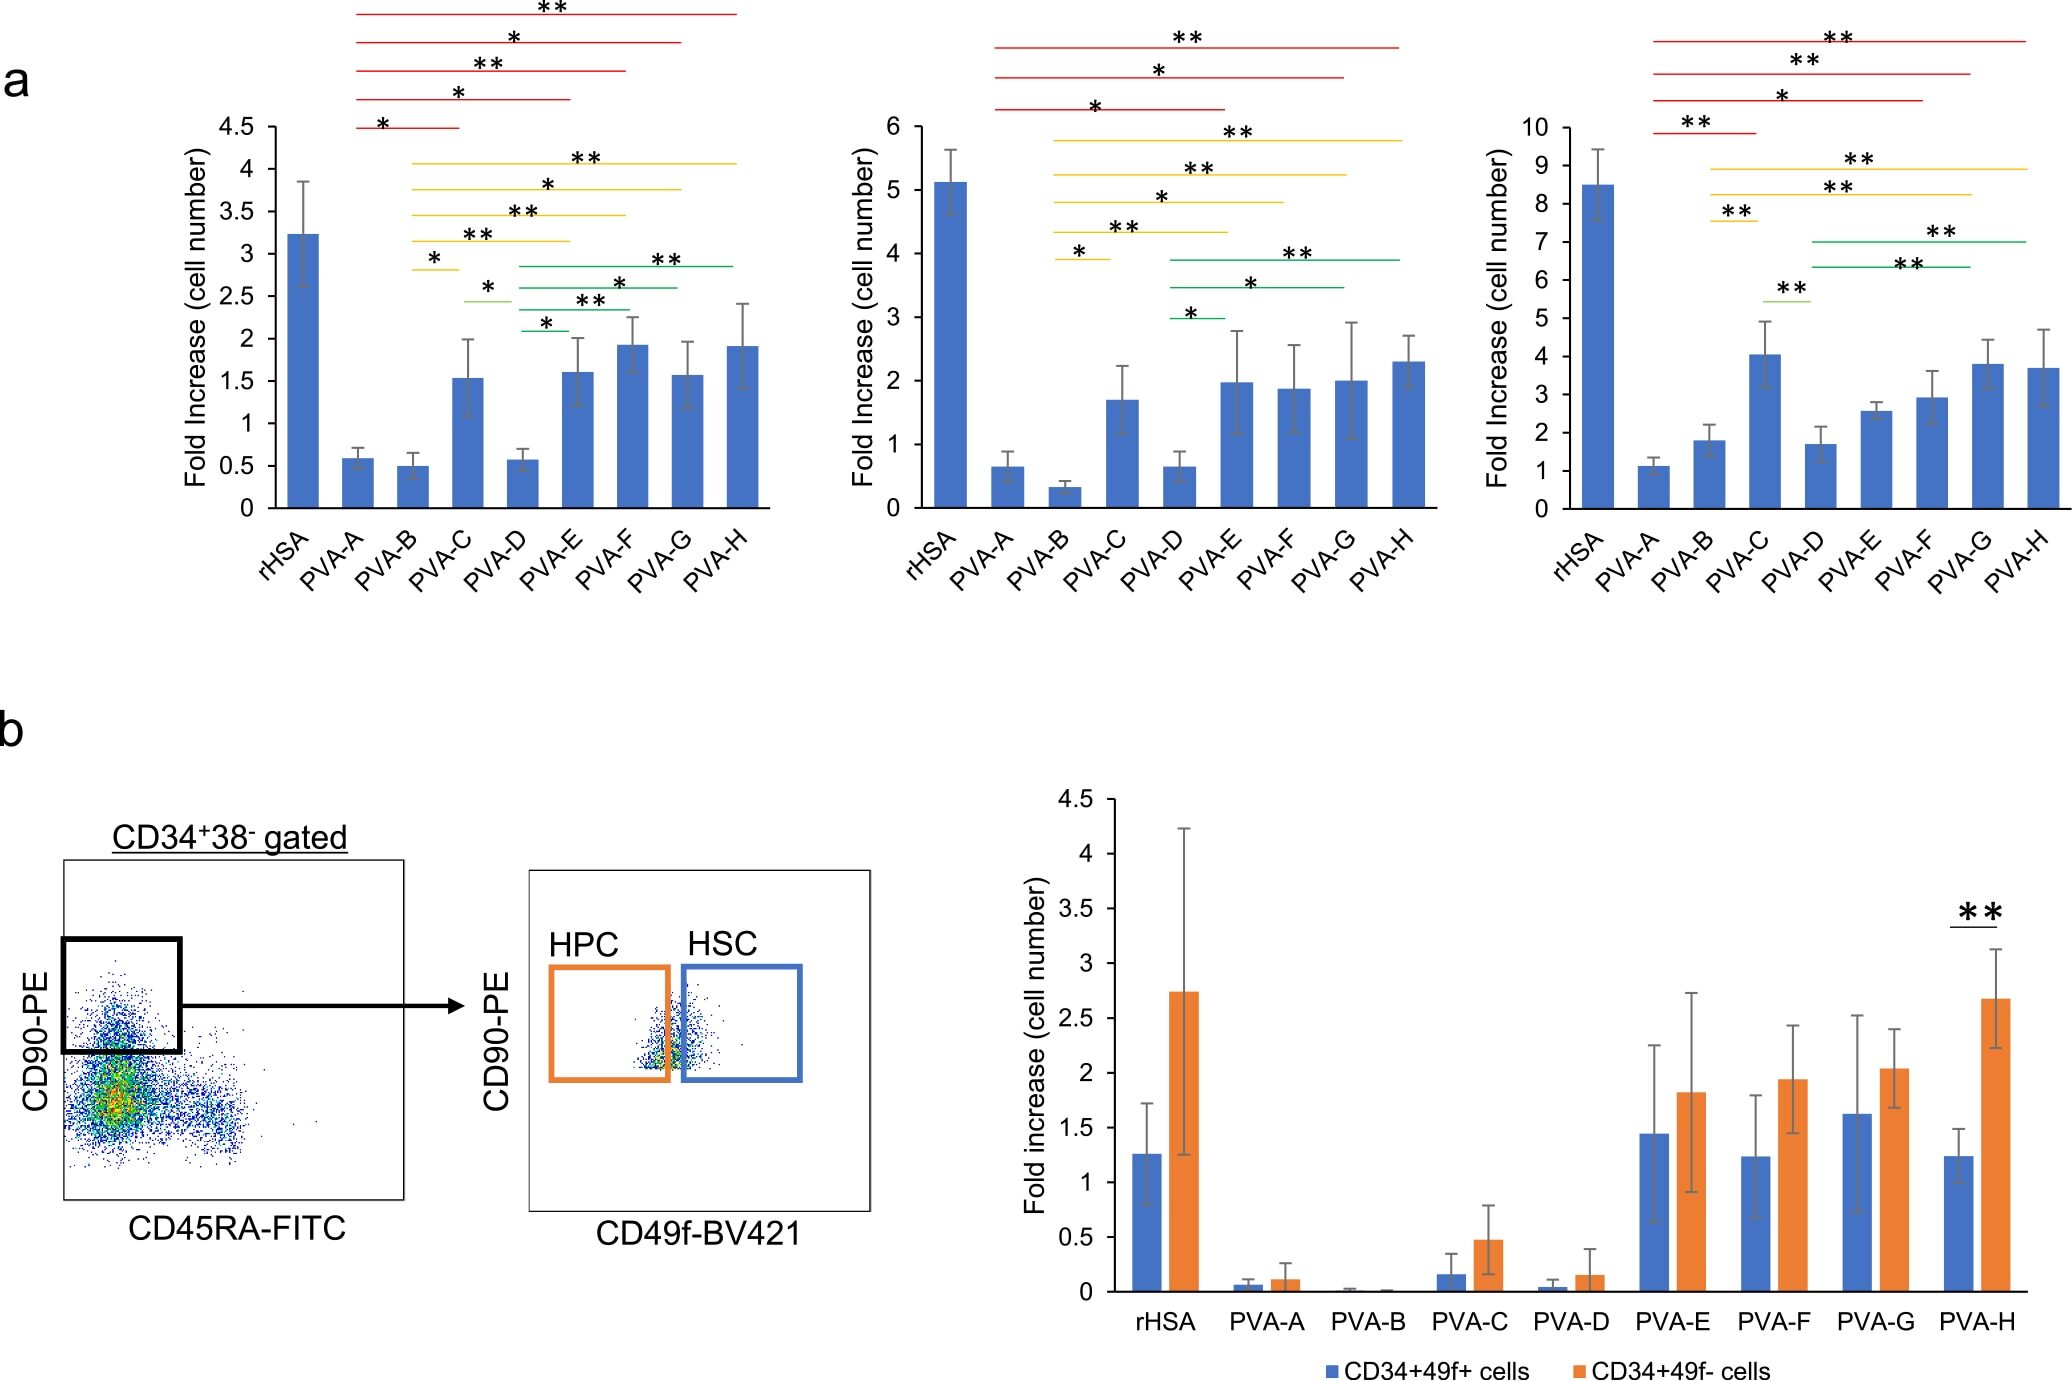
- Fig. 2. Effect of different PVA hydrolysis rates and molecular weights on ex vivo cultured human cord blood CD34 + hematopoietic stem and progenitor cells. a , Human cord blood CD34 + cells were cultured in PVA media and cell numbers were counted at day 14. Three independent experiments were performed with cord blood CD34 + cells derived from different donors. Cell cultures were started from 7 x 10 3 (Exp.1) or 5 x 10 3 (Exp. 2 and 3) CD34 + cells. Mean +- S.D is shown. Statistical significance was calculated using ANOVA followed by Tukey-Kramer; *p < 0.05, **p < 0.01. b , Proliferation of the two different CD34 + cell fractions after 7-day culture in PVA-containing media. Fifty cells were sorted into four wells in a 96-well plate and cell numbers in each well were counted at 7-day. Statistical significance was calculated using ANOVA and Tukey-Kramer. **p < 0.01.
- Submitted by
- Invitrogen Antibodies (provider)
- Main image
- Experimental details
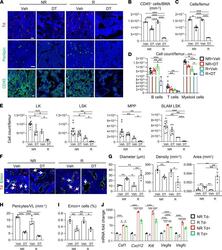
- Figure 6 MALP ablation blocks bone marrow recovery after radiation. ( A ) Representative fluorescence images of Td + cells, Perilipin + LiLAs, and CD45 + hematopoietic cells in femoral bone marrow of Adipoq/Td/DTR mice after receiving 2 weeks of vehicle (Veh) or DT injections with or without prior radiation. Scale bar: 20 mum (top), 100 mum (middle), and 20 mum (bottom). ( B ) Quantification of CD45 + cells per bone marrow area. n = 3-6 mice/group. ( C ) Bone marrow cells were flushed from femurs and counted. n = 3-8 mice/group. ( D ) Cell counts of hematopoietic lineage cells in the bone marrow. n = 3-11 mice/group. B cells = B220 + , T cells = CD3 + , myeloid cells = Gr1 + and/or Mac1 + . ( E ) Cell counts of HSPCs. n = 3-11 mice/group. LK, Lineage - cKit + , LSK, Lineage - Sca1 + cKit + , SLAM LSK, Lineage - Sca1 + cKit + CD48 - CD150 + , MPP, Lineage - Sca1 + cKit + CD48 + CD150 - . ( F ) Representative fluorescence images of Adipoq/Td/DTR femoral bone marrow with Emcn staining (vessels). Arrows point to Td + pericytes. Scale bar: 20 mum. ( G ) Quantification of bone marrow vessel diameter, density, and area. ( H ) The number of pericytes per vessel length (VL) was measured. n = 3-4 mice/group. ( I ) The percentage of Emcn + endothelial cells in bone marrow was measured by flow cytometry. n = 3-4 mice/group. ( J ) qRT-PCR analysis of hematopoietic and angiogenic factors in sorted Td - and Td + cells from bone marrow before and after radiation. n = 4 mice/group. Statistica

- Submitted by
- Invitrogen Antibodies (provider)
- Main image
- Experimental details
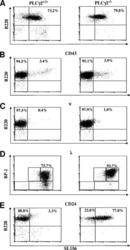
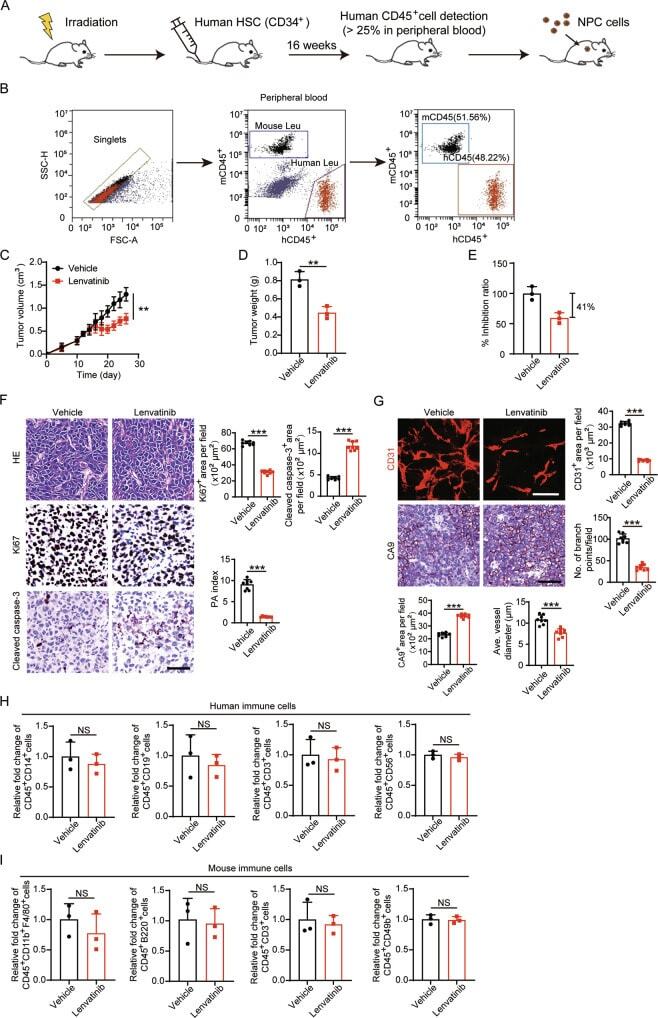
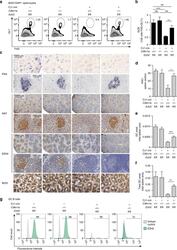
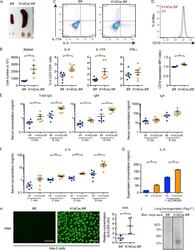
- Lenvatinib insignificantly affects the immune microenvironment in NPC in humanized NSG mice. A Schematic diagram of the establishment of humanized NSG mice. B Representative FACS analysis of human CD45 + cells in mouse peripheral blood. Human CD45 + cell percentage greater than 25% was considered successful in modeling. C - E Tumor growth ( C ), tumor weights ( D ) were measured in vehicle-, anti-VEGF-, and lenvatinib-treated NPC tumors. The tumor inhibition ratio were calculated ( E ) ( n = 3 samples per group). F Representative micrographs of Ki67 + proliferative cells and cleaved caspase-3 + apoptotic cells in vehicle-, anti-VEGF-, and lenvatinib-treated NPC tumors. Scale bar = 50 mum. Quantification of Ki67 + , cleaved caspase-3 + signals, and PA index in vehicle-, anti-VEGF-, and lenvatinib-treated NPC tumors. ( n = 8 random fields per group) G Representative micrographs of CD31 + microvessels and CA9 + hypoxic areas in vehicle-, anti-VEGF-, and lenvatinib-treated NPC tumors. Scale bar in upper panel = 100 mum, scale bar in lower panel = 50 mum. Quantification of CD31 + tumor vessel parameters and CA9 + signals in vehicle-, anti-VEGF-, and lenvatinib-treated NPC tumors ( n = 8 random fields per group). H Quantification of hCD45 + hCD14 + population, hCD45 + hCD19 + population, hCD45 + hCD3 + population, and hCD45 + hCD56 + population in the NPC TME ( n = 3 samples per group). I Quantification of mCD45 + mCD11b + mF4/80 + population, mCD45 + mB220 + population, mCD45 + mC
- Submitted by
- Invitrogen Antibodies (provider)
- Main image

- Experimental details
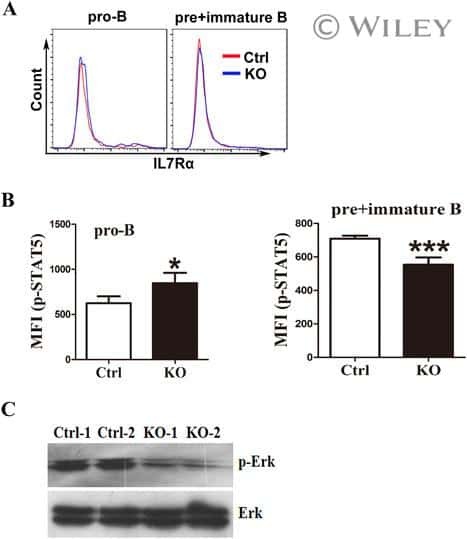
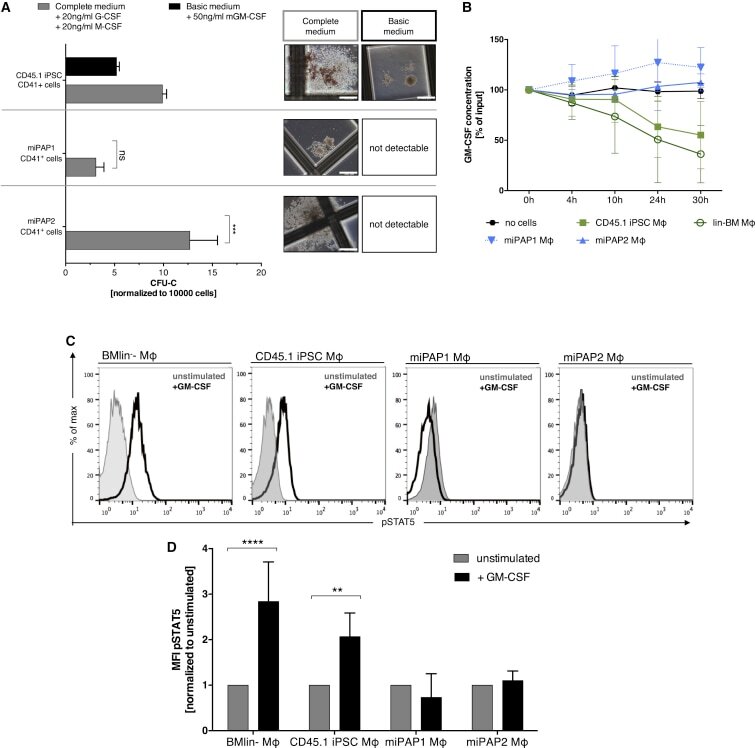
- Figure 6 Disease Modeling of herPAP Using miPAP iPSCs (A) Number of CD41 + progenitor-derived colonies in methylcellulose-based clonogenic assays employing complete (IL-6, erythropoietin, SCF, IL-3, and supplemented with 20 ng/ml human G-CSF + 20 ng/ml murine GM-CSF) or basic medium (50 ng/ml murine GM-CSF only; independent experiments, n = 3 miPAP1 and 2, n = 2 CD45.1 iPSC, mean +- SD) and representative pictures of colonies. Scale bars, 500 mum. (B) GM-CSF clearance assay comparing miPAP-Mphi with CD45.1(10.3) iPSC-Mphi, BMlin - -Mphi, and no cells incubated with 2 ng/ml GM-CSF: at indicated time points (0, 4, 10, 24, and 30 hr) GM-CSF concentrations in supernatants were analyzed by ELISA, normalized to 0 hr (independent experiments, n = 3 BMlin - and CD45.1 iPSC, n = 2 miPAP1 and 2, mean +- SD). (C and D) Flow cytometry plots of STAT5 phosphorylation levels upon stimulation with mGM-CSF (C) and (D) summary of mean fluorescence intensity (MFI) data (independent experiments, n = 3 BMlin - and CD45.1 iPSC, n = 2 miPAP1 and 2, mean +- SD). ns, not significant; ** p
- Submitted by
- Invitrogen Antibodies (provider)
- Main image

- Experimental details
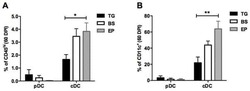
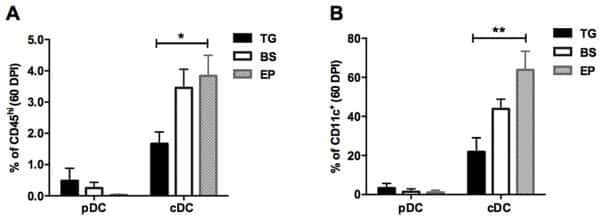
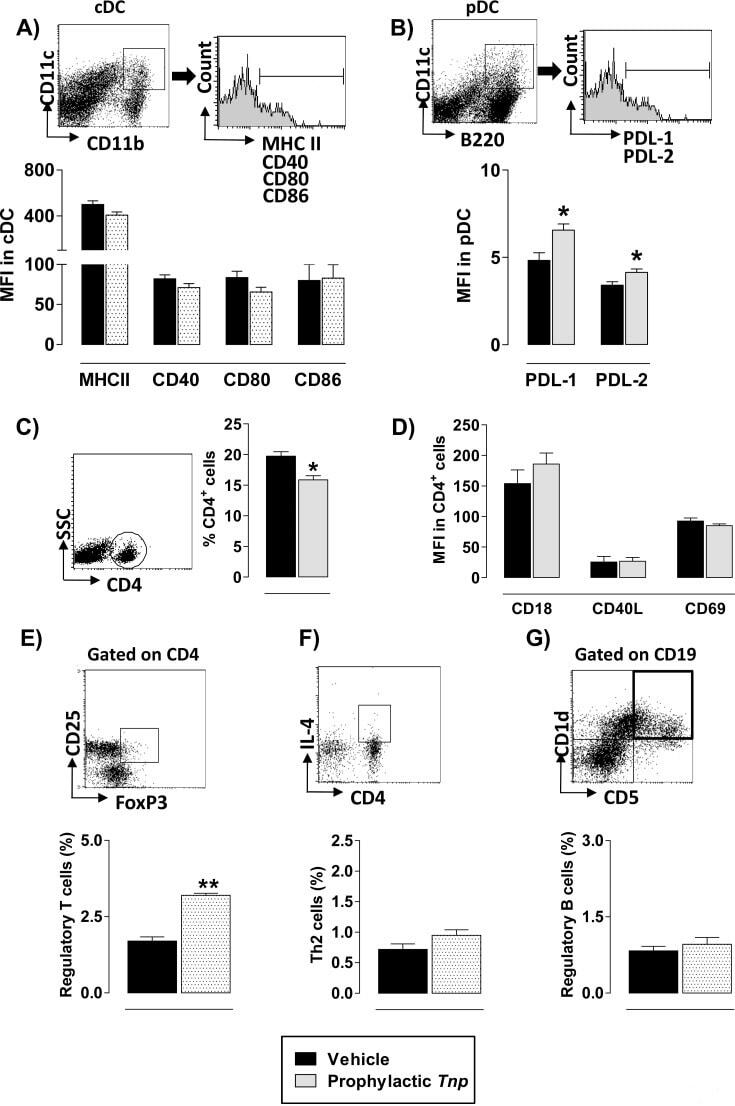
- Fig 6 Tn P acts systemically during the induction phase modulating DCs and induces regulatory cells. Splenocytes from EAE mice treated with vehicle or Tn P (n = 5/group) were isolated at day 7, and analyzed. A ) The MFI of MHC class II, CD40, CD80, CD86 in cDC (CD11c+CD11b+) and B ) MFI of PDL-1 and PDL-2 in pDC (CD11c+B220 low ) were analyzed by flow cytometry (50,000 events). C ) The percentage of CD4+ cells, D ) and the MFI of CD18, CD40L, and CD69 in the CD4+ gate were analyzed by flow cytometry. E , F , G ) The percentages of FOXP3-positive CD4+CD25+ Treg, IL-4-positive CD4 Th2 cells and CD5-positive CD19+CD1d+ Breg cells were analyzed by flow cytometry. Values in the bar graphs are the mean +- SEM. * p < 0.05 and ** p < 0.01 compared with vehicle-treated EAE-mice.
- Submitted by
- Invitrogen Antibodies (provider)
- Main image
- Experimental details
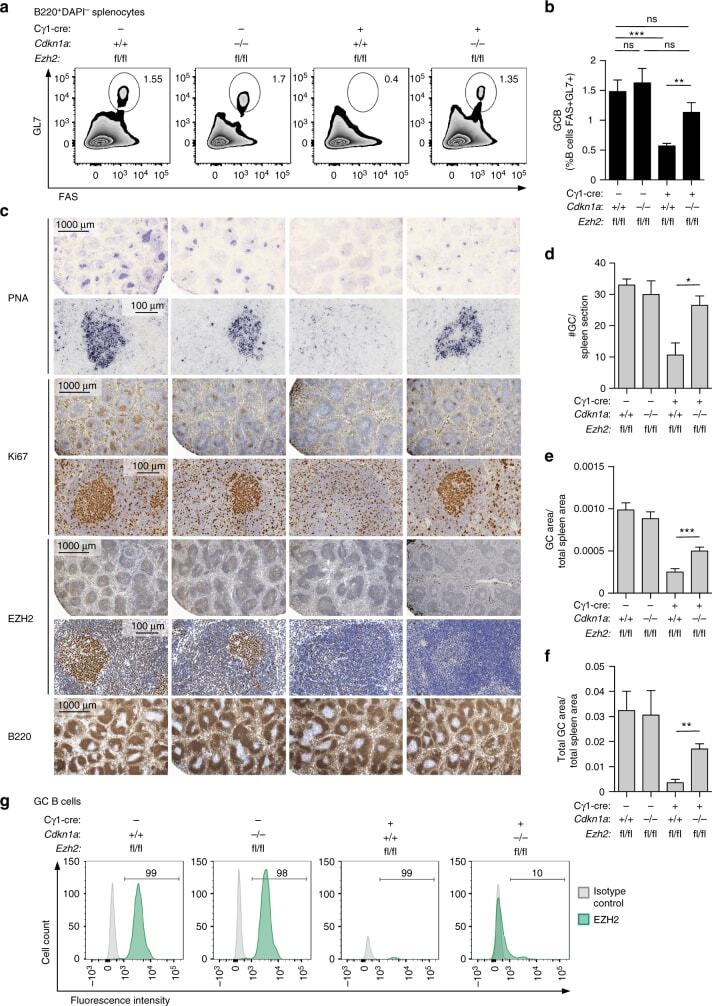
- Fig. 1 In vivo depletion of Cdkn1a rescues GC formation in Ezh2 -/- mice. Ezh2 fl/fl , Cdkn1a -/- , Ezh2 fl/fl ;Cgamma1-cre and Ezh2 fl/fl ;Cgamma1-cre; Cdkn1a -/- littermate mice were immunized with SRBC to induce germinal center (GC) formation and were killed 10 days later. a Flow cytometry plot of one representative mouse spleen per group. The gated area shows the percentage of GC B cells (GL7 + FAS + ) within live B cells (B220 + DAPI-, see Supplementary Fig. 2A for gating strategy). b Average of GC B populations of each group of mice quantified by flow cytometry as in a ( n = 7 mice per group). c Formalin fixed paraffin embedded splenic tissue was stained for PNA, Ki67, EZH2, and B220. One representative picture of three spleens analyzed per group is shown. d - f Quantification of PNA staining from c ( n = 3 spleens per group). d ""#GC/spleen section"" is the count of all GC per spleen section. e ""GC area/total spleen area"" is the quantified area of each individual GC divided by the total area of the spleen section. f ""Total GC area/total spleen area"" is the sum of all GC quantified areas in a certain section divided by the total area of that spleen section. g Splenocytes were permeabilized and stained for GC B and EZH2 using a fluorochrome-conjugated anti EZH2 antibody. The gated area shows the percentage of GC B cells (GL7 + FAS + ) within live B cells (B220 + DAPI-, see Supplementary Fig. 2A for gating strategy) that are EZH2 positive. The flow plot shown is repre
- Submitted by
- Invitrogen Antibodies (provider)
- Main image
- Experimental details
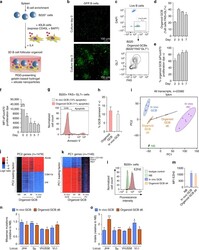
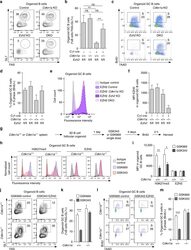
- Fig. 3 Characterization of a 3D B cell follicular organoid to model the GC reaction. a Scheme of 3D B cell follicular organoid fabrication. Splenic B cells are co-encapsulated with 40LB stromal cells and IL4 into an RGD-presenting nanocomposite hydrogel that contain gelatin ionically cross-linked with synthetic silicate nanoparticles. b Representative fluorescence pictures of splenic GFP B cells in 3D organoid culture. c Flow cytometry plot of a 3D B cell follicular organoid. The gated area on the top shows the live B cells (B220 + DAPI-) and on the bottom plot, the organoid GC B cells (GL7 + FAS + ) within live B cells. d Average of GC B populations of organoids quantified as in c . e Average of percentage of proliferating organoid GC B populations, quantified as indicated in Supplementary Fig. 4B . f MFI of proliferation dye from e . g Flow cytometry plot of GC B cells stained with annexinV. h Average of percentage of apoptotic GC B cells quantified as in g . i RNA-seq profiles of organoid GC B cells after 4 and 6 days in culture (organoid GCB d4, n = 4 spleens, and d6, n = 3 spleens) were projected into the principal component space defined by GC B cells sorted from immunized mice (in vivo GCB, n = 6 mice), CD138 + plasma cells (in vivo PC, n = 6 mice) and FAS-GL7-IgD + B220 + naive B cells (NB, n = 3 mice). j , k Heat maps of gene expression level of GC B cells showed in i , represented as log2 ratio relative to mean naive B cells j and to mean plasma cells k . PC1/2 = pr

- Submitted by
- Invitrogen Antibodies (provider)
- Main image
- Experimental details
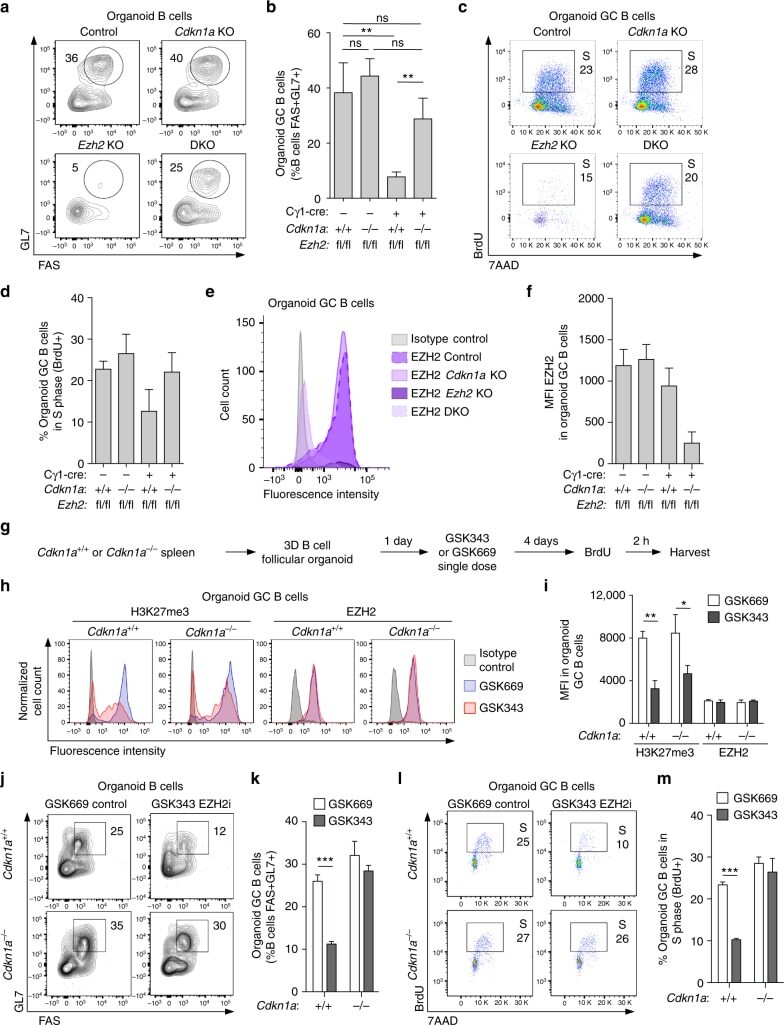
- Fig. 4 CDKN1A repression by EZH2 is required for GC B cell cycle progression. a - f Organoids were generated using B cells isolated from Ezh2 fl/fl ;Cgamma1-cre, Cdkn1a -/- , Ezh2 fl/fl ;Cgamma1-cre; Cdkn1a -/- and Ezh2 fl/fl control mice ( n = 3 mice per group) and were harvested for flow cytometry analysis after 4 days in culture. a Flow cytometry plots of representative organoids from each genotype. The gated area shows the percentage of organoid GC B cells (GL7 + FAS + ) within live B cells (B220 + DAPI-). b Average of percentage of organoid GC B populations quantified by flow cytometry as in a ( n = 3 biological replicates per group). c Organoids received a BrdU pulse of 2 h before harvest. Cell cycle was analyzed by BrdU staining and 7AAD to measure DNA content. The representative gated area shows the percentage of organoid GC B cells (GL7 + FAS + B220 + DAPI-) that are in S phase (BrdU + ). d Average of percentage of organoid GC B populations in S phase of each group of genotype quantified by flow cytometry as in c ( n = 3 biological replicates per group). e Organoid cells were permeabilized and stained for EZH2 and GC markers GL7, FAS, and B220 to identify organoid GC B cells. The flow cytometry plot shows one representative sample per genotype group. f MFI of EZH2 in organoid GC B cells ( n = 3) quantified by flow cytometry as in e . g - m Organoids were generated using B cells isolated from 3 Cdkn1a +/+ and 3 Cdkn1a -/- mice. g Scheme of EZH2 inhibitor GSK343 and Br
- Submitted by
- Invitrogen Antibodies (provider)
- Main image
- Experimental details
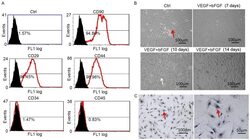
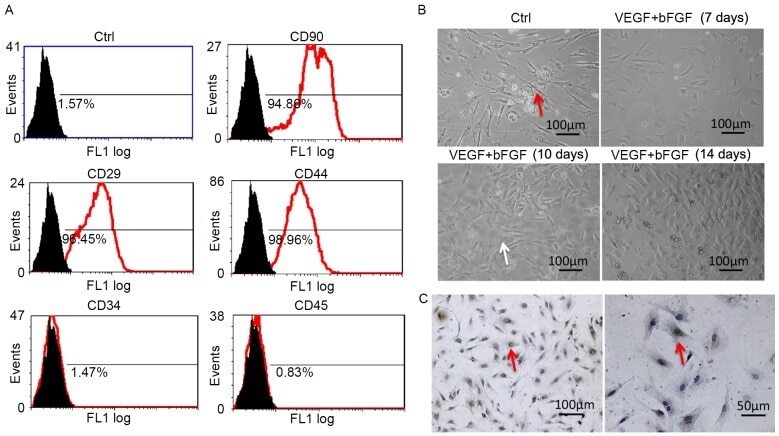
- Figure 1. VEGF and bFGF promote the differentiation of MSCs into EC-like cells. (A) Expression of MSC surface markers was confirmed using flow cytometry. (B) Morphological features of isolated MSCs and MSC-derived EC-like cells following induction as observed under an inverted microscope. The red and white arrows indicate spindle-shaped and polygon-shaped cells, respectively. Magnification, x20. (C) Factor VIII expression was detected in MSC-derived EC-like cells via immunohistochemistry and light microscopy with brown staining indicating the positive signal. VEGF, vascular endothelial growth factor; bFGF, basic fibroblast growth factor; MSCs, mesenchymal stem cells; EC, endothelial cell; Ctrl, control; CD, cluster of differentiation.
- Submitted by
- Invitrogen Antibodies (provider)
- Main image
- Experimental details
- Fig. 1 Loss of miR-143/145 results in reduced LT-HSC frequency. a Frequency of long-term-HSC (LT-HSC, CD45 + EPCR + CD48 - CD150 + ), LSK/short-term HSC (Lin - Sca1 + c-Kit + ), common myeloid progenitors (CMP, Lin - Sca1 - c-Kit + CD34 + CD16/32 lo ), granulocyte-macrophage progenitors (GMP, Lin - Sca1 - c-Kit + CD34 + CD16/32 hi ), and megakaryocyte-erythrocyte progenitors (MEPs, Lin - Sca1 - c-Kit + CD34 - CD16/32 lo ) in the marrow of 8-12-week- old wild-type (WT), miR-143/145 +/- , and miR-143/145 -/- mice, as analyzed by flow cytometry (median +- 1.5 IQR, WT n = 11, 143/145 +/- n = 9, 143/145 -/- n = 8). b Marrow cellularity (2 femurs and 2 tibias) (WT n = 3, 143/145 +/- n = 4, 143/145 -/- n = 8). c Colony-forming unit (CFU) assay of marrow cells from WT and miR-143/145 -/- mice (mean +- SEM, WT n = 11, 143/145 -/- n = 10). d Primary CFU cells were replated in equal proportions per condition, normalized to the number of input cells, to generate secondary CFUs (mean +- SEM, WT n = 9, 143/145 -/- n = 7). e Estimate of HSC frequency in WT and miR-143/145 -/- mice by limiting dilution assay. Shown is a log-fraction plot of the limiting dilution model. The slope of the line is the log-active cell fraction. The dotted lines give the 95% CI

- Submitted by
- Invitrogen Antibodies (provider)
- Main image
- Experimental details
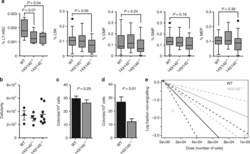
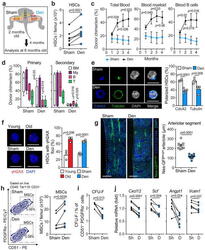
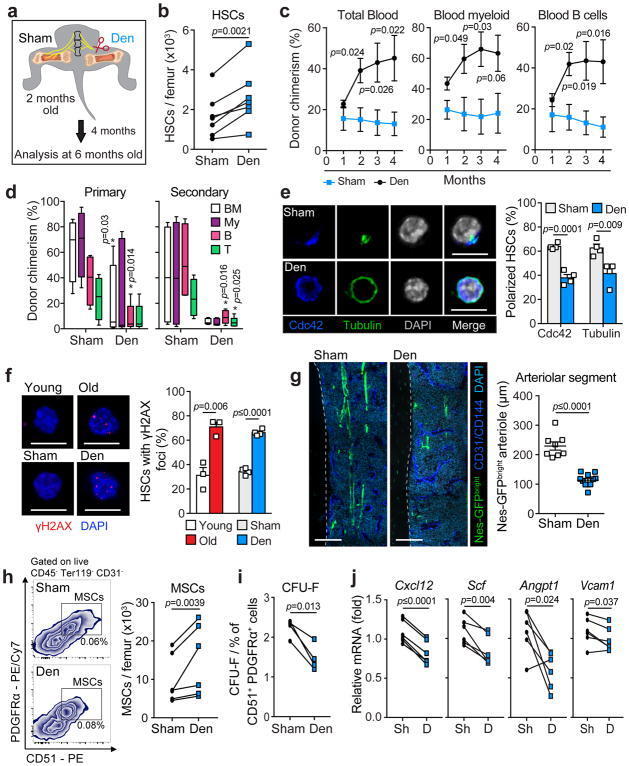
- Figure 4 Surgical denervation of young bone marrow induces premature HSC and niche aging (a) Schematic illustration of surgical denervation experiment. The sciatic and femoral nerves were transected in young (2 months old) C57BL/6 mice and the mice were analyzed 4 months post surgery, at 6 months of age. (b) Absolute numbers of HSCs (lineage - Sca-1 + c-Kit + CD48 - CD150 + ) isolated from Sham and Denervated (Den) femurs (n=7 mice). (c, d) Total peripheral blood (CD45.2 + ), blood myeloid (Mac-1 + CD45.2 + ) and blood B cell (B220 + CD45.2 + ) donor chimerism at the indicated time points post transplantation (c) and bone marrow donor chimerism (Total CD45.2 + (BM); Myeloid (My), Mac-1 + CD45.2 + ; B cell (B), B220 + CD45.2 +; and T cell (T), CD4 + /CD8 + CD45.2 + ) 5 months after primary transplantation of 200 HSCs derived from either sham or denervated (Den) femurs and transplanted in competition with young BM competitor cells (n=4 sham, 6 denervated mice) (left) and 5 months after secondary transplantation of 3 x 10 6 bone marrow from primary recipients (right) (d). (e) Left, representative confocal z -stack projections of HSCs sorted from sham or denervated femurs and stained with Cdc42, Tubulin and DAPI. Scale bar, 10 mum. Right, quantification of the percentage of Cdc42 and Tubulin polarized HSCs out of total HSCs scored (total of 356 sham and 353 denervated HSCs isolated from 4 mice per group). (f) Left, representative confocal z -stack pro
- Submitted by
- Invitrogen Antibodies (provider)
- Main image
- Experimental details
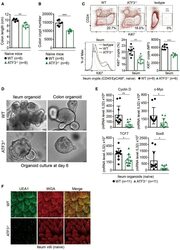
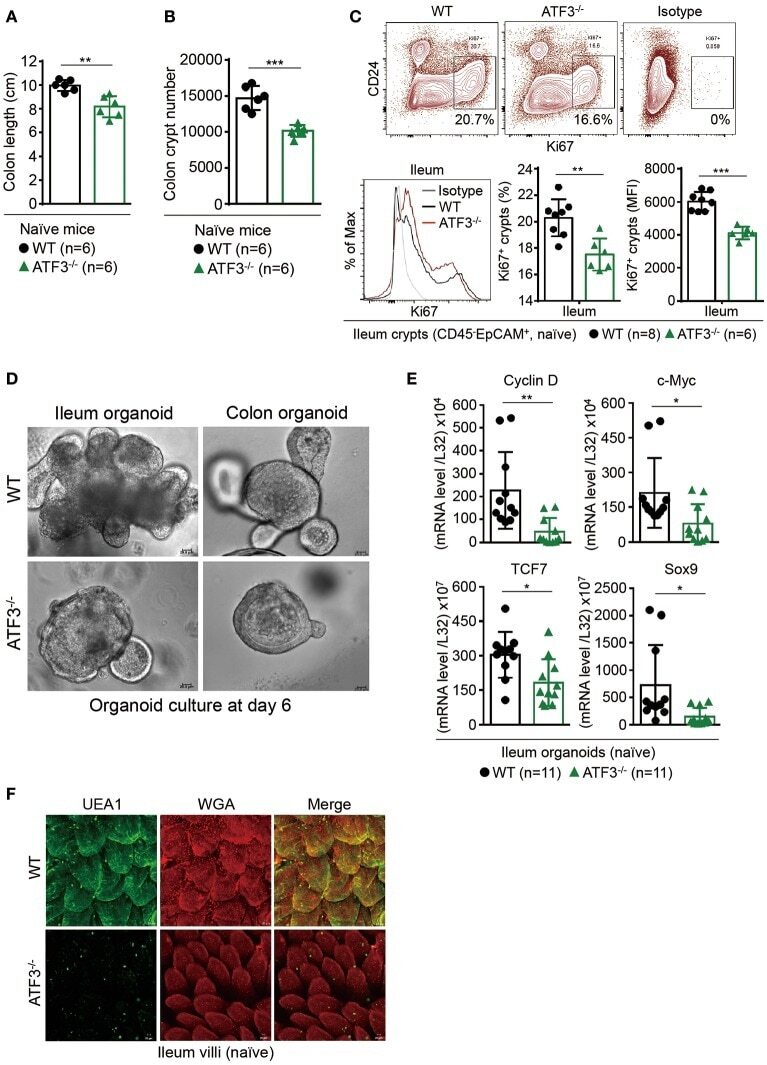
- Figure 1 ATF3 maintains intestinal homeostasis. (A) Comparison of colon length between naive mice as indicated. (B) Colon crypts from mice were isolated by shaking colon fragments in EDTA and counted under light microscopy. (C) Flow cytometry analysis of Ki67 and CD24 expression in ileum crypts, gated on the CD45 - EpCAM + populations, from the indicated naive mice. (D) Representative micrographs showing intestinal organoids derived from naive mice. (E) Quantitative real-time PCR analysis of cell cycle genes in naive ileum organoids at day 6 of culture (""n"" indicates organoids derived from 4 mice each group). (F) Representative confocal images of whole mount tissues with co-immunofluorescence staining of UEA-1 and WGA in naive ileum villi. Results were from at least two independent experiments and ""n"" refers to the number of mice unless indicated otherwise. All mice were at the age of 2~3 months old when analyzed. Statistical analysis was done using Multiple T -test on Prism software. * P < 0.05, ** P < 0.005, *** P < 0.0005.
- Submitted by
- Invitrogen Antibodies (provider)
- Main image
- Experimental details
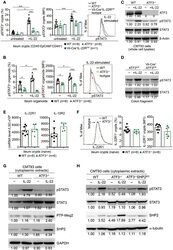
- Figure 7 ATF3 promotes IL-22-induced STAT3 phosphorylation by suppressing phosphatases. (A) Freshly isolated ileum crypts, or (B) ileum organoids at day 6 of culture, were stimulated with IL-22, followed by fixation and intracellular staining of phospho-STAT3, and analyzed by flow cytometry. Western blot analysis of (C) IL-22-stimulated CMT93 cells, or (D) IL-22-stimuated colon fragments isolated from the indicated mice, for the expression of the indicated proteins. (E) Quantitative real-time PCR analysis of IL-22R1 and IL-10R2 mRNA levels in freshly isolated ileum crypts from mice. (F) Flow cytometry analysis of IL-22R1 in freshly isolated ileum crypt cells gated on the CD45 - EpCAM + population. (G,H) Western blot analysis of unstimulated or IL-22-stimulated CMT93 cells for the indicated proteins. ATF3 -/- CMT93 cells with SHP2 knockdown (ATF3 -/- SHP2 KD ) were indicated. Images were representative of four independent experiments (G-H) . Results were from two independent experiments (A-F) . ""n"" refers to the number of mice analyzed (A,B,E,F) . Statistical analysis was done by multiple comparison in Two-way ANOVA test using Prism software. * P < 0.05, ** P < 0.005, *** P < 0.0005.
- Submitted by
- Invitrogen Antibodies (provider)
- Main image
- Experimental details
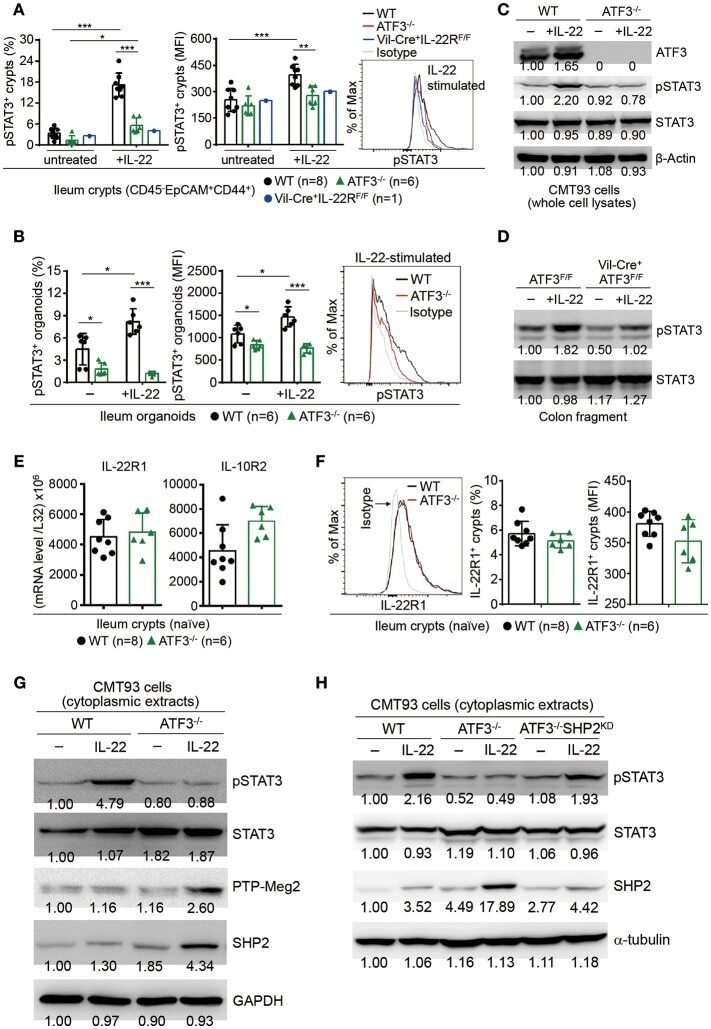
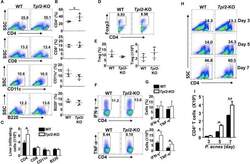
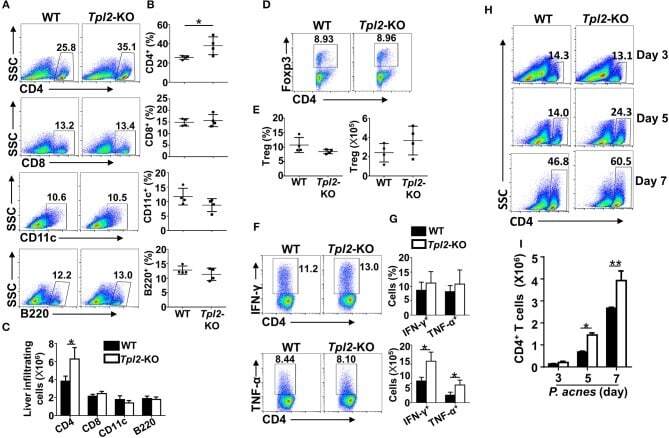
- Figure 2 Tpl2 didn't affect peripheral immune activation during FH pathogenesis. The splenic cells or peripheral blood immune cells were isolated from P. acnes -primed WT and Tpl2 -KO mice at day 3, 5, and 7 as described in Materials and methods ( n = 4 mice/group), and subjected for flow cytometry analysis. (A-F) Flow cytometry analysis of the frequencies and absolute numbers of CD4 + T cells, CD8 + T cells, B220 + B cells, CD11c + dendritic cells (A,B) , CD4 + Foxp3 + Treg cells (C,D) , and IFN-gamma- and TNF-alpha-producing pathogenic Th1 cells (E,F) in the spleens of WT and Tpl2 -KO mice at day 7 after P. acnes priming. Data are presented as representative plots of the frequencies of immune cell subpopulations (A,C,E) and a summary graph of the cell frequencies or absolute cell numbers (B,D,F) . (G-J) Flow cytometry analysis of the frequencies and absolute numbers of CD4 + T cells in the spleens (G,H) or peripheral blood (I,J) of WT and Tpl2 -KO mice at day 3, 5, and 7 after P. acnes priming. Data are presented as representative plots of the frequencies of immune cell subpopulations (G,I) and a summary graph of the cell frequencies or absolute cell numbers (H,J) . Results are mean +- SD from three independent experiments.

- Submitted by
- Invitrogen Antibodies (provider)
- Main image
- Experimental details
- Figure 3 Tpl2 reduced liver infiltration of pathogenic CD4 + T cells. Liver-infiltrating immune cells were isolated from P. acnes -primed WT and Tpl2 -KO mice at day 3, 5, and 7 as described in Materials and methods ( n = 4 mice/group). (A-G) Flow cytometry analysis of the frequencies and absolute numbers of CD4 + and CD8 + T cells, B220 + B cell, CD11c + dendritic cells (A-C) , CD4 + Foxp3 + Treg cells (D,E) , and IFN-gamma- and TNF-alpha-producing pathogenic Th1 cells (F,G) in the livers of WT and Tpl2 -KO mice at day 7 after P. acnes priming. Data are presented as representative plots of the frequencies of immune cell subpopulations (A,D,F) and a summary graph of the frequencies and absolute cell numbers (B,C,E,G) . (H,I) Flow cytometry analysis of the frequencies and absolute numbers of CD4 + T cells in the livers of WT and Tpl2 -KO mice at day 3, 5, and 7 after P. acnes priming. Data are presented as representative plots of the frequencies of immune cell subpopulations (H) and a summary graph of the absolute cell numbers (I) . Results are mean +- SD from three independent experiments. Two-tailed Student's t -tests were performed. * P < 0.05; ** P < 0.01.
- Submitted by
- Invitrogen Antibodies (provider)
- Main image
- Experimental details
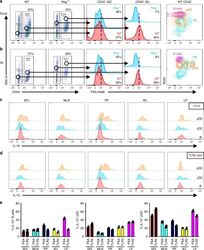
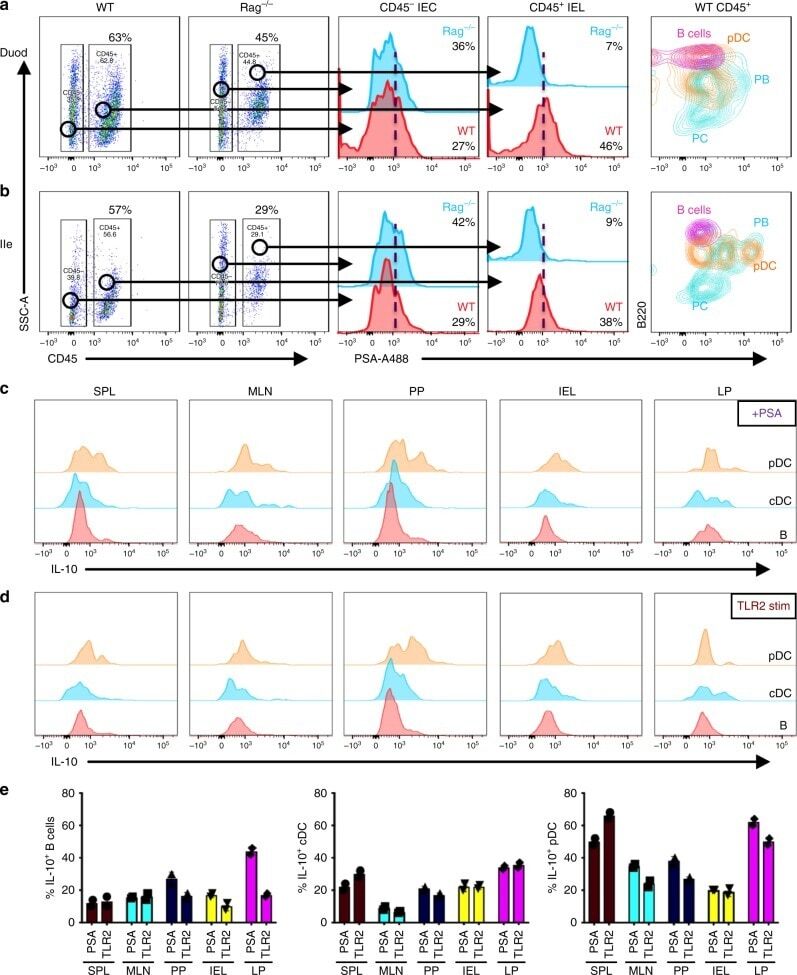
- Fig. 6 TLR2 + macrophages, pDCs, and PB in the small intestine bind PSA and induce IL-10 secretion. Gating strategy for mononuclear cells isolated from a duodenum (Duod) and b ileum (Ile) of WT and Rag mice analyzed for binding of fluorescent A488-conjugated PSA (left two plots). CD45 - intra-epithelial cells (CD45 - IEC: middle histogram) and CD45 + gated intra-epithelial leukocytes (CD45 + IEL: second right histogram) isolated from the a Duod and b Ile of WT (red) and Rag (blue) mice were analyzed for reactivity to PSA-A488. CD45 + CD11c - B220 + B cells, PDCA1 + B220 + CD11c + pDCs and CD138 + B220 + PB and B220 low PC isolated from a Duod and b Ile of WT mice were analyzed for PSA reactivity (right histogram). Flow cytometry plots show CD11c + PDCA1 - cDC, PDCA1 + B220 + pDC, and B220 + CD19 + B cells isolated from spleen, MLN, PP, IEL, or LP of WT mice were stimulated with c PSA or d LTA-SA (TLR2 agonist) and analyzed for IL-10 expression. e Plots summarize data from c and d and show % IL-10 + B cells (left), cDCs (middle), and pDCs (right) from spleen, MLN, PP, IEL, and LP stimulated with PSA or TLR2 (LTA-SA) ( n = 3 mice). All data show mean +- SEM
- Submitted by
- Invitrogen Antibodies (provider)
- Main image
- Experimental details
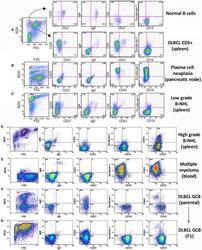
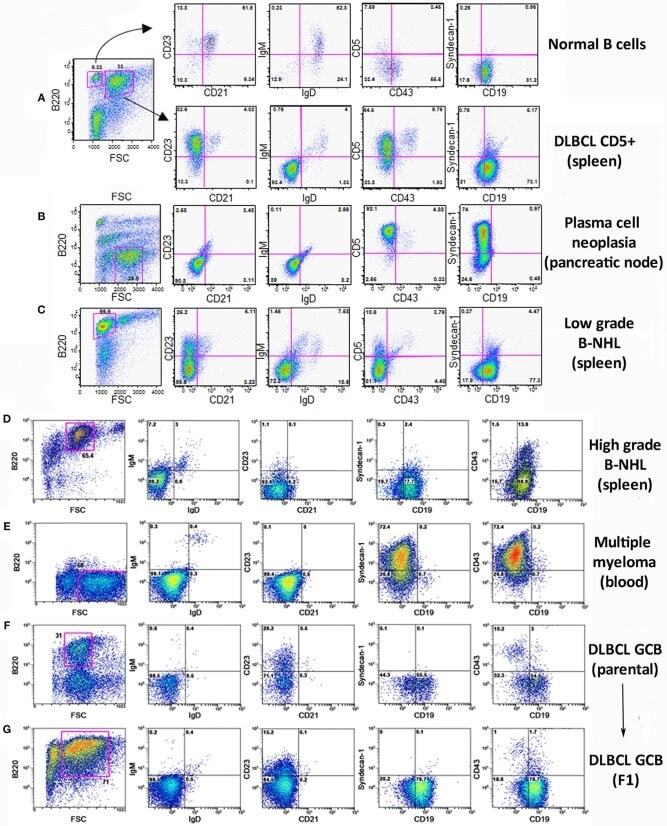
- Figure 2 Analysis of the B lymphocyte populations expanded in TRAF3/BCL2 double-tg mice with lymphoid dyscrasias. Three-color flow-cytometry analysis was performed to determine the phenotype of expanded B lymphocyte populations. Gating of the expanded population was based on the CD45R/B220 and FSC plot of each sample analyzed and is indicated in the figure. The surface molecules analyzed are indicated in the plots, as well as the percentage of cells found in each quadrant. The quadrants settings were selected based on the staining of isotype-controls (not shown). The tissue source where the analyzed lymphocytes were extracted from and the type of B cell malignancy developed by the TRAF3/BCL2 double-tg mice, according to the flow-cytometry and immunohistochemical analysis, is indicated in the figure.
- Submitted by
- Invitrogen Antibodies (provider)
- Main image
- Experimental details
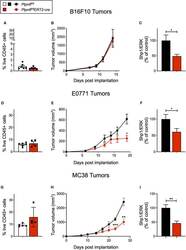
- Figure 4 Ptpn6 deletion drives robust anti-tumor immunity in two immune-rich syngeneic tumor lines. (A) Flow cytometric analysis of live CD45 + cells from B16F10 melanoma tumors isolated from tamoxifen-treated Ptpn6 fl/fl and Ptpn6 fl/fl ERT2-cre mice at day 14 post tumor implantation. (B) B16F10 tumor volume measurements in tamoxifen-treated Ptpn6 fl/fl ERT2-cre and Ptpn6 fl/fl mice. Each data point represents the average tumor volume of all mice in a given group. Data is representative of three independent experiments with 5-7 mice/group. (C) Shp1 protein relative to total Erk2 protein in peripheral blood cells from indicated mice 14 days after initial tamoxifen dose (200 mg/kg bid for 4 days) and 7 days after B16F10 tumor cells were implanted. Data is representative of at least three independent experiments with 5-7 mice per group. (D) Flow cytometric analysis of live CD45 + cells from E0771 tumors isolated from tamoxifen-treated Ptpn6 fl/fl and Ptpn6 fl/fl ERT2-cre mice at day 19 post tumor implantation. (E) E0771 tumor volume measurements in tamoxifen-treated Ptpn6 fl/fl ERT2-cre and Ptpn6 fl/fl mice. Each data point represents the average tumor volume of all mice in a given group. Data is representative of three independent experiments with 4-5 mice per group. Statistical significance was calculated at each time point using an unpaired t -test. (F) Shp1 protein relative to total Erk2 protein in peripheral blood cells from indicated mice 14 days after initial tamoxifen d

- Submitted by
- Invitrogen Antibodies (provider)
- Main image
- Experimental details
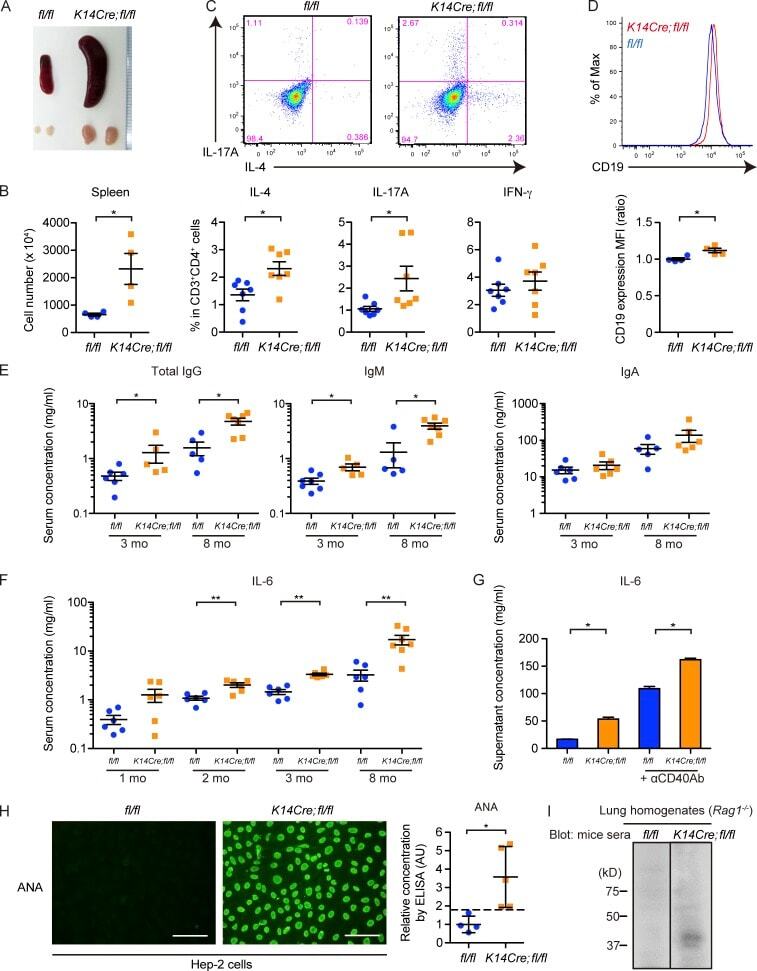
- Figure 5. K14Cre;fl/fl mice exhibit prominent autoimmunity with Th2/Th17 cell polarization and abnormal B cell activation leading to autoantibody production. (A) A representative image of the gross appearance of spleens and inguinal lymph nodes from 3-mo-old fl/fl and K14Cre;fl/fl mice. (B) The number of splenocytes in 3-mo-old fl/fl and K14Cre;fl/fl mice was counted. n = 4 per each group. (C) Lymphocytes isolated from inguinal lymph nodes were stained for CD3 and CD4 and intracellularly stained for IL-4, IL-17A, and IFN-gamma. (Top) Representative two-dimensional plots for IL-4 and IL-17A in CD3 + CD4 + cells. (Bottom) The percentages of cells positive for IL-4, IL-17A, and IFN-gamma are summarized. n = 7 mice per each group. (D) Splenocytes from 3-mo-old fl/fl and K14Cre;fl/fl mice were stained for B220 and CD19. B220 + CD19 + cells were analyzed for CD19 expression. A representative histogram of mean fluorescence intensity (MFI; top) and the comparison of mean fluorescence intensities (bottom) are shown. n = 4 mice per genotype. (E) Sera from 3- and 8-mo-old mice were analyzed for the concentrations of total IgG, IgM, and IgA. n = 5-7 mice per genotype. Note that the results are shown with log scale. (F) Sera from 1-, 2-, 3-, and 8-mo-old mice were analyzed for the concentration of IL-6. n = 6-7 mice per genotype. (G) B cells were isolated from splenocytes of 3-mo-old mice and cultured for 48 h, either unstimulated or stimulated with anti-CD40 antibody (alphaCD40Ab). The c
- Submitted by
- Invitrogen Antibodies (provider)
- Main image
- Experimental details
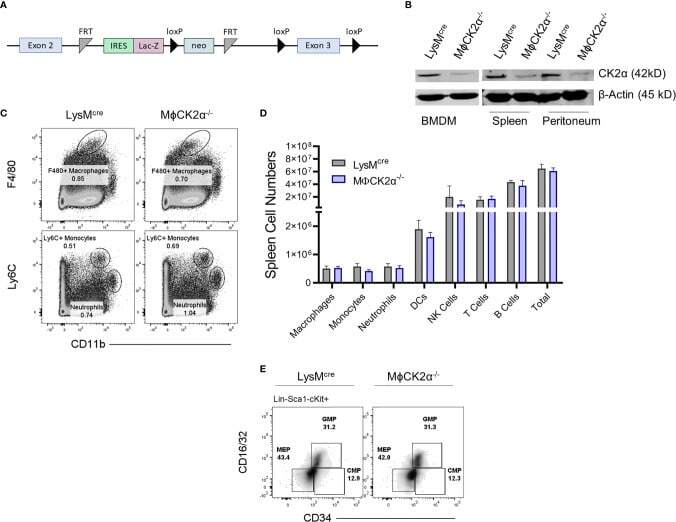
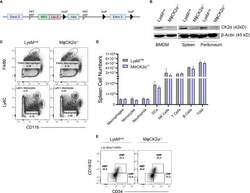
- Figure 1 Development of myeloid cell populations is not detectably altered in MphCK2alpha -/- mice. (A) Schematic of Csnk2a targeting vector. (B) Immunoblots of lysates from BMDMs, splenocytes, or peritoneal cavity cells of LysM cre or LysM cre CK2alpha fl/fl (MphCK2alpha - / - ) mice were probed for CK2alpha or beta-actin as a loading control. n = 2. (C) Splenic myeloid cell populations were stained and analyzed by flow cytometry. Plots depict gating for representative F4/80+ macrophages, Ly6C+ monocytes, and neutrophils (also Ly6G+). (D) Cells from spleen were stained for flow cytometry to enumerate immune cell populations. Data are from pooled experiments, n = 4-12 mice/group. (E) Cells from bone marrow were stained for flow cytometry to evaluate bone marrow precursor populations including common myeloid progenitors (CMPs), granulocyte-monocyte progenitors (GMPs), and megakaryocyte-erythrocyte progenitor (MEP). Cells were pre-gated on Lin-(B220, CD3, CD11b, GR-1 and TER-119), Sca-1-, cKit-. Density plots are representative from two experiments.