 Explore
 Validate
 Learn
Learn Flow cytometry
Antibody data
- Antibody Data
- Antigen structure
- References [31]
- Comments [0]
- Validations
- Flow cytometry [1]
- Other assay [22]
Submit
Validation data
Reference
Comment
Report error
- Product number
- 47-0459-42 - Provider product page

- Provider
- Invitrogen Antibodies
- Product name
- CD45 Monoclonal Antibody (HI30), APC-eFluor™ 780, eBioscience™
- Antibody type
- Monoclonal
- Antigen
- Other
- Description
- Description: The HI30 monoclonal antibody reacts with all isoforms of human CD45, also known as Leukocyte Common Antigen (LCA). CD45 is expressed by all hematopoietic cells excluding circulating erythrocytes and platelets. The cytoplasmic portion of CD45 has tyrosine phosphatase enzymatic activity and plays an important role in activation of lymphocytes. Applications Reported: This HI30 antibody has been reported for use in flow cytometric analysis. Applications Tested: This HI30 antibody has been pre-titrated and tested by flow cytometric analysis of normal human peripheral blood cells. This can be used at 5 µL (0.125 µg) per test. A test is defined as the amount (µg) of antibody that will stain a cell sample in a final volume of 100 µL. Cell number should be determined empirically but can range from 10^5 to 10^8 cells/test. APC-eFluor 780 emits at 780 nm and is excited with the Red laser (633 nm). Please make sure that your instrument is capable of detecting this fluorochome. Light sensitivity: This tandem is sensitive to photo-induced oxidation. Please protect this vial and stained samples from light. Fixation: Samples can be stored in IC Fixation Buffer (Product # 00-8222) (100 µL cell sample + 100 µL IC Fixation Buffer) or 1-step Fix/Lyse Solution (Product # 00-5333) for up to 3 days in the dark at 4°C with minimal impact on brightness and FRET efficiency/compensation. Some generalizations regarding fluorophore performance after fixation can be made, but clone specific performance should be determined empirically. Excitation: 633-647 nm; Emission: 780 nm; Laser: Red Laser. Filtration: 0.2 µm post-manufacturing filtered.
- Reactivity
- Human
- Host
- Mouse
- Isotype
- IgG
- Antibody clone number
- HI30
- Vial size
- 100 Tests
- Concentration
- 5 µL/Test
- Storage
- 4° C, store in dark, DO NOT FREEZE!
Submitted references Plasmatic MMP9 released from tumor-infiltrating neutrophils is predictive for bevacizumab efficacy in glioblastoma patients: an AVAglio ancillary study.
Global absence and targeting of protective immune states in severe COVID-19.
IgE-Based Therapeutic Combination Enhances Antitumor Response in Preclinical Models of Pancreatic Cancer.
Dynamic contrast-enhanced magnetic resonance imaging quantification of leukemia-induced changes in bone marrow vascular function.
Global Absence and Targeting of Protective Immune States in Severe COVID-19.
Developing Human Skin Contains Lymphocytes Demonstrating a Memory Signature.
The Master Regulator Protein BAZ2B Can Reprogram Human Hematopoietic Lineage-Committed Progenitors into a Multipotent State.
Unleashing Type-2 Dendritic Cells to Drive Protective Antitumor CD4(+) T Cell Immunity.
Single nucleotide variant profiles of viable single circulating tumour cells reveal CTC behaviours in breast cancer.
A natural killer-dendritic cell axis defines checkpoint therapy-responsive tumor microenvironments.
Characterization of a switchable chimeric antigen receptor platform in a pre-clinical solid tumor model.
Targeted Disruption of TCF12 Reveals HEB as Essential in Human Mesodermal Specification and Hematopoiesis.
Preferential accumulation of regulatory T cells with highly immunosuppressive characteristics in breast tumor microenvironment.
Evaluation of a simple method for storage of blood samples that enables isolation of circulating tumor cells 96 h after sample collection.
CRISPR/Cas9-based genetic correction for recessive dystrophic epidermolysis bullosa.
Kinase-independent function of RIP1, critical for mature T-cell survival and proliferation.
Platelets confound the measurement of extracellular miRNA in archived plasma.
Targeting methyltransferase PRMT5 eliminates leukemia stem cells in chronic myelogenous leukemia.
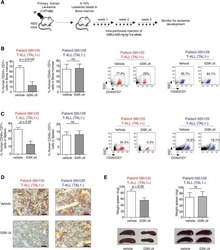
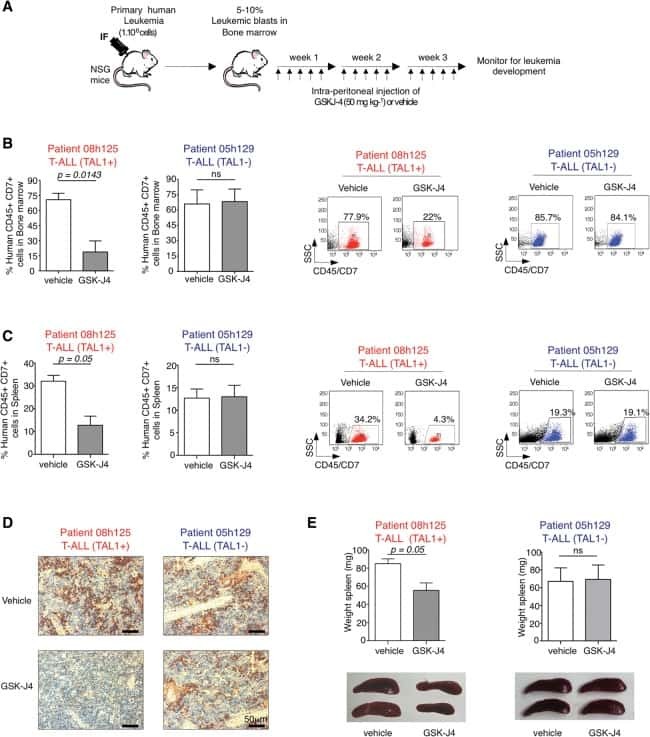
UTX inhibition as selective epigenetic therapy against TAL1-driven T-cell acute lymphoblastic leukemia.
Circulating tumor cell detection in hepatocellular carcinoma based on karyoplasmic ratios using imaging flow cytometry.
Characterization of CD33/CD3 Tetravalent Bispecific Tandem Diabodies (TandAbs) for the Treatment of Acute Myeloid Leukemia.
Human esophageal myofibroblasts secrete proinflammatory cytokines in response to acid and Toll-like receptor 4 ligands.
Activation of the Wnt/planar cell polarity pathway is required for pericyte recruitment during pulmonary angiogenesis.
Retinoic acid regulates hematopoietic development from human pluripotent stem cells.
SF3B1 mutant MDS-initiating cells may arise from the haematopoietic stem cell compartment.
T cell-derived IL-22 amplifies IL-1β-driven inflammation in human adipose tissue: relevance to obesity and type 2 diabetes.
Reprogramming human endothelial cells to haematopoietic cells requires vascular induction.
Hypoxia-cultured human adipose-derived mesenchymal stem cells are non-oncogenic and have enhanced viability, motility, and tropism to brain cancer.
Microvesicles derived from human umbilical cord Wharton's jelly mesenchymal stem cells attenuate bladder tumor cell growth in vitro and in vivo.
Purification and direct transformation of epithelial progenitor cells from primary human prostate.
Yield and characterization of subcutaneous human adipose-derived stem cells by flow cytometric and adipogenic mRNA analyzes.
Jiguet-Jiglaire C, Boissonneau S, Denicolai E, Hein V, Lasseur R, Garcia J, Romain S, Appay R, Graillon T, Mason W, Carpentier AF, Brandes AA, Ouafik L', Wick W, Baaziz A, Gigan JP, Argüello RJ, Figarella-Branger D, Chinot O, Tabouret E
Acta neuropathologica communications 2022 Jan 3;10(1):1
Acta neuropathologica communications 2022 Jan 3;10(1):1
Global absence and targeting of protective immune states in severe COVID-19.
Combes AJ, Courau T, Kuhn NF, Hu KH, Ray A, Chen WS, Chew NW, Cleary SJ, Kushnoor D, Reeder GC, Shen A, Tsui J, Hiam-Galvez KJ, Muñoz-Sandoval P, Zhu WS, Lee DS, Sun Y, You R, Magnen M, Rodriguez L, Im KW, Serwas NK, Leligdowicz A, Zamecnik CR, Loudermilk RP, Wilson MR, Ye CJ, Fragiadakis GK, Looney MR, Chan V, Ward A, Carrillo S, UCSF COMET Consortium, Matthay M, Erle DJ, Woodruff PG, Langelier C, Kangelaris K, Hendrickson CM, Calfee C, Rao AA, Krummel MF
Nature 2021 Mar;591(7848):124-130
Nature 2021 Mar;591(7848):124-130
IgE-Based Therapeutic Combination Enhances Antitumor Response in Preclinical Models of Pancreatic Cancer.
Markov SD, Caffrey TC, O'Connell KA, Grunkemeyer JA, Shin S, Hanson R, Patil PP, Shukla SK, Gonzalez D, Crawford AJ, Vance KE, Huang Y, Eberle KC, Radhakrishnan P, Grandgenett PM, Singh PK, Madiyalakan R, Daniels-Wells TR, Penichet ML, Nicodemus CF, Poole JA, Jaffee EM, Hollingsworth MA, Mehla K
Molecular cancer therapeutics 2021 Dec;20(12):2457-2468
Molecular cancer therapeutics 2021 Dec;20(12):2457-2468
Dynamic contrast-enhanced magnetic resonance imaging quantification of leukemia-induced changes in bone marrow vascular function.
Gomes AL, Gribben J, Siow B, Passaro D, Bonnet D
Haematologica 2021 Aug 1;106(8):2281-2286
Haematologica 2021 Aug 1;106(8):2281-2286
Global Absence and Targeting of Protective Immune States in Severe COVID-19.
Combes AJ, Courau T, Kuhn NF, Hu KH, Ray A, Chen WS, Cleary SJ, Chew NW, Kushnoor D, Reeder GC, Shen A, Tsui J, Hiam-Galvez KJ, Muñoz-Sandoval P, Zhu WS, Lee DS, Sun Y, You R, Magnen M, Rodriguez L, Leligdowicz A, Zamecnik CR, Loudermilk RP, Wilson MR, Ye CJ, Fragiadakis GK, Looney MR, Chan V, Ward A, Carrillo S, Matthay M, Erle DJ, Woodruff PG, Langelier C, Kangelaris K, Hendrickson CM, Calfee C, Rao AA, Krummel MF
bioRxiv : the preprint server for biology 2020 Oct 29;
bioRxiv : the preprint server for biology 2020 Oct 29;
Developing Human Skin Contains Lymphocytes Demonstrating a Memory Signature.
Dhariwala MO, Karthikeyan D, Vasquez KS, Farhat S, Weckel A, Taravati K, Leitner EG, Clancy S, Pauli M, Piper ML, Cohen JN, Ashouri JF, Lowe MM, Rosenblum MD, Scharschmidt TC
Cell reports. Medicine 2020 Nov 17;1(8):100132
Cell reports. Medicine 2020 Nov 17;1(8):100132
The Master Regulator Protein BAZ2B Can Reprogram Human Hematopoietic Lineage-Committed Progenitors into a Multipotent State.
Arumugam K, Shin W, Schiavone V, Vlahos L, Tu X, Carnevali D, Kesner J, Paull EO, Romo N, Subramaniam P, Worley J, Tan X, Califano A, Cosma MP
Cell reports 2020 Dec 8;33(10):108474
Cell reports 2020 Dec 8;33(10):108474
Unleashing Type-2 Dendritic Cells to Drive Protective Antitumor CD4(+) T Cell Immunity.
Binnewies M, Mujal AM, Pollack JL, Combes AJ, Hardison EA, Barry KC, Tsui J, Ruhland MK, Kersten K, Abushawish MA, Spasic M, Giurintano JP, Chan V, Daud AI, Ha P, Ye CJ, Roberts EW, Krummel MF
Cell 2019 Apr 18;177(3):556-571.e16
Cell 2019 Apr 18;177(3):556-571.e16
Single nucleotide variant profiles of viable single circulating tumour cells reveal CTC behaviours in breast cancer.
Wang Y, Guo L, Feng L, Zhang W, Xiao T, Di X, Chen G, Zhang K
Oncology reports 2018 May;39(5):2147-2159
Oncology reports 2018 May;39(5):2147-2159
A natural killer-dendritic cell axis defines checkpoint therapy-responsive tumor microenvironments.
Barry KC, Hsu J, Broz ML, Cueto FJ, Binnewies M, Combes AJ, Nelson AE, Loo K, Kumar R, Rosenblum MD, Alvarado MD, Wolf DM, Bogunovic D, Bhardwaj N, Daud AI, Ha PK, Ryan WR, Pollack JL, Samad B, Asthana S, Chan V, Krummel MF
Nature medicine 2018 Aug;24(8):1178-1191
Nature medicine 2018 Aug;24(8):1178-1191
Characterization of a switchable chimeric antigen receptor platform in a pre-clinical solid tumor model.
Pishali Bejestani E, Cartellieri M, Bergmann R, Ehninger A, Loff S, Kramer M, Spehr J, Dietrich A, Feldmann A, Albert S, Wermke M, Baumann M, Krause M, Bornhäuser M, Ehninger G, Bachmann M, von Bonin M
Oncoimmunology 2017;6(10):e1342909
Oncoimmunology 2017;6(10):e1342909
Targeted Disruption of TCF12 Reveals HEB as Essential in Human Mesodermal Specification and Hematopoiesis.
Li Y, Brauer PM, Singh J, Xhiku S, Yoganathan K, Zúñiga-Pflücker JC, Anderson MK
Stem cell reports 2017 Sep 12;9(3):779-795
Stem cell reports 2017 Sep 12;9(3):779-795
Preferential accumulation of regulatory T cells with highly immunosuppressive characteristics in breast tumor microenvironment.
Syed Khaja AS, Toor SM, El Salhat H, Faour I, Ul Haq N, Ali BR, Elkord E
Oncotarget 2017 May 16;8(20):33159-33171
Oncotarget 2017 May 16;8(20):33159-33171
Evaluation of a simple method for storage of blood samples that enables isolation of circulating tumor cells 96 h after sample collection.
Apostolou P, Ntanovasilis DA, Papasotiriou I
Journal of biological research (Thessalonike, Greece) 2017 Dec;24:11
Journal of biological research (Thessalonike, Greece) 2017 Dec;24:11
CRISPR/Cas9-based genetic correction for recessive dystrophic epidermolysis bullosa.
Webber BR, Osborn MJ, McElroy AN, Twaroski K, Lonetree CL, DeFeo AP, Xia L, Eide C, Lees CJ, McElmurry RT, Riddle MJ, Kim CJ, Patel DD, Blazar BR, Tolar J
NPJ Regenerative medicine 2016;1:16014-
NPJ Regenerative medicine 2016;1:16014-
Kinase-independent function of RIP1, critical for mature T-cell survival and proliferation.
Dowling JP, Cai Y, Bertin J, Gough PJ, Zhang J
Cell death & disease 2016 Sep 29;7(9):e2379
Cell death & disease 2016 Sep 29;7(9):e2379
Platelets confound the measurement of extracellular miRNA in archived plasma.
Mitchell AJ, Gray WD, Hayek SS, Ko YA, Thomas S, Rooney K, Awad M, Roback JD, Quyyumi A, Searles CD
Scientific reports 2016 Sep 13;6:32651
Scientific reports 2016 Sep 13;6:32651
Targeting methyltransferase PRMT5 eliminates leukemia stem cells in chronic myelogenous leukemia.
Jin Y, Zhou J, Xu F, Jin B, Cui L, Wang Y, Du X, Li J, Li P, Ren R, Pan J
The Journal of clinical investigation 2016 Oct 3;126(10):3961-3980
The Journal of clinical investigation 2016 Oct 3;126(10):3961-3980
UTX inhibition as selective epigenetic therapy against TAL1-driven T-cell acute lymphoblastic leukemia.
Benyoucef A, Palii CG, Wang C, Porter CJ, Chu A, Dai F, Tremblay V, Rakopoulos P, Singh K, Huang S, Pflumio F, Hébert J, Couture JF, Perkins TJ, Ge K, Dilworth FJ, Brand M
Genes & development 2016 Mar 1;30(5):508-21
Genes & development 2016 Mar 1;30(5):508-21
Circulating tumor cell detection in hepatocellular carcinoma based on karyoplasmic ratios using imaging flow cytometry.
Liu Z, Guo W, Zhang D, Pang Y, Shi J, Wan S, Cheng K, Wang J, Cheng S
Scientific reports 2016 Dec 23;6:39808
Scientific reports 2016 Dec 23;6:39808
Characterization of CD33/CD3 Tetravalent Bispecific Tandem Diabodies (TandAbs) for the Treatment of Acute Myeloid Leukemia.
Reusch U, Harrington KH, Gudgeon CJ, Fucek I, Ellwanger K, Weichel M, Knackmuss SH, Zhukovsky EA, Fox JA, Kunkel LA, Guenot J, Walter RB
Clinical cancer research : an official journal of the American Association for Cancer Research 2016 Dec 1;22(23):5829-5838
Clinical cancer research : an official journal of the American Association for Cancer Research 2016 Dec 1;22(23):5829-5838
Human esophageal myofibroblasts secrete proinflammatory cytokines in response to acid and Toll-like receptor 4 ligands.
Gargus M, Niu C, Vallone JG, Binkley J, Rubin DC, Shaker A
American journal of physiology. Gastrointestinal and liver physiology 2015 Jun 1;308(11):G904-23
American journal of physiology. Gastrointestinal and liver physiology 2015 Jun 1;308(11):G904-23
Activation of the Wnt/planar cell polarity pathway is required for pericyte recruitment during pulmonary angiogenesis.
Yuan K, Orcholski ME, Panaroni C, Shuffle EM, Huang NF, Jiang X, Tian W, Vladar EK, Wang L, Nicolls MR, Wu JY, de Jesus Perez VA
The American journal of pathology 2015 Jan;185(1):69-84
The American journal of pathology 2015 Jan;185(1):69-84
Retinoic acid regulates hematopoietic development from human pluripotent stem cells.
Rönn RE, Guibentif C, Moraghebi R, Chaves P, Saxena S, Garcia B, Woods NB
Stem cell reports 2015 Feb 10;4(2):269-81
Stem cell reports 2015 Feb 10;4(2):269-81
SF3B1 mutant MDS-initiating cells may arise from the haematopoietic stem cell compartment.
Mian SA, Rouault-Pierre K, Smith AE, Seidl T, Pizzitola I, Kizilors A, Kulasekararaj AG, Bonnet D, Mufti GJ
Nature communications 2015 Dec 8;6:10004
Nature communications 2015 Dec 8;6:10004
T cell-derived IL-22 amplifies IL-1β-driven inflammation in human adipose tissue: relevance to obesity and type 2 diabetes.
Dalmas E, Venteclef N, Caer C, Poitou C, Cremer I, Aron-Wisnewsky J, Lacroix-Desmazes S, Bayry J, Kaveri SV, Clément K, André S, Guerre-Millo M
Diabetes 2014 Jun;63(6):1966-77
Diabetes 2014 Jun;63(6):1966-77
Reprogramming human endothelial cells to haematopoietic cells requires vascular induction.
Sandler VM, Lis R, Liu Y, Kedem A, James D, Elemento O, Butler JM, Scandura JM, Rafii S
Nature 2014 Jul 17;511(7509):312-8
Nature 2014 Jul 17;511(7509):312-8
Hypoxia-cultured human adipose-derived mesenchymal stem cells are non-oncogenic and have enhanced viability, motility, and tropism to brain cancer.
Feng Y, Zhu M, Dangelmajer S, Lee YM, Wijesekera O, Castellanos CX, Denduluri A, Chaichana KL, Li Q, Zhang H, Levchenko A, Guerrero-Cazares H, Quiñones-Hinojosa A
Cell death & disease 2014 Dec 11;5(12):e1567
Cell death & disease 2014 Dec 11;5(12):e1567
Microvesicles derived from human umbilical cord Wharton's jelly mesenchymal stem cells attenuate bladder tumor cell growth in vitro and in vivo.
Wu S, Ju GQ, Du T, Zhu YJ, Liu GH
PloS one 2013;8(4):e61366
PloS one 2013;8(4):e61366
Purification and direct transformation of epithelial progenitor cells from primary human prostate.
Goldstein AS, Drake JM, Burnes DL, Finley DS, Zhang H, Reiter RE, Huang J, Witte ON
Nature protocols 2011 May;6(5):656-67
Nature protocols 2011 May;6(5):656-67
Yield and characterization of subcutaneous human adipose-derived stem cells by flow cytometric and adipogenic mRNA analyzes.
Yu G, Wu X, Dietrich MA, Polk P, Scott LK, Ptitsyn AA, Gimble JM
Cytotherapy 2010 Jul;12(4):538-46
Cytotherapy 2010 Jul;12(4):538-46
No comments: Submit comment
Supportive validation
- Submitted by
- Invitrogen Antibodies (provider)
- Main image
- Experimental details
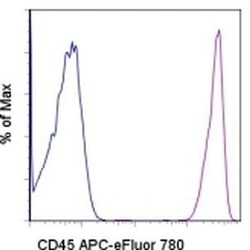
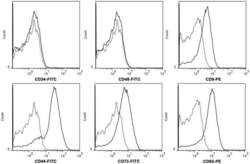
- Staining of normal human peripheral blood cells with Mouse IgG1 K Isotype Control APC-eFluor® 780 (Product # 47-4714-82) (blue histogram) or Anti-Human CD45 APC-eFluor® 780 (purple histogram). Cells in the lymphocyte gate were used for analysis.

Supportive validation
- Submitted by
- Invitrogen Antibodies (provider)
- Main image
- Experimental details
- NULL

- Submitted by
- Invitrogen Antibodies (provider)
- Main image
- Experimental details
- NULL
- Submitted by
- Invitrogen Antibodies (provider)
- Main image
- Experimental details
- NULL
- Submitted by
- Invitrogen Antibodies (provider)
- Main image
- Experimental details
- NULL
- Submitted by
- Invitrogen Antibodies (provider)
- Main image
- Experimental details
- NULL
- Submitted by
- Invitrogen Antibodies (provider)
- Main image
- Experimental details
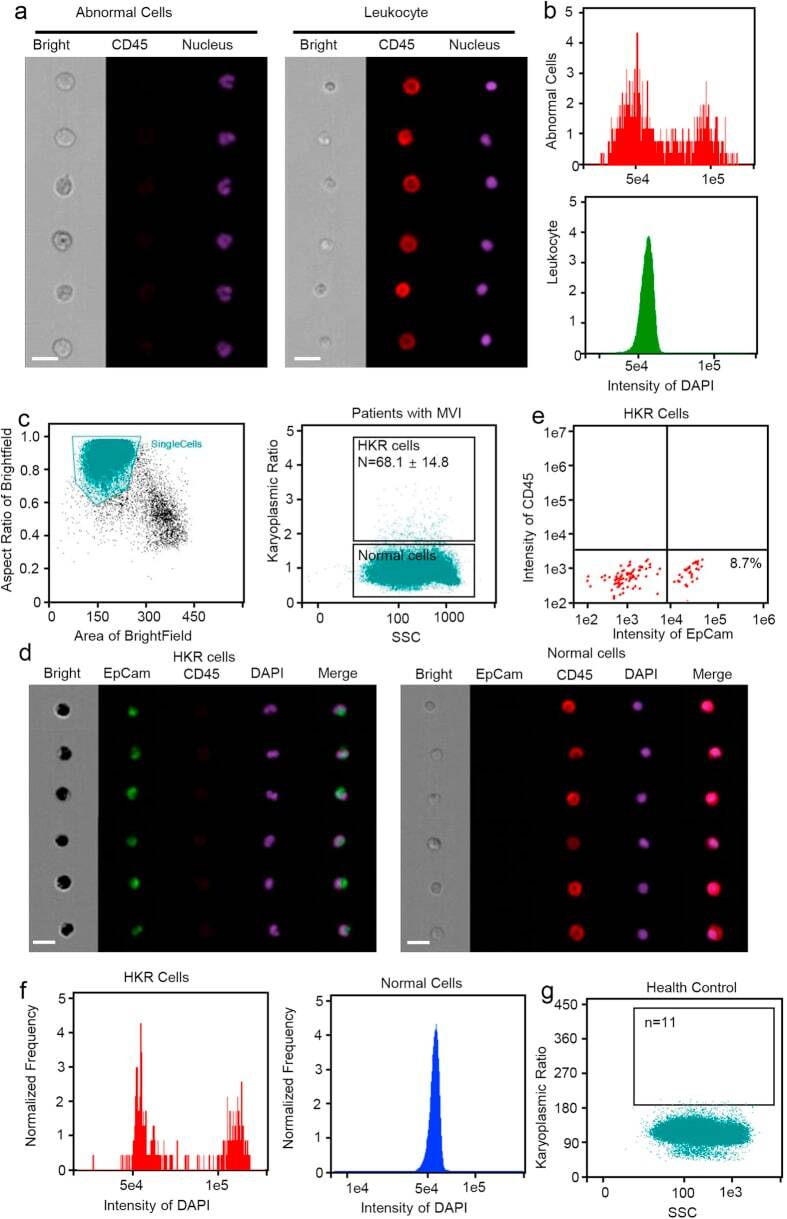
- Figure 1 Detection of cells with abnormal nuclei using imaging flow cytometry. ( a ) Representative cell images with the same DAPI intensity. CD45, a lymphocyte biomarker, was labeled with PE-Cy5. Upper panel: CD45 + lymphocyte with a smaller DAPI area. Lower panel: CD45 - cells with a larger DAPI area, showing a looser structure of nuclei. Scale bars represent 20 mum. ( b ) Mean DAPI fluorescence intensity in PBMCs. Unlike the cells with a normal DAPI area (lower panel), a G1 and G2 peak could be detected in the cells with larger DAPI areas (upper panel). ( c ) Imaging flow cytometry test results for the peripheral blood samples from MVI patients. Left panel, basic results for peripheral blood mononuclear cells (PBMCs), the horizontal axis indicates the cell area and the vertical axis indicates the aspect ratio. The gate displays the group of single cells. Right panel: patients with MVI had 68.1 +- 14.8 cells with large DAPI areas. ( d ) Representative images for PBMCs from HCC patients. CD45, a lymphocyte biomarker, was labeled with PE-Cy5. EpCAM, a biomarker of circulating tumor cells (CTCs), was labeled with FITC. Left panel: cells with high karyoplasmic ratios (HKR cells), which were EpCAM-positive and CD45-negative. Right panel: cells with normal karyoplasmic ratios (normal cells), which were EpCAM-negative and CD45-positive. Scale bars represent 20 mum. ( e ) Flow cytometry test results for HKR cells from MVI patients. All HKR cells were CD45 - , but only 8.7% of HKR c
- Submitted by
- Invitrogen Antibodies (provider)
- Main image
- Experimental details
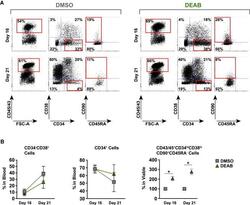
- Figure 1 Retinoic Acid Signaling Inhibition Increases the Yield of Hematopoietic Progenitors with an HSC-like Phenotype from Human Pluripotent Stem Cells (A) Schematic of pluripotent stem cell differentiation system used to model human hematopoietic development through mesoderm specification and blood commitment. RA inhibitors or RA was present continuously during the 16-day differentiation, except where otherwise stated. (B) Representative FACS plots showing the hematopoietic population derived from pluripotent stem cells at day 16 of differentiation. FACS gates show blood (CD45/43 + ), hematopoietic progenitors (CD45/43 + CD34 + ), and HSC-like immature progenitors (CD45/43 + CD34 hi CD38 lo CD90 + CD45RA - ). Gates are based on FMO controls with more stringent CD34 hi and CD38 lo gating based on cord blood hematopoietic stem and progenitor cell standards. Doublet exclusion and dead cell exclusion were done before applying the gates. (C) Frequency (%) of blood subfractions derived from cells treated with DEAB (green) at 10 muM from seven independent experiments (n = 7) (see also Figures S1 A and S1B) or RA (orange) (0.01, 0.1, 1.0 muM; n = 3). All values are normalized to the DMSO control (gray) as indicated by the dotted line (100%). X = no events. Bar graphs show change in cell viability as measured by 7AAD for tested conditions. (D) mRNA expression level of RA target gene RARbeta at day 8 of differentiation (n = 3). (E) Frequency of the HSC-like fraction in cells treated

- Submitted by
- Invitrogen Antibodies (provider)
- Main image

- Experimental details
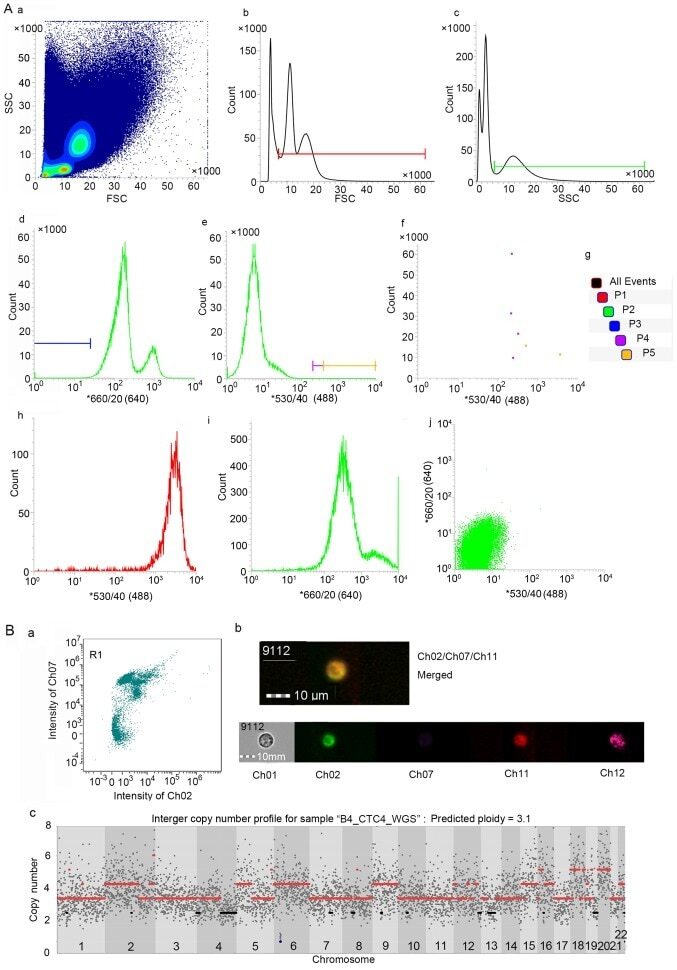
- Figure 2. Feasible method to detect and isolate CTCs. (A) Gates were set to capture viable CTCs via FACS analysis. (A-b) The P1 gate was set to obtain cells with diameters larger than lymphocytes, and (A-c) the P2 gate was set to acquire granulocyte-like side scatter (SSC) cells. (A-a) P1 was combined with P2 to capture viable cells similar to tumour cells in size and SSC. (A-d and -f) The P3 and P4 gates were used to select hTERT-positive cells without leucocyte-common antigen (CD45) expression and collect highly hTERT-positive cells for further analysis. (A-e and -f) The sorted cells were detected at P5 gate (taking partial results from patient B1 for example). (A-i) The single-stained CD45-APC positive control of PBMC and (A-j) the infected control, including negative control (peripheral blood of a healthy person), (A-h) positive control (the hTERT-expressing SK-BR-3 cancer cell line). (B) Analysis of circulating breast tumour cells using imaging flow cytometry. (B-a) Cell image mapped with the point in the bottom right corner of R1 gate (high signal captured in ch02 and low signal captured in ch07, corresponding to the gate P5). Ch02 received signal emitted by GFP (hTERT), ch07 reflects the signal intensity of eFluor450 (CD45), ch11 represents the APC (ErbB2) intensity and ch12 is the SSC channel. (B-b) The merged image represents hTERT + CD45-ErbB2 + cells. (B-c) The copy number profiles of a near-triploid CTC.
- Submitted by
- Invitrogen Antibodies (provider)
- Main image
- Experimental details
- Figure 2 hWJMSC-MVs surface expressed molecules analysis. Flow cytometery analysis showed hWJMSC-MVs were positive for some surface expressed molecules typically expressed by MSCs, such as CD9, CD44, CD63, CD73, and negative for CD34, CD45.

- Submitted by
- Invitrogen Antibodies (provider)
- Main image
- Experimental details
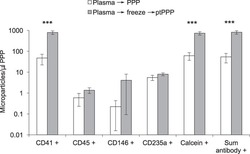
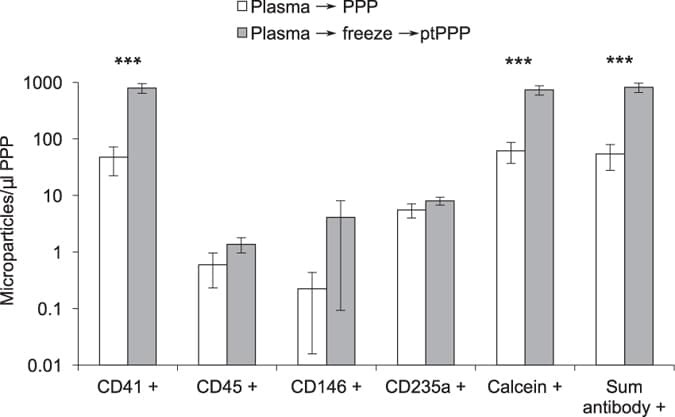
- Figure 3 Freeze/thaw of standard plasma increased platelet MPs in platelet poor plasma (PPP). Standard plasma from six healthy volunteers was either immediately processed to PPP or exposed to a single freeze/thaw cycle prior to a second centrifugation step to remove residual platelets. Platelet (CD41+), leukocyte (CD45+), endothelial (CD146+), and RBC (CD235a) MPs were quantified by flow cytometry. Total number of MPs in a sample was either calculated by the sum of positive events detected by antibody staining (Sum antibody+) or measured by staining with calcein-AM, a non-specific dye that fluorescently labels intact vesicles. Results were similar and showed marked increase after freeze-thaw of standard plasma *** indicates P < 0.001. This effect was largely due to an increase in platelet derived MPs (CD41+).
- Submitted by
- Invitrogen Antibodies (provider)
- Main image

- Experimental details
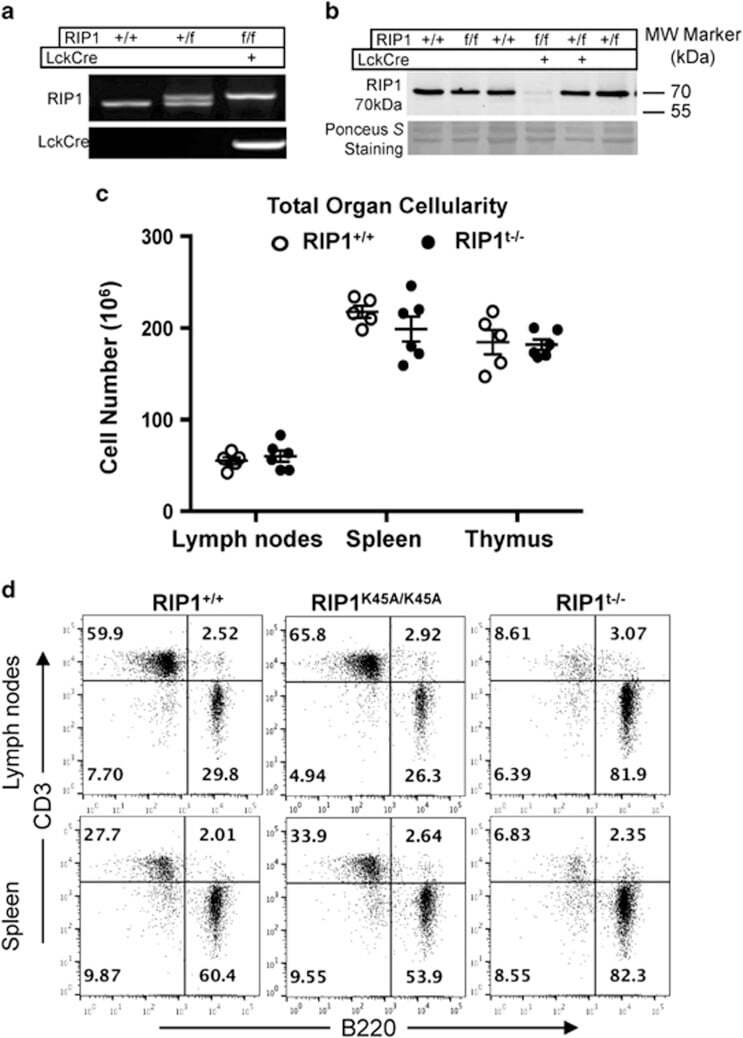
- Figure 2 T-cell-specific deletion of RIP1. ( a ) Genotyping by PCR of mouse ear DNA showing genotypes generated from a RIP1 +/f x RIP1 +/f Lckcre + mating cross. ( b ) Western blotting analysis of RIP1 in thymocytes from mice of the indicated genotypes. Ponceus S staining was performed as protein loading/transfer control. ( c ) Total organ cellularity of RIP1 t-/- mutant mice (filled circles) and RIP1 +/+ control mice (open circles) are shown. Error bars are average+-S.E.M. P -values >0.05. ( d ) Representative two-color flow cytometric plots showing the T cell (CD3 + ) and B cell (B220 + ) populations in the indicated peripheral lymphoid organs
- Submitted by
- Invitrogen Antibodies (provider)
- Main image
- Experimental details
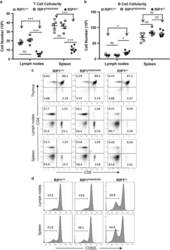
- Figure 3 Analysis of T-cell populations in RIP1 t-/- mice. ( a ) Absolute T cell (CD3 + ) and ( b ) B cell (B220 + ) numbers in the spleen and lymph nodes of mutant and control mice. * P

- Submitted by
- Invitrogen Antibodies (provider)
- Main image
- Experimental details
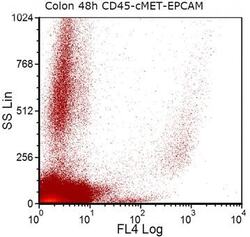
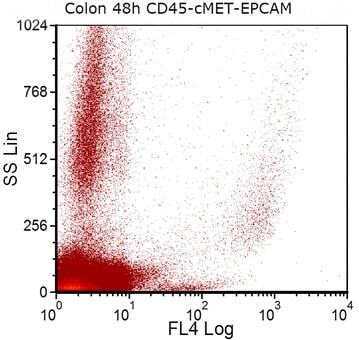
- Fig. 5 EPCAM (FL4) expression in a colon-cancer cell-line-spiked sample on day 3 of storage. Colon cancer cells from HCT-116 cancer cell line were spiked into whole blood from a healthy donor. After sample staining with CD45, PECAM1 and EPCAM antibodies, EPCAM positive cells were selected by excluding CD45 and PECAM1 positive cells during gating on FCSExpress V3
- Submitted by
- Invitrogen Antibodies (provider)
- Main image

- Experimental details
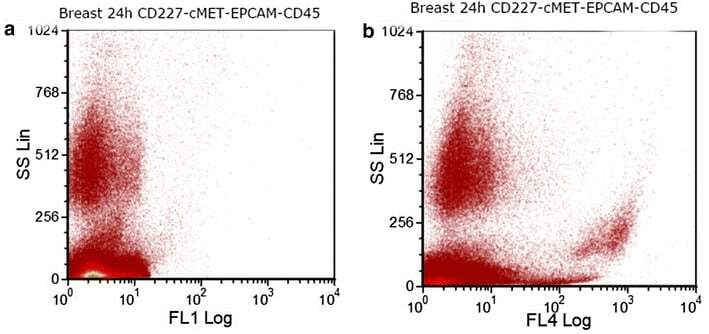
- Fig. 6 Dot plots showing a expression of CD227 (FL1) and b expression of EPCAM (FL4) in a breast-cancer cell-line-spiked sample on the day 2 of storage. Breast cancer cells from MDA-MB-231 cancer cell line were spiked into whole blood from a healthy donor. After sample staining with CD45, PECAM1, EPCAM and CD227 antibodies, EPCAM and CD227 positive cells were selected by excluding CD45 and PECAM1 positive cells during gating on FCSExpress V3
- Submitted by
- Invitrogen Antibodies (provider)
- Main image
- Experimental details
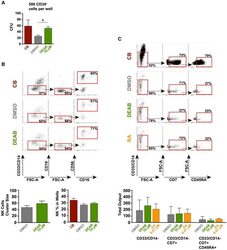
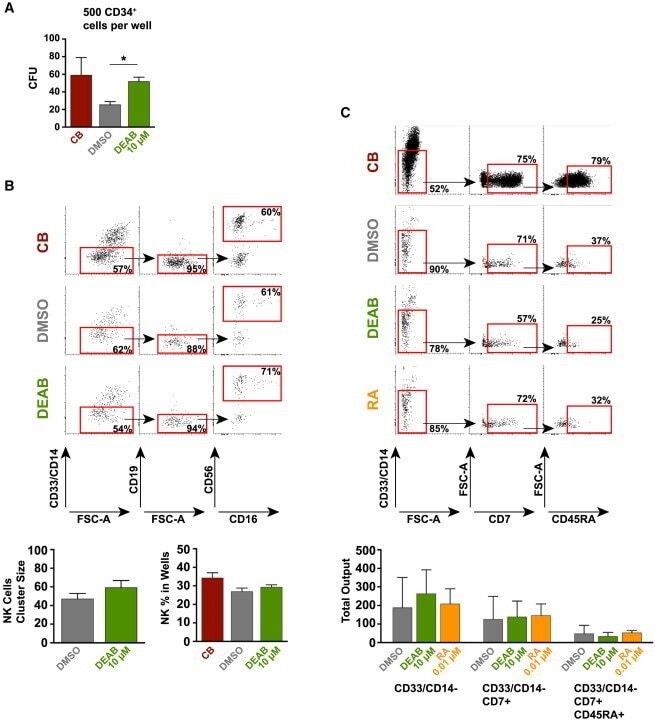
- Figure 3 Retinoic Acid Inhibition Increases the Differentiation Capacity of Hematopoietic Progenitors toward Myeloid and Lymphoid Lineage (A) CFU potential of 500 sorted progenitors (CD45/CD43 + CD34 + ) from DEAB-treated cultures (green) and DMSO control (gray) from four independent experiments (n = 4). CFU potential of progenitors similarly sorted from cord blood (CD45/CD43 + CD34 + ) is shown in red. (B) Lymphoid/myeloid differentiation assay performed on iPSC-derived hematopoietic cells. FACS plots and bar graphs showing non-myeloid (CD33/CD14 - ), CD19 - , CD56 + , and CD56 + CD16 + NK fraction from wells seeded with 50 HSC-like cells (CD45/43 + CD34 hi CD38 lo CD90 + CD45RA - ) (17 individual wells) cultured on OP9 stroma for 4 weeks. Left bar graph shows the cluster size of the NK fraction. Right bar graph shows the frequency of this population in the viable non-stroma fraction. See also Figure S2 . (C) FACS plots showing non-myeloid, CD7 + , CD45RA + multipotent early lymphoid progenitors from 3,500 sorted CD34 + cells cultured on OP9DL1 stroma for 3 weeks from one out of two independent experiments (n = 2). FACS plots are gated on the viable non-stroma fraction. Bar graph show the total output of differentiated cells from progenitors generated with DMSO, DEAB, or RA. FACS gates are based on FMO controls. Data represent mean +- SEM. Asterisks indicate significant differences ( * p < 0.05).
- Submitted by
- Invitrogen Antibodies (provider)
- Main image
- Experimental details
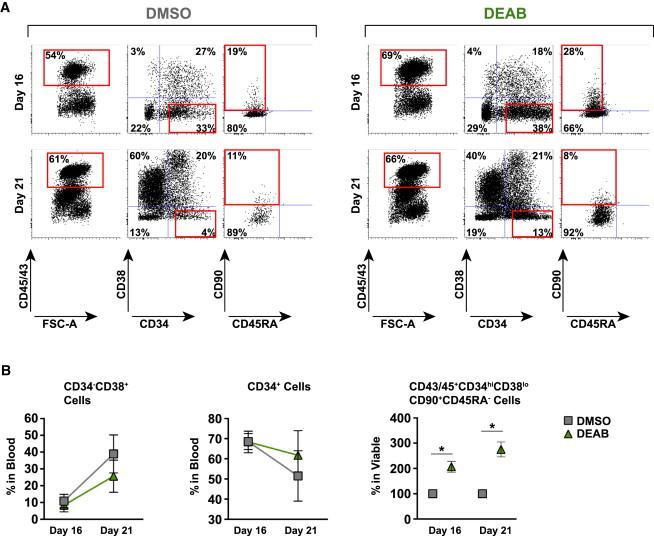
- Figure 5 Decreased Retinoic Acid Signaling Maintains the Primitiveness of Generated Hematopoietic Progenitors (A) Representative FACS profiles of cells harvested at day 16 and after extended culture period at day 21. Cells were treated with or without DEAB at 10 muM during the whole culture period. (B) Graphs showing fold changes in maturation of the hematopoietic population (CD45/43 + ) observed between day 16 and day 21 for cells treated with DEAB or DMSO from three independent experiments (n = 3). Data represent mean +- SEM. Asterisks indicate significant differences ( * p < 0.05).
- Submitted by
- Invitrogen Antibodies (provider)
- Main image

- Experimental details
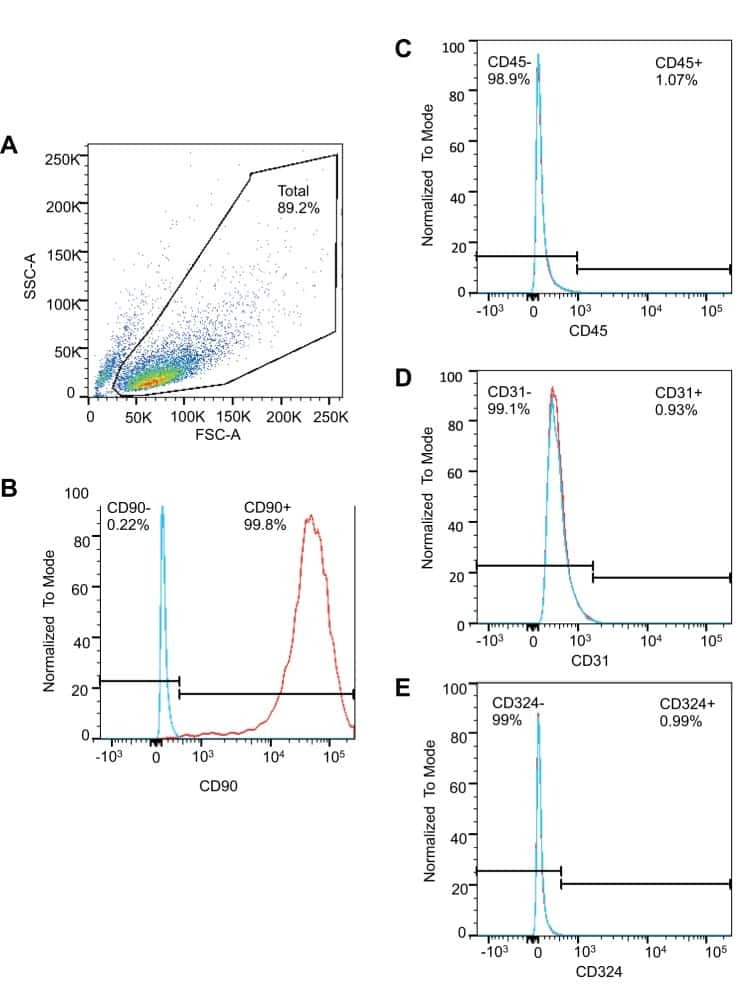
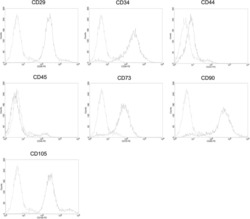
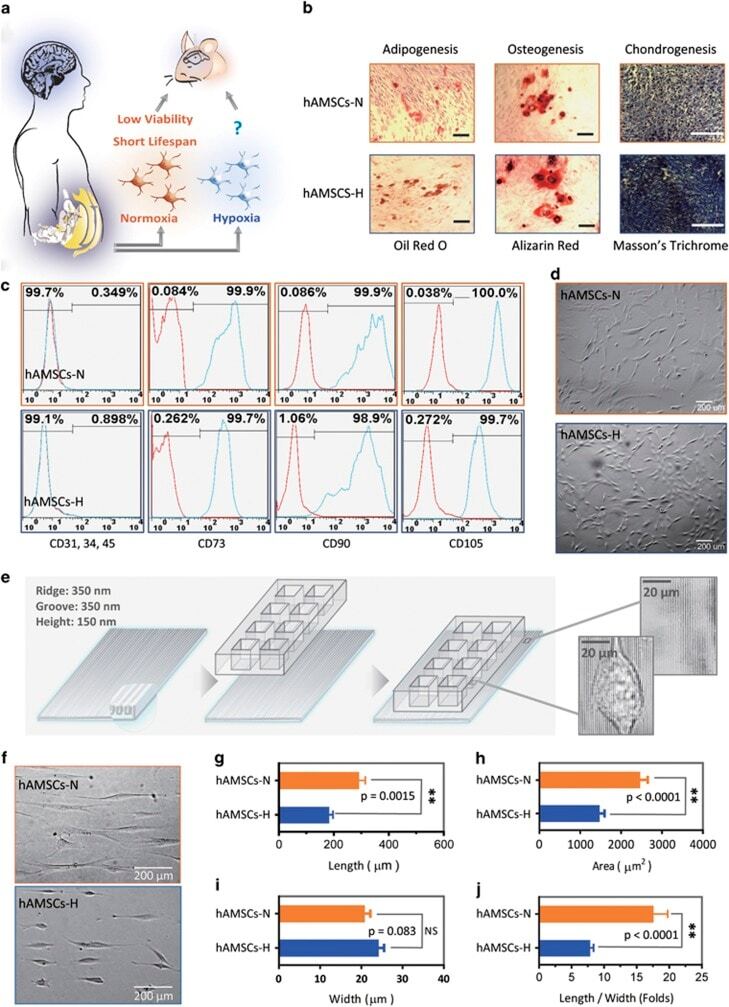
- Figure 1 Primary human adipose-derived cells cultured in hypoxia (hAMSCs-H) and normoxia (hAMSCs-N) are both MSCs but normoxia-cultured cells show increased signs of senescence, such as increased area and elongated morphology, compared with hypoxia-cultured cells. ( a ) hAMSCs were isolated from human fat tissue and cultured in hypoxic (1.5% oxygen) or normoxic (21% oxygen) conditions in vitro . The viability, mobility, tumor tropism, safety, and tumorigenic potential were subsequently compared in vitro and in vivo . ( b ) Differentiation assay. hAMSCs were cultured in control media and differentiation media for 3 weeks, 10 days after the second passage. Three different stains were performed to assess differentiation capabilities (scale bar, 100 mu m). ( c ) Flow cytometric analysis was performed to confirm the absence of CD31-, CD34-, and CD45-positive cells in both cell cultures. In addition, primary hAMSC cultures expressed high levels of CD73, CD90, and CD105, both in hypoxic and normoxic culture conditions at day 10 after passage 2. ( d ) Representative images of cell morphologies of hAMSCs on 2D surface (scale bar, 200 mu m). ( e ) Schematic of 3D-nanopatterned surface used to assess morphology and motility. ( f ) Images of cell morphologies of hAMSCs on 3D-nanopatterned surface (scale bar, 200 mu m). ( g - j ) The length, width, area, and length-to-width ratio were measured and compared after cell aligned on the nanopattern surface. Error bars represent S.E.M. * P
- Submitted by
- Invitrogen Antibodies (provider)
- Main image
- Experimental details
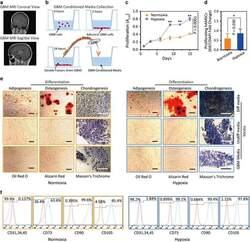
- Figure 3 Hypoxia-cultured primary human adipose-derived mesenchymal stem cells (hAMSCs-H) retain a greater proliferation capacity compared with normoxia-cultured primary hAMSCs (hAMSCs-N) when exposed to GBM media. hAMSCs-H maintain stem cell characteristics when exposed to GBM media. ( a ) Representative MRI of GBM from a patient. ( b ) Schema showing the collection of GBM CM and culture of hAMSCs in filtered GBM CM for proliferation and migration assays. ( c ) MTT assay was used to determine the effects of hypoxic conditions on the proliferative capacity of primary hAMSCs in GBM CM. In GBM CM, hAMSCs-H showed greater proliferation at day 10 and 15 compared with hAMSCs-N. ( d ) Ki-67 immunostaining was performed to quantify the number of proliferating cells in GBM CM. Proliferative capacities of hAMSCs-H and hAMSCs-N are shown in GBM CM (normalized to hAMSC-N proliferative capacity in control media). In GBM CM, hAMSCs-H had a greater proportion of proliferating cells than hAMSCs-N. ( e) Differentiation assay. hAMSCs were cultured in control media, differentiation media, and GBM CM for 3 weeks, 10 days after the second passage. Three stainings were performed to assess the differentiation capabilities (scale bar, 100 mu m). Both hAMSCs-N and hAMSCs-H maintained tri-lineage differentiation capability in GBM CM. ( f ) Flow cytometric analysis for CD31, CD34, CD45, CD73, CD90, and CD105 in hAMSC-N and hAMSC-H cultures after exposure to GBM CM for 20 days. hAMSCs-H maintained MSC

- Submitted by
- Invitrogen Antibodies (provider)
- Main image
- Experimental details
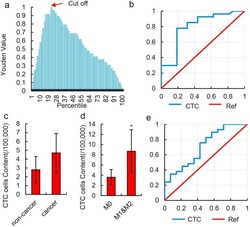
- Figure 3 Diagnostic value of HKR cell content. ( a ) Youden curve for HKR cells in 52 HCC patients and 12 normal individuals. Arrow refers to the maximum Youden index, which was defined as the threshold. ( b ) ROC curve of HKR cells for 23 HCC patients with MVI (M1 & M2) and 18 HCC patients without MVI (M0). HKR cells were identified by imaging flow cytometry. ( c ) Relative number of CTCs in 100,000 peripheral blood mononuclear cells in non-cancer liver disease patients and HCC patients. CTCs were defined as CD45 - & EpCAM + cells in the peripheral blood and detected by imaging flow cytometry. Data are presented as means +- SD of independent experiments. ( d ) Relative number of CTCs in 100,000 peripheral blood mononuclear cells in HCC patients with MVI (M1 & M2) and HCC patients without MVI (M0). CTCs were defined as CD45 - & EpCAM + cells in peripheral blood and detected by imaging flow cytometry. Data are presented as means +- SD of independent experiments. * P < 0.05. ( e ) ROC curve of CTCs for 23 HCC patients with MVI (M1 & M2) and 18 HCC patients without MVI (M0) in 52 total samples. CTCs were defined as CD45 - & EpCAM + cells in peripheral blood and detected by imaging flow cytometry.
- Submitted by
- Invitrogen Antibodies (provider)
- Main image
- Experimental details
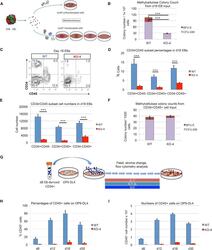
- Figure 5 Inefficient Hematopoietic Outcomes from HEB -/- hESC-Derived Progenitors (A) Experimental overview for the colony-forming unit (CFU) assay of erythromyeloid potential. Cell suspensions from day-18 (d18) EBs were obtained and placed into methylcellulose cultures either as an unfractionated population (top) or as four sorted subsets based on combinatorial expression of CD34 and CD45 (bottom). (B) Numbers of erythroid (BFU-E) and myeloid (CFU-GM) arising from unfractionated WT and HEB -/- d18 EB-derived cells in methylcellulose cultures. (C) Flow-cytometric analysis for CD34 and CD45 expression of unfractionated WT and HEB -/- d18 EB-derived cells. (D and E) The percentages (D) and cell numbers (E) of CD34 + CD45 - , CD34 + CD45 + , and CD34 - CD45 + subsets within WT and HEB -/- d18 EBs. (F) Numbers of erythroid (BFU-E) and myeloid (CFU-GM) arising from CD34 + CD45 + cells sorted from WT and HEB -/- d18 EBs. (G) Experimental overview for T cell differentiation. CD34 + cells were sorted from d8 EBs and co-cultured with OP9-DL4 cells. (H and I) Percentages (H) and numbers (I) of CD45 + cells at successive days (d) of OP9-DL4 co-cultures. Error bars represent mean +- SD (n = 3 independent experiments). *** p < 0.005 by Student's t test. Plots in (C) are representative of three independent experiments. See also Figures S5 and S6 .
- Submitted by
- Invitrogen Antibodies (provider)
- Main image
- Experimental details
- Figure 6 Ectopic Expression of HEBCan in HEB -/- hESCs Restores Lineage-Specific Gene Expression and Hematopoietic Specification (A) Western blot analysis for HEB expression in WT, KO (HEB -/- ), KO + GFP (HEB -/- hESCs transduced with GFP control vector) and KO + HEBCan (HEB -/- hESCs transduced with HEBCan-encoding vector) hESCs. (B) Bright-field (top) and fluorescent (bottom) images of day-8 (d8) EBs derived from HEB -/- hESCs transduced with control or HEBCan-expressing lentiviral particles. Scale bar, 100 mum. (C and D) qRT-PCR analysis for the expression of pluripotency-associated genes (C) and mesoendodermal genes (D) in WT, KO + GFP, and KO + HEBCan hESC-derived cells at d0 and d4 of EB culture. mRNA levels are shown relative to GAPDH. (E) Flow-cytometric analysis of CD34 and KDR, CD144, and CD31 on WT, KO + GFP, and KO + HEBCan d8 EB-derived cells. (F and G) Percentages (F) and numbers (G) of CD34 + cells in WT, KO + GFP, and KO + HEBCan d8 EBs. (H) Flow-cytometric analysis for CD34 and CD45 on WT, KO + GFP, and KO + HEBCan d18 EB-derived cells. (I and J) Percentages (I) and numbers (J) of CD34/CD45 subsets in WT, KO + GFP, and KO + HEBCan d18 EB-derived cells. (K) Numbers of erythroid (BFU-E) and myeloid (CFU-GM) arising from unfractionated WT, KO + GFP, and KO + HEBCan d18 EBs. Error bars represent mean +- SD (n = 3 independent experiments). * p < 0.05, ** p < 0.01, *** p < 0.005 by Student's t test. Images in (A) and (B) and plots in (E) and (H) are represent

- Submitted by
- Invitrogen Antibodies (provider)
- Main image
- Experimental details
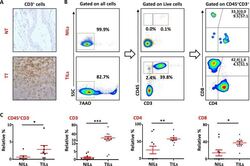
- Figure 1 T-cell infiltration in normal and tumor tissues in primary breast cancer ( A ). Representative images of immunohistochemical staining of tumor-infiltrating CD3 + T cells in formalin-fixed paraffin embedded breast non-tumor (NT) and tumor tissues (TT). ( B ). Freshly isolated immune cells infiltrating NT (NILs) and TT (TILs) from 11 PBC patients were stained with 7AAD, CD45, CD3, CD4 and CD8 antibodies for identification of T cells and their subsets. Representative flow cytometric plots of surface staining from one cancer patient are shown. 7AAD dye was used to gate live cells, followed by lymphocyte identification by CD45 and CD3 stainings. Different subsets of T cells were then characterized using CD4 and CD8 antibodies. ( C ). Scatter plots showing the differences in tissue-infiltrating CD45 + CD3 - , CD45 + CD3 + , CD4 + and CD8 + cells between NILs and TILs.
