 Explore
 Validate
 Learn
Learn Flow cytometry
Antibody data
- Antibody Data
- Antigen structure
- References [17]
- Comments [0]
- Validations
- Flow cytometry [1]
- Other assay [18]
Submit
Validation data
Reference
Comment
Report error
- Product number
- 64-0452-80 - Provider product page

- Provider
- Invitrogen Antibodies
- Product name
- Anti-CD45R (B220) Monoclonal Antibody (RA3-6B2), Super Bright 645, eBioscience™
- Antibody type
- Monoclonal
- Antigen
- Other
- Description
- Description: The RA3-6B2 monoclonal antibody reacts with exon A-restricted isoform of mouse CD45, a 220 kDa surface molecule. CD45R/B220 epitope is mainly expressed by the B cell lineage from early Pro-B to mature B cells. However, some activated T cells, lymphokine activated killer cells (LAK), NK cell progenitors in the bone marrow, and T cells of the lpr/lpr mutant mouse also express this antigen. Applications Reported: This RA3-6B2 antibody has been reported for use in flow cytometric analysis. Applications Tested: This RA3-6B2 antibody has been tested by flow cytometric analysis of mouse splenocytes. This can be used at less than or equal to 0.5 µg per test. A test is defined as the amount (µg) of antibody that will stain a cell sample in a final volume of 100 µL. Cell number should be determined empirically but can range from 10^5 to 10^8 cells/test. It is recommended that the antibody be carefully titrated for optimal performance in the assay of interest. Super Bright 645 is a tandem dye that can be excited with the violet laser line (405 nm) and emits at 645 nm. We recommend using a 660/20 bandpass filter. Please make sure that your instrument is capable of detecting this fluorochrome. When using two or more Super Bright dye-conjugated antibodies in a staining panel, it is recommended to use Super Bright Complete Staining Buffer (Product # SB-4401) to minimize any non-specific polymer interactions. Please refer to the datasheet for Super Bright Staining Buffer for more information. Light sensitivity: This tandem dye is sensitive to photo-induced oxidation. Protect this vial and stained samples from light. Fixation: Samples can be stored in IC Fixation Buffer (cat. 00-8222) (100 µL of cell sample + 100 µL of IC Fixation Buffer) or 1-step Fix/Lyse Solution (cat. 00-5333) for up to 3 days in the dark at 4°C with minimal impact on brightness and FRET efficiency/compensation. Some generalizations regarding fluorophore performance after fixation can be made, but clone specific performance should be determined empirically. Excitation: 405 nm; Emission: 645 nm; Laser: Violet Laser Super Bright Polymer Dyes are sold under license from Becton, Dickinson and Company.
- Reactivity
- Human, Mouse
- Host
- Rat
- Isotype
- IgG
- Antibody clone number
- RA3-6B2
- Vial size
- 25 µg
- Concentration
- 0.2 mg/mL
- Storage
- 4° C, store in dark, DO NOT FREEZE!
Submitted references High-throughput analysis of lung immune cells in a combined murine model of agriculture dust-triggered airway inflammation with rheumatoid arthritis.
Hypoxia-induced miR-210 modulates the inflammatory response and fibrosis upon acute ischemia.
Monocyte-derived dendritic cells link localized secretory IgA deficiency to adaptive immune activation in COPD.
Murine myeloid cell MCPIP1 suppresses autoimmunity by regulating B-cell expansion and differentiation.
Ibrutinib does not prevent kidney fibrosis following acute and chronic injury.
Proteostasis in dendritic cells is controlled by the PERK signaling axis independently of ATF4.
Myeloid Cell CK2 Regulates Inflammation and Resistance to Bacterial Infection.
Ischemia Reperfusion Injury Triggers CXCL13 Release and B-Cell Recruitment After Allogenic Kidney Transplantation.
Pituitary Adenylate Cyclase-Activating Polypeptide Alleviates Intestinal, Extra-Intestinal and Systemic Inflammatory Responses during Acute Campylobacter jejuni-induced Enterocolitis in Mice.
The Host-Specific Intestinal Microbiota Composition Impacts Campylobacter coli Infection in a Clinical Mouse Model of Campylobacteriosis.
The lysophospholipase D enzyme Gdpd3 is required to maintain chronic myelogenous leukaemia stem cells.
Toll-Like Receptor-4 Dependent Intestinal and Systemic Sequelae Following Peroral Campylobacter coli Infection of IL10 Deficient Mice Harboring a Human Gut Microbiota.
Overcoming Immunological Challenges to Helper-Dependent Adenoviral Vector-Mediated Long-Term CFTR Expression in Mouse Airways.
Fucoxanthin Ameliorates Atopic Dermatitis Symptoms by Regulating Keratinocytes and Regulatory Innate Lymphoid Cells.
Requirements for the differentiation of innate T-bethigh memory-phenotype CD4+ T lymphocytes under steady state.
Bacteroides fragilis polysaccharide A induces IL-10 secreting B and T cells that prevent viral encephalitis.
The Hematopoietic Oxidase NOX2 Regulates Self-Renewal of Leukemic Stem Cells.
Gaurav R, Mikuls TR, Thiele GM, Nelson AJ, Niu M, Guda C, Eudy JD, Barry AE, Wyatt TA, Romberger DJ, Duryee MJ, England BR, Poole JA
PloS one 2021;16(2):e0240707
PloS one 2021;16(2):e0240707
Hypoxia-induced miR-210 modulates the inflammatory response and fibrosis upon acute ischemia.
Zaccagnini G, Greco S, Longo M, Maimone B, Voellenkle C, Fuschi P, Carrara M, Creo P, Maselli D, Tirone M, Mazzone M, Gaetano C, Spinetti G, Martelli F
Cell death & disease 2021 May 1;12(5):435
Cell death & disease 2021 May 1;12(5):435
Monocyte-derived dendritic cells link localized secretory IgA deficiency to adaptive immune activation in COPD.
Richmond BW, Mansouri S, Serezani A, Novitskiy S, Blackburn JB, Du RH, Fuseini H, Gutor S, Han W, Schaff J, Vasiukov G, Xin MK, Newcomb DC, Jin L, Blackwell TS, Polosukhin VV
Mucosal immunology 2021 Mar;14(2):431-442
Mucosal immunology 2021 Mar;14(2):431-442
Murine myeloid cell MCPIP1 suppresses autoimmunity by regulating B-cell expansion and differentiation.
Dobosz E, Lorenz G, Ribeiro A, Würf V, Wadowska M, Kotlinowski J, Schmaderer C, Potempa J, Fu M, Koziel J, Lech M
Disease models & mechanisms 2021 Mar 18;14(3)
Disease models & mechanisms 2021 Mar 18;14(3)
Ibrutinib does not prevent kidney fibrosis following acute and chronic injury.
Belliere J, Casemayou A, Colliou E, El Hachem H, Kounde C, Piedrafita A, Feuillet G, Schanstra JP, Faguer S
Scientific reports 2021 Jun 7;11(1):11985
Scientific reports 2021 Jun 7;11(1):11985
Proteostasis in dendritic cells is controlled by the PERK signaling axis independently of ATF4.
Mendes A, Gigan JP, Rodriguez Rodrigues C, Choteau SA, Sanseau D, Barros D, Almeida C, Camosseto V, Chasson L, Paton AW, Paton JC, Argüello RJ, Lennon-Duménil AM, Gatti E, Pierre P
Life science alliance 2021 Feb;4(2)
Life science alliance 2021 Feb;4(2)
Myeloid Cell CK2 Regulates Inflammation and Resistance to Bacterial Infection.
Larson SR, Bortell N, Illies A, Crisler WJ, Matsuda JL, Lenz LL
Frontiers in immunology 2020;11:590266
Frontiers in immunology 2020;11:590266
Ischemia Reperfusion Injury Triggers CXCL13 Release and B-Cell Recruitment After Allogenic Kidney Transplantation.
Kreimann K, Jang MS, Rong S, Greite R, von Vietinghoff S, Schmitt R, Bräsen JH, Schiffer L, Gerstenberg J, Vijayan V, Dittrich-Breiholz O, Wang L, Karsten CM, Gwinner W, Haller H, Immenschuh S, Gueler F
Frontiers in immunology 2020;11:1204
Frontiers in immunology 2020;11:1204
Pituitary Adenylate Cyclase-Activating Polypeptide Alleviates Intestinal, Extra-Intestinal and Systemic Inflammatory Responses during Acute Campylobacter jejuni-induced Enterocolitis in Mice.
Heimesaat MM, Mousavi S, Kløve S, Genger C, Weschka D, Tamas A, Reglodi D, Bereswill S
Pathogens (Basel, Switzerland) 2020 Sep 30;9(10)
Pathogens (Basel, Switzerland) 2020 Sep 30;9(10)
The Host-Specific Intestinal Microbiota Composition Impacts Campylobacter coli Infection in a Clinical Mouse Model of Campylobacteriosis.
Heimesaat MM, Genger C, Klove S, Weschka D, Mousavi S, Bereswill S
Pathogens (Basel, Switzerland) 2020 Sep 29;9(10)
Pathogens (Basel, Switzerland) 2020 Sep 29;9(10)
The lysophospholipase D enzyme Gdpd3 is required to maintain chronic myelogenous leukaemia stem cells.
Naka K, Ochiai R, Matsubara E, Kondo C, Yang KM, Hoshii T, Araki M, Araki K, Sotomaru Y, Sasaki K, Mitani K, Kim DW, Ooshima A, Kim SJ
Nature communications 2020 Sep 17;11(1):4681
Nature communications 2020 Sep 17;11(1):4681
Toll-Like Receptor-4 Dependent Intestinal and Systemic Sequelae Following Peroral Campylobacter coli Infection of IL10 Deficient Mice Harboring a Human Gut Microbiota.
Kløve S, Genger C, Mousavi S, Weschka D, Bereswill S, Heimesaat MM
Pathogens (Basel, Switzerland) 2020 May 18;9(5)
Pathogens (Basel, Switzerland) 2020 May 18;9(5)
Overcoming Immunological Challenges to Helper-Dependent Adenoviral Vector-Mediated Long-Term CFTR Expression in Mouse Airways.
Cao H, Duan R, Hu J
Genes 2020 May 18;11(5)
Genes 2020 May 18;11(5)
Fucoxanthin Ameliorates Atopic Dermatitis Symptoms by Regulating Keratinocytes and Regulatory Innate Lymphoid Cells.
Natsume C, Aoki N, Aoyama T, Senda K, Matsui M, Ikegami A, Tanaka K, Azuma YT, Fujita T
International journal of molecular sciences 2020 Mar 22;21(6)
International journal of molecular sciences 2020 Mar 22;21(6)
Requirements for the differentiation of innate T-bethigh memory-phenotype CD4+ T lymphocytes under steady state.
Kawabe T, Yi J, Kawajiri A, Hilligan K, Fang D, Ishii N, Yamane H, Zhu J, Jankovic D, Kim KS, Trinchieri G, Sher A
Nature communications 2020 Jul 6;11(1):3366
Nature communications 2020 Jul 6;11(1):3366
Bacteroides fragilis polysaccharide A induces IL-10 secreting B and T cells that prevent viral encephalitis.
Ramakrishna C, Kujawski M, Chu H, Li L, Mazmanian SK, Cantin EM
Nature communications 2019 May 14;10(1):2153
Nature communications 2019 May 14;10(1):2153
The Hematopoietic Oxidase NOX2 Regulates Self-Renewal of Leukemic Stem Cells.
Adane B, Ye H, Khan N, Pei S, Minhajuddin M, Stevens BM, Jones CL, D'Alessandro A, Reisz JA, Zaberezhnyy V, Gasparetto M, Ho TC, Kelly KK, Myers JR, Ashton JM, Siegenthaler J, Kume T, Campbell EL, Pollyea DA, Becker MW, Jordan CT
Cell reports 2019 Apr 2;27(1):238-254.e6
Cell reports 2019 Apr 2;27(1):238-254.e6
No comments: Submit comment
Supportive validation
- Submitted by
- Invitrogen Antibodies (provider)
- Main image
- Experimental details
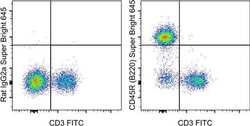
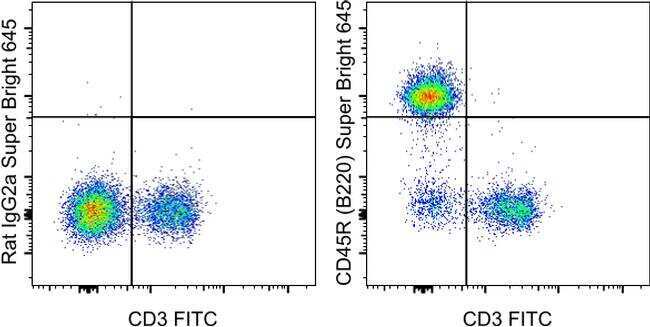
- Staining of C57Bl/6 splenocytes with Anti-Mouse CD3 FITC (Product # 11-0032-82) and 0.25 µg of Rat IgG2a K Isotype Control Super Bright 645 (Product # 64-4321-82) (left) or 0.25 µg of Anti-Human/Mouse CD45R (B220) Super Bright 645 (right). Total viable cells were used for analysis.
Supportive validation
- Submitted by
- Invitrogen Antibodies (provider)
- Main image

- Experimental details
- Fig. 1 Gdpd3 is implicated in CML disease initiation in vivo. a Diagram of pathways of lysophospholipid biosynthesis. G3P is converted into LPAs, and LPAs are then converted into phospholipids by the addition of polar bases via the Kennedy (de novo) pathway. The Lands'' cycle (remodelling pathway) generates lysophospholipids of distinct composition by substituting fatty acid ester and polar base groups of phospholipids. Lysophospholipase D Gdpd3 converts lysophospholipids back into LPAs by catalysing hydrolysis (magenta dotted line). (PC Phosphatidylcholine, PS Phosphatidylserine, PE Phosphatidylethanolamine, PI Phosphatidylinositol, LPC Lysophosphatidylcholine, LPS Lysophosphatidylserine, LPE Lysophosphatidylethanolamine, LPI Lysophosphatidylinositol). b qRT-PCR determination of Gdpd3 mRNA expression in LT-stem (LT), CD48, MPP, and LK cells (see Supplementary Fig.2) isolated from Gdpd3 +/+ tet-CML-affected (SCL-tTA + TRE-BCR-ABL1 + ) mice (one male, six females) or normal littermate (SCL-tTA + ) mice (four males, four females). Data are the mean ratio +- s.d. of transcript levels normalised to Actb ( n = 3 biologically independent samples) ( P -value, unpaired two-sided Student''s t -test). c Quantitation of the colony-forming capacity of Gdpd3 +/+ CML-LSK cells that were transduced with/without Cy3-labelled siRNA targetting mouse Gdpd3 mRNA (mGdpd3 siRNA #1 or #3). Cy3 + and Cy3 - CML-LSK cells were purified at 3 days post-transduction and plated in semi-solid methylcellulo

- Submitted by
- Invitrogen Antibodies (provider)
- Main image

- Experimental details
- Fig. 7 Lgr4/Gpr48 is involved in CML stem cell self-renewal in vivo. a RNA-Seq determinations of mRNA levels of the indicated GPCR family genes in LT-CML stem cells isolated from Gdpd3 +/+ tet-CML-affected mice (22 males, 12 females) and Gdpd3 -/- tet-CML-affected mice (five males, five females). Results are expressed as FPKM (see Methods). Data are the mean FPKM +- s.d. ( n = 3 biologically independent samples) ( P -value, unpaired two-sided Student''s t -test). Results of the MA-plot and GO term enrichment analyses for these RNA-Seq data are shown in Supplementary Fig. 11a, b . b Quantitation of the colony-forming capacity of Gdpd3 +/+ CML-LSK cells that were transduced with/without Cy3-labelled siRNA targetting mouse Lgr4/Gpr48 mRNA (mLgr4 #3 or Lgr4 #4). Cy3 + and Cy3 - CML-LSK cells were purified at 3 days post-transduction and plated in a semi-solid methylcellulose medium. Data are the mean colony number +- s.d. ( n = 3) and are representative of three biologically independent experiments. ( P -value compared with control, unpaired two-sided Student''s t -test). The relevant FACS data are shown in Supplementary Fig. 12 . c Absolute numbers of LT-CML stem cells isolated from BM of the two hind limbs of Lgr4 +/+ tet-CML-affected mice (four males, one female) and Lgr4 Gt/Gt tet-CML-affected mice (five females) ( n = 5 biologically independent samples). Data are the mean absolute numbers +- s.d. of LT-CML stem cells ( P -value, unpaired two-sided Student''s t -test). (See S

- Submitted by
- Invitrogen Antibodies (provider)
- Main image

- Experimental details
- Figure 7. NOX2 and FOXC1 Are Important for the Growth of Primary Human Myeloid Leukemia Cells (A) The Cancer Genome Atlas (TCGA) database for AML was used to analyze the expression levels of several NADPH-dependent oxidases (NOX1-NOX5), accessory subunits (NCF1, NCF2, NCF4, NOXA1, NOXO1, p22Phox, RAC1, and RAC2) as well as related oxido-reductase enzymes (dual-oxidases 1,2, A2). The reads per kilobase of transcript per million mapped reads (RPKM) values for each gene in a total of 188 AMLs are shown. (B) RNA-seq analysis was performed on functionally validated leukemic stem cells isolated from human primary AMLs. The RPKM value for each gene is shown. Unpublished data are used with permission. Additional supporting data are shown in Figure S7A . (C) Equal numbers of control or shNOX2-transduced primary AML cells were cultured in vitro in the presence of 10 ng/mL of IL-3, SCF, and FL3, and the relative percent expansion is reported for each specimen. n = 3, mean +- SD. *p < 0.05; **p < 0.01. (D) Control and shNOX2 primary AML cells were purified and cultured in vitro for 12 days. Annexin V, DAPI staining was performed to evaluate the degree of apoptotic cell death. A representative flow plot (left) and quantitation of 3 technical triplicates (right) are shown. Additional data are shown in Figure S7B . (E) The relative expression level of NOX2 , CEBP epsilon, Elane , and CTSG is shown in AML specimens in which NOX2 was knocked down using shRNAs. Additional supporting data are p

- Submitted by
- Invitrogen Antibodies (provider)
- Main image

- Experimental details
- Figure 6 The characterization of Il-2 producers regulated by FX and TAC. FX stimulated Il-2 production in CD45R + CD25 + ILCregs. Some Il-2 + CD45R + CD25 + ILCregs were observed in TAC treated skin and others were CD45R - CD25 - cells. The panel is focused on the dermis.

- Submitted by
- Invitrogen Antibodies (provider)
- Main image

- Experimental details
- Fig. 4. Macrophage-derived MCPIP1 regulates B-lymphocyte expansion in lymphoid organs. (A-D) Spleen sections were stained with anti-mouse IRF4, BLIMP1, CD95 and B220 antibodies and quantified by Adobe Photoshop software as percentage of positively stained high-power field (HPF) from eight mice per group; *** P

- Submitted by
- Invitrogen Antibodies (provider)
- Main image

- Experimental details
- Fig. 1 Ubiquitous miR-210 over-expression attenuates the inflammatory response after hindlimb ischemia. A Representative immunofluorescence staining for CD45 (green), a common leukocyte marker expressed in all nucleated hematopoietic cells, of gastrocnemius muscle sections of Wt and Tg-210 mice, 7 days after ischemia. Nuclei were stained by Hoechst (blue). Images are presented as merge. Magnification x400. Calibration bar 50 um. B Quantification of CD45-positive cells/mm 2 ( n = 5, test T * P < 0.03). C Representative immunofluorescence staining for F4/80 (green), a pan-macrophage marker, in gastrocnemius muscle sections of Wt, and Tg-210 mice, 7 days after ischemia. Nuclei were stained by Hoechst (Blue). Images are presented as merge. Magnification 63 x 0.5. Calibration bar 50 um. D Quantification of F4/80-positive macrophages/mm 2 ( n = 6-7, ** P < 0.009). In both A , C insets show magnification of the indicated areas.

- Submitted by
- Invitrogen Antibodies (provider)
- Main image

- Experimental details
- Figure 2. pIgR -/- mice spontaneously develop COPD-like lung pathology and adaptive immune activation. ( A ) Representative image of emphysema in an 18-month-old pIgR -/- and age-matched WT mouse (hematoxylin and eosin, scale bar = 50 mum). ( B ) Measurement of mean linear intercept (MLI), a morphometric measurement of emphysema, in WT and pIgR -/- mice at the indicated ages. ( C ) Representative image of small airway wall thickening in an 18-month-old pIgR -/- and age-matched WT mouse (Masson's trichrome, scale bar = 50 mum). ( D ) Measurement of VV airway , a morphometric measurement of small airway wall thickness, in WT and pIgR -/- mice at the indicated ages. ( E ) Example of a tertiary lymphoid structure (TLS) in an 18-month-old pIgR -/- mouse as indicated by immunostaining for B220. Scale bar = 50 mum. ( F ) Morphometric analysis of TLS area in lungs of WT or pIgR -/- mice at the indicated ages. ( G-J ) Quantification of total, CD45 + , CD19 + , CD3 + , CD4 + , and CD8 + cells in the lungs of 18-month-old WT and pIgR -/- mice by flow cytometry. ( B and D ) * = p

- Submitted by
- Invitrogen Antibodies (provider)
- Main image

- Experimental details
- Figure 6 Colonic innate and adaptive immune cell responses following peroral C. coli infection of human microbiota-associated TLR4-deficient IL10 -/- mice. IL10 -/- mice (open symbols) and TLR4-deficient IL10 -/- mice (TLR4 -/- IL10 -/- ; closed symbols) with a human gut microbiota were either perorally infected with C. coli (circles) or received vehicle (mock; diamonds) on days 0 and 1 by gavage. Upon necropsy on day 21 post-infection, the average counts of ( A ) macrophages and monocytes (F4/80 + ), ( B ) T lymphocytes (CD3 + ), ( C ) regulatory T cells (FOXP3+) and ( D ) B lymphocytes (B220+) were microscopically determined in six high power fields (HPF, 400 times magnification) per mouse in immunohistochemically stained colonic paraffin sections. Medians (black bars) and numbers of examined mice (in parentheses), as well as levels of significance ( p -values) determined by the one-way ANOVA test and Tukey's post-correction or the Kruskal-Wallis test and Dunn's post-correction, are shown. Data were pooled from three independent experiments.

- Submitted by
- Invitrogen Antibodies (provider)
- Main image

- Experimental details
- Figure 6 Serum CXCL13 levels in mouse ktx. Post ktx levels of serum CXCL13 at day 1 were significantly increased compared to baseline. A higher increase was observed in longer cold ischemia time (30 vs. 60 min cold ischemia time). Isogenic ktx with prolonged cold ischemia time of 60 min had significantly lower CXCL13 levels compared to allogenic ktx (A) . PAS stain at day 7 revealed enhanced cell infiltration in allogenic compared to isogenic ktx (B) . Double staining for CD3+ T-lymphocytes (green) and CD45R+ B-cells (red) was performed at day 7. More interstitial CD3+ T-lymphocytes were observed in allografts compared to isografts. Allografts exhibited scattered B-cells in interstitial tissue, but also clusters of CD45R+ cells. Isografts showed only few B cells in the interstitium at day 7 (B) (bar: 100 mum, n = 6 per group, one-way ANOVA * p < 0.05; ** p < 0.01; *** p < 0.001). BL, baseline.

- Submitted by
- Invitrogen Antibodies (provider)
- Main image

- Experimental details
- Figure 7 Colonic immune cell responses upon oral C. coli infection of microbiota-depleted IL-10 -/- mice that had been challenged with human or murine fecal microbiota transplantations. On days -7, -6, and -5, mice were subjected to murine (open symbols) or human (closed symbols) fecal microbiota transplantations and challenged with a C. coli patient isolate (circles) or vehicle as mock controls (diamonds) on days 0 and 1 by gavage. On day 21 post-infection, the average numbers of ( A ) macrophages and monocytes (F4/80+), ( B ) T lymphocytes (CD3+), ( C ) regulatory T cells (FOXP3+), and ( D ) B lymphocytes (B220+) were determined in the large intestinal mucosa and lamina propria out of 6 high-power fields (HPF, 400x magnification) per mouse. Medians (black bars), significance levels ( p -values calculated by the Kruskal-Wallis test and Dunn's post-correction), and total numbers of mice under investigation (in parentheses) are shown. Results from four experiments were pooled.

- Submitted by
- Invitrogen Antibodies (provider)
- Main image

- Experimental details
- Figure 5 Innate and adaptive immune cell responses in the colon following PACAP treatment of C. jejuni infected secondary abiotic IL-10 -/- mice. Mice were perorally infected with C. jejuni strain 81-176 by gavage on day (d) 0 and d1, and subjected to intraperitoneal treatment with either synthetic PACAP or vehicle (mock) from d2 until d5 post-infection. On d6 the average numbers of ( A ) macrophages and monocytes (F4/80 + ), ( B ) T lymphocytes (CD3 + ), ( C ) regulatory T cells (FOXP3 + ) and ( D ) B lymphocytes (B220 + ) were quantitated in six high power fields (HPF) of colonic paraffin sections applying immunohistochemistry. Naive mice were used as negative controls. Box plots indicate the 75th and 25th percentiles of the median (black bar within boxes). The total range, the significance levels ( p values calculated by the one-way ANOVA test followed by the Tukey post-correction test for multiple comparisons) and the total numbers of mice under investigation (in parentheses) are indicated. Results pooled from four independent experiments are shown.

- Submitted by
- Invitrogen Antibodies (provider)
- Main image

- Experimental details
- Figure 1 Ibrutinib promotes renal fibrosis after unilateral ureteric obstruction (UUO). ( A ) Design of the study. ( B - E ) Representatives images and quantifications of Fibronectin ( B ), Sirius Red ( C ), B220 ( D ) and F4/80 ( E ) staining in sham and UUO mice receiving ibrutinib (Ibru) or vehicle (Veh). Data are represented as means +- SEM. *p < 0.05 (Mann-Whitney test; n = 6 mice per group); ns, not significant.

- Submitted by
- Invitrogen Antibodies (provider)
- Main image

- Experimental details
- Figure 3 Ibrutinib promotes rhabdomyolysis-induced renal fibrosis. ( A ) Design of the study. ( B ) Kaplan-Meier survival curves after glycerol injection in mice receiving ibrutinib (Ibru) or vehicle (Veh) from day 3. ( C ) Blood urea nitrogen (BUN) 20 days after glycerol injection. ( D - G ) Representatives images and quantification of Sirius Red ( D ), Fibronectin ( E ), F4/80 ( F ) and B220 ( G ) staining 20 days after glycerol injection in mice receiving ibrutinib (Ibru) or vehicle (Veh) from day 3. Values are expressed as mean +- SEM. * p < 0.05, compared with the vehicle group (Mann-Whitney test, n = 5-10 mice); ns, not significant.

- Submitted by
- Invitrogen Antibodies (provider)
- Main image

- Experimental details
- Fig. 6 TLR2 + macrophages, pDCs, and PB in the small intestine bind PSA and induce IL-10 secretion. Gating strategy for mononuclear cells isolated from a duodenum (Duod) and b ileum (Ile) of WT and Rag mice analyzed for binding of fluorescent A488-conjugated PSA (left two plots). CD45 - intra-epithelial cells (CD45 - IEC: middle histogram) and CD45 + gated intra-epithelial leukocytes (CD45 + IEL: second right histogram) isolated from the a Duod and b Ile of WT (red) and Rag (blue) mice were analyzed for reactivity to PSA-A488. CD45 + CD11c - B220 + B cells, PDCA1 + B220 + CD11c + pDCs and CD138 + B220 + PB and B220 low PC isolated from a Duod and b Ile of WT mice were analyzed for PSA reactivity (right histogram). Flow cytometry plots show CD11c + PDCA1 - cDC, PDCA1 + B220 + pDC, and B220 + CD19 + B cells isolated from spleen, MLN, PP, IEL, or LP of WT mice were stimulated with c PSA or d LTA-SA (TLR2 agonist) and analyzed for IL-10 expression. e Plots summarize data from c and d and show % IL-10 + B cells (left), cDCs (middle), and pDCs (right) from spleen, MLN, PP, IEL, and LP stimulated with PSA or TLR2 (LTA-SA) ( n = 3 mice). All data show mean +- SEM

- Submitted by
- Invitrogen Antibodies (provider)
- Main image

- Experimental details
- Figure 4 Host humoral immune responses to vector delivery. ( a ) The titer of anti-adenoviral antibodies in mouse bronchoalveolar lavage fluid (BALF). The total anti-Ad antibodies (IgA, IgE, IgGs, IgM) were detected with ELISA in all groups. Data were presented as mean +- SD (standard deviation). ( b ) Neutralizing antibody in mouse BALF. n = 5, #: p < 0.05; **: p < 0.01. ( c ) B-cell presence in mouse lungs. B-cells were detected in mouse lungs with antibodies against B220 by immunohistochemistry staining. The positive cells are shown in brown color. ns, no significant difference.

- Submitted by
- Invitrogen Antibodies (provider)
- Main image

- Experimental details
- Figure 1 Development of myeloid cell populations is not detectably altered in MphCK2alpha -/- mice. (A) Schematic of Csnk2a targeting vector. (B) Immunoblots of lysates from BMDMs, splenocytes, or peritoneal cavity cells of LysM cre or LysM cre CK2alpha fl/fl (MphCK2alpha - / - ) mice were probed for CK2alpha or beta-actin as a loading control. n = 2. (C) Splenic myeloid cell populations were stained and analyzed by flow cytometry. Plots depict gating for representative F4/80+ macrophages, Ly6C+ monocytes, and neutrophils (also Ly6G+). (D) Cells from spleen were stained for flow cytometry to enumerate immune cell populations. Data are from pooled experiments, n = 4-12 mice/group. (E) Cells from bone marrow were stained for flow cytometry to evaluate bone marrow precursor populations including common myeloid progenitors (CMPs), granulocyte-monocyte progenitors (GMPs), and megakaryocyte-erythrocyte progenitor (MEP). Cells were pre-gated on Lin-(B220, CD3, CD11b, GR-1 and TER-119), Sca-1-, cKit-. Density plots are representative from two experiments.

- Submitted by
- Invitrogen Antibodies (provider)
- Main image

- Experimental details
- Figure 1. Steady-state Flt3-L BMDCs and splenic DCs display remarkably high levels of eIF2alpha without inhibition of translation. (A) Immunohistochemistry of mouse spleen with staining for CD11c (red) and p-eIF2alpha (green). Scale bar: 200 mum, magnification: 10x. Single color images are shown and merged picture (right row), high level of p-eIF2alpha staining is mostly found co-localizing in cells positive for CD11c+ (DCs, white arrowheads). (B) Immunohistochemistry of mouse spleen in the white pulp for CD11c (red), p-eIF2alpha (green), CD11b (blue), and B220 (turquoise). Scale bars: 50 mum, magnification: 40x. In the upper panel, magnified areas show p-eIF2 detection in cDC2 (CD11c+/CD11b+) and cDC1 (CD11c+/CD11b-). In the lower panel, magnified areas show p-eIF2 detection in pDCs (B220+/CD11c+) and in B cells (B220+ and CD11c-). (C) Relative p-eIF2alpha levels measured by flow in different mouse spleen populations. Statistical analysis was performed by Mann-Whitney test. ** P < 0.01. (D) Levels of p-eIF2alpha and total eIF2alpha were measured in DC populations by immunoblot. Sorted steady-state Flt3-L BMDCs were compared with MEFs and freshly isolated CD8alpha+ T cells stimulated or not with thapsigargin (Tg) for 2 h (200 nM). Ratio of p-eIF2alpha/eIF2alpha is quantified in the graph of the lower panel. (E) Levels of p-eIF2alpha and total eIF2alpha were measured in bulk Flt3-L BMDCs during different days of BM differentiation in vitro. (F) Levels of protein synthesis were

- Submitted by
- Invitrogen Antibodies (provider)
- Main image

- Experimental details
- Fig 1 Agriculture (swine) exposure-related Organic Dust Extract (ODE) induced airway inflammation coupled with Collagen Induced Arthritis (CIA) model. ( A ) Line graph depicts mean with SE bars of arthritis inflammatory score at respective time points from treatment groups. Statistical difference versus sham denoted as ""a"" (p
