Explore
 Validate
 Learn
Learn Flow cytometry
Antibody data
- Antibody Data
- Antigen structure
- References [1]
- Comments [0]
- Validations
- Flow cytometry [1]
- Other assay [1]
Submit
Validation data
Reference
Comment
Report error
- Product number
- 64-0457-41 - Provider product page

- Provider
- Invitrogen Antibodies
- Product name
- CD45RO Monoclonal Antibody (UCHL1), Super Bright™ 645, eBioscience™
- Antibody type
- Monoclonal
- Antigen
- Other
- Description
- Description: The UCHL1 monoclonal antibody reacts with human CD45RO, a 180 kDa isoform of CD45. CD45RO is expressed by most thymocytes, activated memory T cells, granulocytes and monocytes. CD22 is a ligand for CD45RO. Expression of CD45RO and CD45RA is used commonly to discriminate subsets of peripheral T cells. Applications Reported: This UCHL1 antibody has been reported for use in flow cytometric analysis. Applications Tested: This UCHL1 antibody has been pre-titrated and tested by flow cytometric analysis of normal human peripheral blood cells. This can be used at 5 µL (0.5 µg) per test. A test is defined as the amount (µg) of antibody that will stain a cell sample in a final volume of 100 µL. Cell number should be determined empirically but can range from 10^5 to 10^8 cells/test. Super Bright 645 is a tandem dye that can be excited with the violet laser line (405 nm) and emits at 645 nm. We recommend using a 660/20 bandpass filter. Please make sure that your instrument is capable of detecting this fluorochrome. When using two or more Super Bright dye-conjugated antibodies in a staining panel, it is recommended to use Super Bright Complete Staining Buffer (Product # SB-4401) to minimize any non-specific polymer interactions. Please refer to the datasheet for Super Bright Staining Buffer for more information. Light sensitivity: This tandem dye is sensitive to photo-induced oxidation. Protect this vial and stained samples from light. Fixation: Samples can be stored in IC Fixation Buffer (Product # 00-8222) (100 µL of cell sample + 100 µL of IC Fixation Buffer) or 1-step Fix/Lyse Solution (Product # 00-5333) for up to 3 days in the dark at 4°C with minimal impact on brightness and FRET efficiency/compensation. Some generalizations regarding fluorophore performance after fixation can be made, but clone specific performance should be determined empirically. Excitation: 405 nm; Emission: 645 nm; Laser: Violet Laser Super Bright Polymer Dyes are sold under license from Becton, Dickinson and Company.
- Reactivity
- Human
- Host
- Mouse
- Isotype
- IgG
- Antibody clone number
- UCHL1
- Vial size
- 25 Tests
- Concentration
- 5 µL/Test
- Storage
- 4° C, store in dark, DO NOT FREEZE!
Submitted references Longitudinal analysis of subtype C envelope tropism for memory CD4(+) T cell subsets over the first 3 years of untreated HIV-1 infection.
Gartner MJ, Gorry PR, Tumpach C, Zhou J, Dantanarayana A, Chang JJ, Angelovich TA, Ellenberg P, Laumaea AE, Nonyane M, Moore PL, Lewin SR, Churchill MJ, Flynn JK, Roche M
Retrovirology 2020 Aug 6;17(1):24
Retrovirology 2020 Aug 6;17(1):24
No comments: Submit comment
Supportive validation
- Submitted by
- Invitrogen Antibodies (provider)
- Main image

- Experimental details
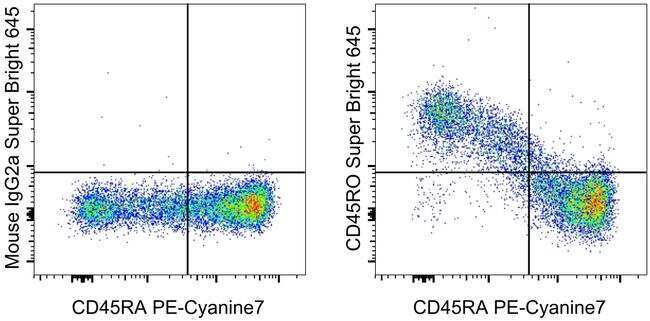
- Staining of normal human peripheral blood cells with Anti-Human CD45RA PE-Cyanine7 (Product # 25-0458-42) and Mouse IgG2a K Isotype Control Super Bright 645 (Product # 64-4724-82) (left) or Anti-Human CD45RO Super Bright 645 (right). Cells in the lymphocyte gate were used for analysis.
Supportive validation
- Submitted by
- Invitrogen Antibodies (provider)
- Main image
- Experimental details
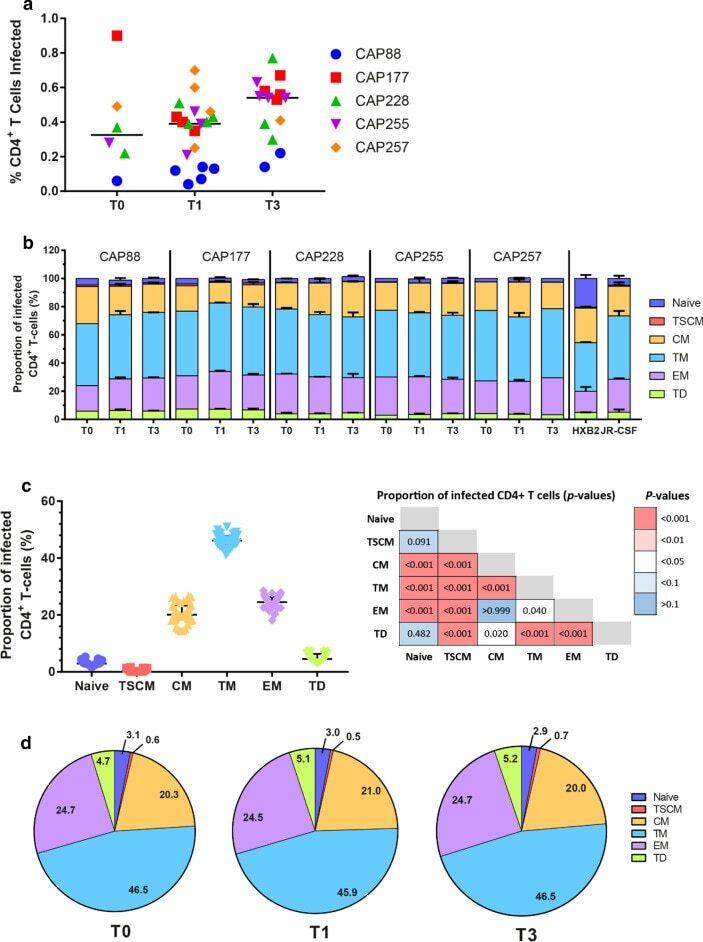
- Fig. 3 Transitional memory and effector memory cells were most frequently infected by C-HIV Envs. a Each data point represents the percentage of infected CD4 + T cells with one pseudovirus (averaged from four independent seronegative blood bank donors). The Env donor is indicated as follows; CAP88 (blue circles), CAP177 (red squares), CAP228 (green triangles), CAP255 (purple inverted triangles) and CAP257 (orange diamonds). Black lines represents the median of all pseudoviruses within each time point. Comparisons were made using a Kruskal-Wallis test with Dunn's post hoc test for multiple comparisons. b Stacked bar graphs represent the contribution of each T cell subset to the pool of infected CD4 + T cells. Values represent the median percentage of infected CD4 + T-cells (averaged across four HIV-seronegative PBMC donors) that belong to the indicated subset [naive; dark blue, T stem cell memory (TSCM); red, central memory (CM); yellow, transitional memory (TM); light blue, effector memory (EM); purple and terminally differentiated (TD); green], and are stratified by participant and time point. Error bars represent the interquartile range. c Dot plot representing the proportion of each T cell subset contributing to the total pool of infected cells for all Env-pseudoviruses. Each point represents a single virus averaged across four seronegative donors, lines represent median and error bars represent interquartile range. Comparisons were made using a Kruskal-Wallis test with Du