Explore
 Validate
 Learn
Learn Flow cytometry
Antibody data
- Antibody Data
- Antigen structure
- References [5]
- Comments [0]
- Validations
- Flow cytometry [1]
- Other assay [6]
Submit
Validation data
Reference
Comment
Report error
- Product number
- 69-0458-41 - Provider product page

- Provider
- Invitrogen Antibodies
- Product name
- CD45RA Monoclonal Antibody (HI100), eFluor™ 506, eBioscience™
- Antibody type
- Monoclonal
- Antigen
- Other
- Description
- Description: The HI100 monoclonal antibody reacts with human CD45RA, a 220 kDa molecule expressed by subpopulations of CD4+ peripheral T lymphocytes, CD8+ peripheral T lymphocytes, and B cells. The CD45RA+ T cell populations are mainly naive/virgin allowing the use of HI100 mAb as a phenotypic marker to discriminate T cell subsets. Applications Reported: This HI100 antibody has been reported for use in flow cytometric analysis. Applications Tested: This HI100 antibody has been pre-titrated and tested by flow cytometric analysis of normal human peripheral blood cells. This can be used at 5 µL (0.5 µg) per test. A test is defined as the amount (µg) of antibody that will stain a cell sample in a final volume of 100 µL. Cell number should be determined empirically but can range from 10^5 to 10^8 cells/test. eFluor® 506 can be excited with the violet laser line (405 nm) and emits at 506 nm. We recommend using a 510/20 band pass filter, or equivalent. Please make sure that your instrument is capable of detecting this fluorochrome. Excitation: 405 nm; Emission: 506 nm; Laser: Violet Laser. Filtration: 0.2 µm post-manufacturing filtered.
- Reactivity
- Human
- Host
- Mouse
- Isotype
- IgG
- Antibody clone number
- HI100
- Vial size
- 25 Tests
- Concentration
- 5 µL/Test
- Storage
- 4° C, store in dark, DO NOT FREEZE!
Submitted references MicroRNA‑155 inhibits the proliferation of CD8+ T cells via upregulating regulatory T cells in vitiligo.
Targeting enhancer switching overcomes non-genetic drug resistance in acute myeloid leukaemia.
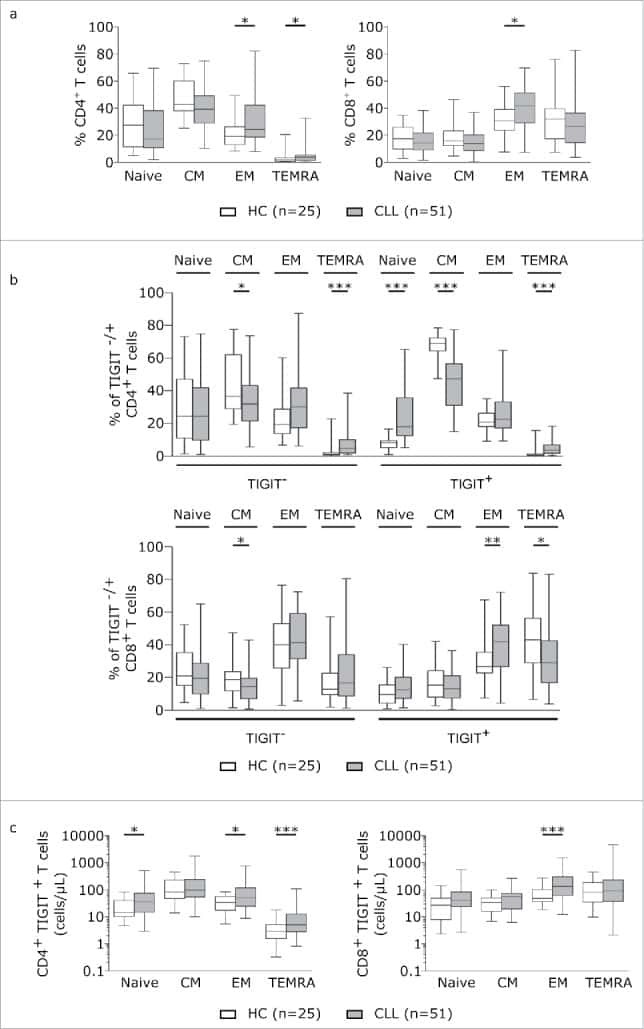
TIGIT expressing CD4+T cells represent a tumor-supportive T cell subset in chronic lymphocytic leukemia.
Targeting a CAR to the TRAC locus with CRISPR/Cas9 enhances tumour rejection.
The distribution and function of human memory T cell subsets in lung cancer.
Lv M, Li Z, Liu J, Lin F, Zhang Q, Li Z, Wang Y, Wang K, Xu Y
Molecular medicine reports 2019 Oct;20(4):3617-3624
Molecular medicine reports 2019 Oct;20(4):3617-3624
Targeting enhancer switching overcomes non-genetic drug resistance in acute myeloid leukaemia.
Bell CC, Fennell KA, Chan YC, Rambow F, Yeung MM, Vassiliadis D, Lara L, Yeh P, Martelotto LG, Rogiers A, Kremer BE, Barbash O, Mohammad HP, Johanson TM, Burr ML, Dhar A, Karpinich N, Tian L, Tyler DS, MacPherson L, Shi J, Pinnawala N, Yew Fong C, Papenfuss AT, Grimmond SM, Dawson SJ, Allan RS, Kruger RG, Vakoc CR, Goode DL, Naik SH, Gilan O, Lam EYN, Marine JC, Prinjha RK, Dawson MA
Nature communications 2019 Jun 20;10(1):2723
Nature communications 2019 Jun 20;10(1):2723
TIGIT expressing CD4+T cells represent a tumor-supportive T cell subset in chronic lymphocytic leukemia.
Catakovic K, Gassner FJ, Ratswohl C, Zaborsky N, Rebhandl S, Schubert M, Steiner M, Gutjahr JC, Pleyer L, Egle A, Hartmann TN, Greil R, Geisberger R
Oncoimmunology 2017;7(1):e1371399
Oncoimmunology 2017;7(1):e1371399
Targeting a CAR to the TRAC locus with CRISPR/Cas9 enhances tumour rejection.
Eyquem J, Mansilla-Soto J, Giavridis T, van der Stegen SJ, Hamieh M, Cunanan KM, Odak A, Gönen M, Sadelain M
Nature 2017 Mar 2;543(7643):113-117
Nature 2017 Mar 2;543(7643):113-117
The distribution and function of human memory T cell subsets in lung cancer.
Sheng SY, Gu Y, Lu CG, Zou JY, Hong H, Wang R
Immunologic research 2017 Jun;65(3):639-650
Immunologic research 2017 Jun;65(3):639-650
No comments: Submit comment
Supportive validation
- Submitted by
- Invitrogen Antibodies (provider)
- Main image

- Experimental details
- Staining of normal human peripheral blood cells with Anti-Human CD45RO APC (Product # 17-0457-42) and Anti-Human CD45RA eFluor® 506. Cells in the lymphocyte gate were used for analysis.

Supportive validation
- Submitted by
- Invitrogen Antibodies (provider)
- Main image
- Experimental details
- NULL

- Submitted by
- Invitrogen Antibodies (provider)
- Main image

- Experimental details
- NULL
- Submitted by
- Invitrogen Antibodies (provider)
- Main image
- Experimental details
- NULL
- Submitted by
- Invitrogen Antibodies (provider)
- Main image
- Experimental details
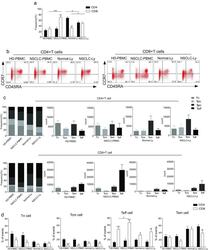
- Fig. 1 The distribution of CD4+ and CD8+ T cells subsets in human lung cancer. PBMCs were isolated from the blood of lung cancer patients and healthy donors and analyzed by flow cytometry. a The frequency of the CD3+CD4+ T cells and CD3+CD8+ T cells in the HD-PBMC, PBMCs from healthy donors; NSCLC-PBMC, PBMCs from non-small lung cancer patients, Normal-Ly, from healthy lymph node, NSCLC-Ly, tumor infiltrated lymph node from non-small lung cancer patients. b Representative flow cytometric analyses of CD45RA and CCR7 expression in CD3+CD4+ T cells and CD3+CD8+ T cells, indicating naive T cells (CD45RA+/CD45RO-CCR7+, top right quadrant ), terminal effector T cells (CD45RA+/CD45RO-CCR7-, bottom right quadrant ), central memory T cells (Tcm, CD45RO+/CD45RA-CCR7+, top left quadrant ), and effector memory T cells (Tem, CD45RO+/CD45RA-CCR7-, bottom left quadrant ), gated on the forward and side scatter of the lymphocyte populations. c The frequency and absolute number of the CD4+ ( top ) and CD8+ ( bottom ), Tn ( middle gray ), Teff ( black ), Tcm ( grey ), and Tem ( dark grey ) cell subsets in the blood from the non small cell lung cancer patients and healthy donors. d The events of Tn, Teff, Tcm and Tem cell subsets of CD4+ and CD8+ cells in the blood from non small cell lung cancer patients and healthy donors, expressed as the mean +- SEM. * p < 0.05; ** p < 0.005; *** p < 0.001; Mann-Whitney test (two-tailed) and non-paired Student's t-test
- Submitted by
- Invitrogen Antibodies (provider)
- Main image
- Experimental details
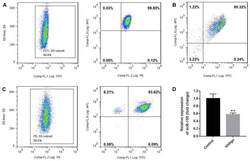
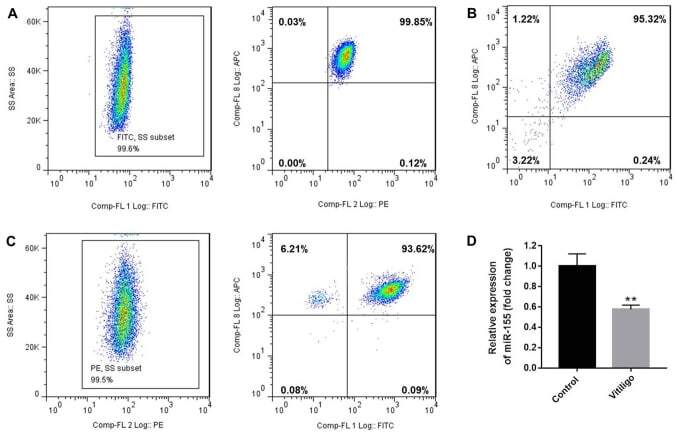
- Figure 1. Purity of CD3 + CD4 + CD45RA + T cells, CD3 + CD8 + T cells and CD4 + CD25 + FoxP3 + Treg cells. CD3 + CD4 + CD45RA + T cells and CD3 + CD8 + T cells were purified by magnetic cell sorting, and their purity was determined by flow cytometry. (A) The purity of CD3 + CD4 + CD45RA + T cells was 99.45% (CD3 + T cells, 99.6%; CD4 + CD45RA + T cells, 99.85%). (B) The purity of CD3 + CD8 + T cells was 95.32%. (C) The purity of CD4 + CD25 + FoxP3 + Treg cells was 93.15% (CD4 + T cells, 99.5%; CD25 + FoxP3 + T cells, 93.62%). (D) miR-155 expression in T cells of the patients with vitiligo and healthy donor was detected by reverse transcription quantitative polymerase chain reaction. **P
- Submitted by
- Invitrogen Antibodies (provider)
- Main image
- Experimental details
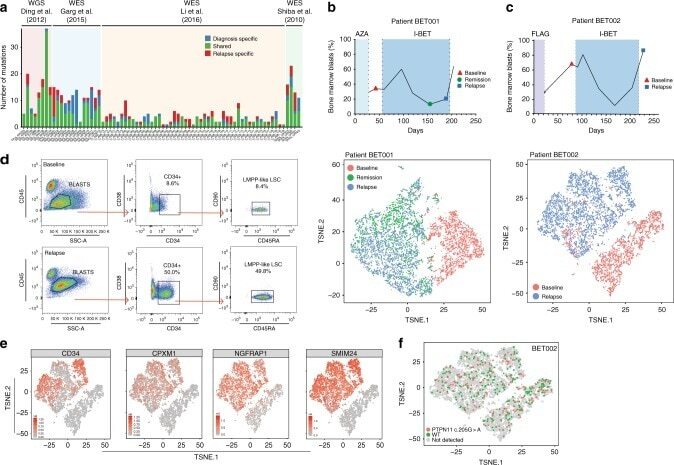
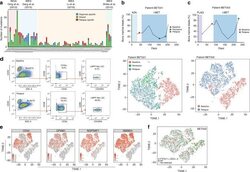
- Fig. 1 Non-genetic adaptation drives clinical resistance in AML. a Meta-analysis from four independent studies analysing either the whole genome or whole exome of AML patients at diagnosis and relapse. Mutations are defined as non-synonymous changes within the coding sequence of any gene. Shared mutations are mutations present at both diagnosis and relapse. Whole exome sequencing data from Li et al. (REF 4 ) was analysed to access the mutations in known AML genes, as defined by the authors. b Schematic of the treatment regime and bone marrow blast percentage for patient BET001 over the clinical trial treatment course (top panel). t-SNE analysis of 7360 individual blast cells isolated from patient BET001 at baseline, remission and relapse (bottom panel). scRNA-seq and genomic DNA sampling points are highlighted on the schematic. c Schematic of treatment regime and bone marrow blast percentage for patient BET002 over the clinical trial treatment course (top panel). t-SNE analysis of 6349 single blast cells isolated from patient BET002 at baseline and relapse (bottom panel). scRNA-seq and genomic DNA sampling points are highlighted on the schematic. d Flow cytometry analysis of cells from patient BET002 at baseline and relapse identifies enrichment for LMPP-like LSCs at relapse based on CD34 + CD38-CD90-CD45RA + expression. Gating strategy is defined by boxes. e Expression analysis of selected LSC signature genes (defined in REF 15 ) in blast cells from patient BET00