Explore
 Validate
 Learn
Learn Immunohistochemistry
Antibody data
- Antibody Data
- Antigen structure
- References [35]
- Comments [0]
- Validations
- Immunohistochemistry [1]
- Other assay [36]
Submit
Validation data
Reference
Comment
Report error
- Product number
- 42-0452-82 - Provider product page

- Provider
- Invitrogen Antibodies
- Product name
- CD45R (B220) Monoclonal Antibody (RA3-6B2), eFluor™ 615, eBioscience™
- Antibody type
- Monoclonal
- Antigen
- Other
- Description
- Description: The RA3-6B2 monoclonal antibody reacts with exon A-restricted isoform of mouse CD45, a 220 kDa surface molecule. CD45R/B220 epitope is mainly expressed by the B cell lineage from early Pro-B to mature B cells. However, some activated T cells, lymphokine activated killer cells (LAK), NK cell progenitors in the bone marrow, and T cells of the lpr/lpr mutant mouse also express this antigen. Applications Reported: This RA3-6B2 antibody has been reported for use in immunohistochemical staining of frozen tissue sections (IHC-F), and immunocytochemistry. Applications Tested: This RA3-6B2 antibody has been tested by immunohistochemistry on frozen mouse spleen at less than or equal to 1 µg/mL. It is recommended that this antibody be carefully titrated for optimal performance in the assay of interest. This product has not been validated for flow cytometric analysis. Filter Recommendation: When using this eFluor® 615 antibody conjugate, we recommend a filter that will capture the 615 emission wavelength (for example, Excitation 560/55, 585LP, Emission 645/75). A standard Alexa Fluor® 594 filter is acceptable. Excitation: 595 nm; Emission: 615 nm. Filtration: 0.2 µm post-manufacturing filtered.
- Reactivity
- Human, Mouse
- Host
- Rat
- Isotype
- IgG
- Antibody clone number
- RA3-6B2
- Vial size
- 100 µg
- Concentration
- 0.2 mg/mL
- Storage
- 4° C, store in dark, DO NOT FREEZE!
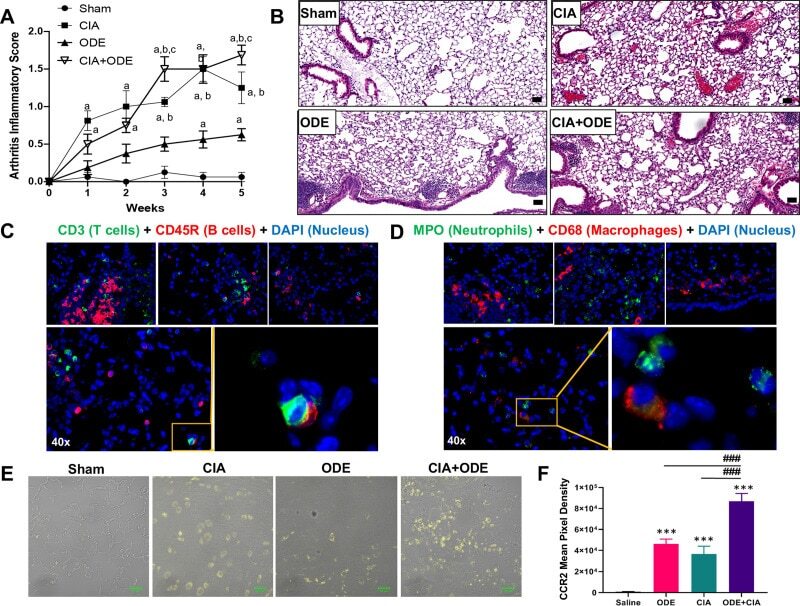
Submitted references High-throughput analysis of lung immune cells in a combined murine model of agriculture dust-triggered airway inflammation with rheumatoid arthritis.
Role of CXCL5 in Regulating Chemotaxis of Innate and Adaptive Leukocytes in Infected Lungs Upon Pulmonary Influenza Infection.
Targeting Ovarian Carcinoma with TSP-1:CD47 Antagonist TAX2 Activates Anti-Tumor Immunity.
Hypoxia-induced miR-210 modulates the inflammatory response and fibrosis upon acute ischemia.
Monocyte-derived dendritic cells link localized secretory IgA deficiency to adaptive immune activation in COPD.
Murine myeloid cell MCPIP1 suppresses autoimmunity by regulating B-cell expansion and differentiation.
Ibrutinib does not prevent kidney fibrosis following acute and chronic injury.
Proteostasis in dendritic cells is controlled by the PERK signaling axis independently of ATF4.
Histone deacetylase 3 represses cholesterol efflux during CD4(+) T-cell activation.
Ischemia Reperfusion Injury Triggers CXCL13 Release and B-Cell Recruitment After Allogenic Kidney Transplantation.
Pituitary Adenylate Cyclase-Activating Polypeptide Alleviates Intestinal, Extra-Intestinal and Systemic Inflammatory Responses during Acute Campylobacter jejuni-induced Enterocolitis in Mice.
The Host-Specific Intestinal Microbiota Composition Impacts Campylobacter coli Infection in a Clinical Mouse Model of Campylobacteriosis.
Toll-Like Receptor-4 Dependent Intestinal and Systemic Sequelae Following Peroral Campylobacter coli Infection of IL10 Deficient Mice Harboring a Human Gut Microbiota.
Overcoming Immunological Challenges to Helper-Dependent Adenoviral Vector-Mediated Long-Term CFTR Expression in Mouse Airways.
Fucoxanthin Ameliorates Atopic Dermatitis Symptoms by Regulating Keratinocytes and Regulatory Innate Lymphoid Cells.
Anti-commensal IgG Drives Intestinal Inflammation and Type 17 Immunity in Ulcerative Colitis.
Microbial symbionts regulate the primary Ig repertoire.
Anti-inflammatory Effects of the Octapeptide NAP in Human Microbiota-Associated Mice Suffering from Subacute Ileitis.
Oxysterol Sensing through the Receptor GPR183 Promotes the Lymphoid-Tissue-Inducing Function of Innate Lymphoid Cells and Colonic Inflammation.
Epithelial Fli1 deficiency drives systemic autoimmunity and fibrosis: Possible roles in scleroderma.
Combined antiangiogenic and anti-PD-L1 therapy stimulates tumor immunity through HEV formation.
Bmp signaling in colonic mesenchyme regulates stromal microenvironment and protects from polyposis initiation.
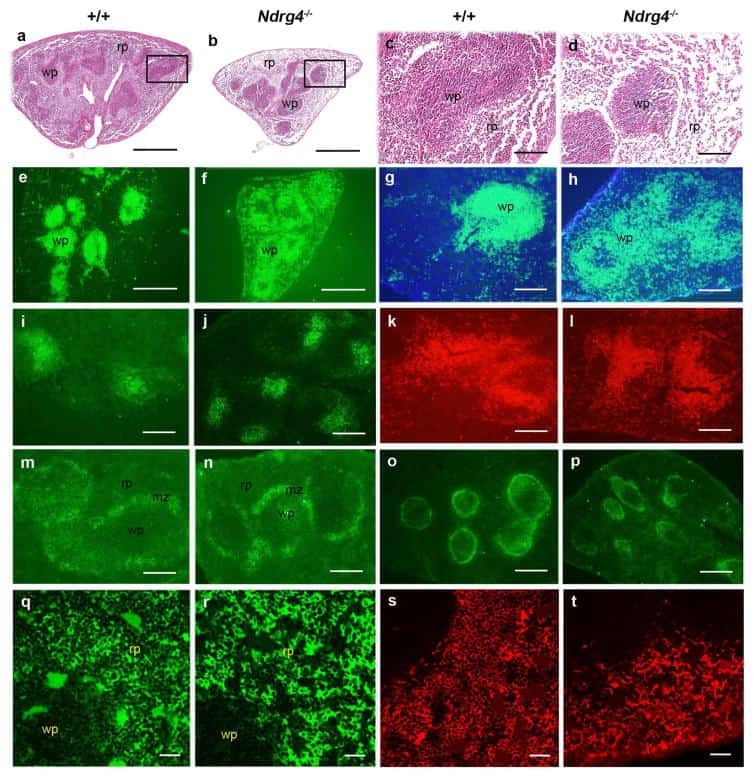
Postnatal lethality and abnormal development of foregut and spleen in Ndrg4 mutant mice.
The immunosenescence-related gene Zizimin2 is associated with early bone marrow B cell development and marginal zone B cell formation.
Limited miR-17-92 overexpression drives hematologic malignancies.
Comparison of tamoxifen and letrozole response in mammary preneoplasia of ER and aromatase overexpressing mice defines an immune-associated gene signature linked to tamoxifen resistance.
MHC-mismatched mixed chimerism augments thymic regulatory T-cell production and prevents relapse of EAE in mice.
B-cell-intrinsic hepatitis C virus expression leads to B-cell-lymphomagenesis and induction of NF-κB signalling.
A component of the mir-17-92 polycistronic oncomir promotes oncogene-dependent apoptosis.
Neuronal and nonneuronal cholinergic structures in the mouse gastrointestinal tract and spleen.
Natural IgG antibodies provide innate protection against ficolin-opsonized bacteria.
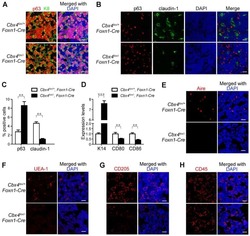
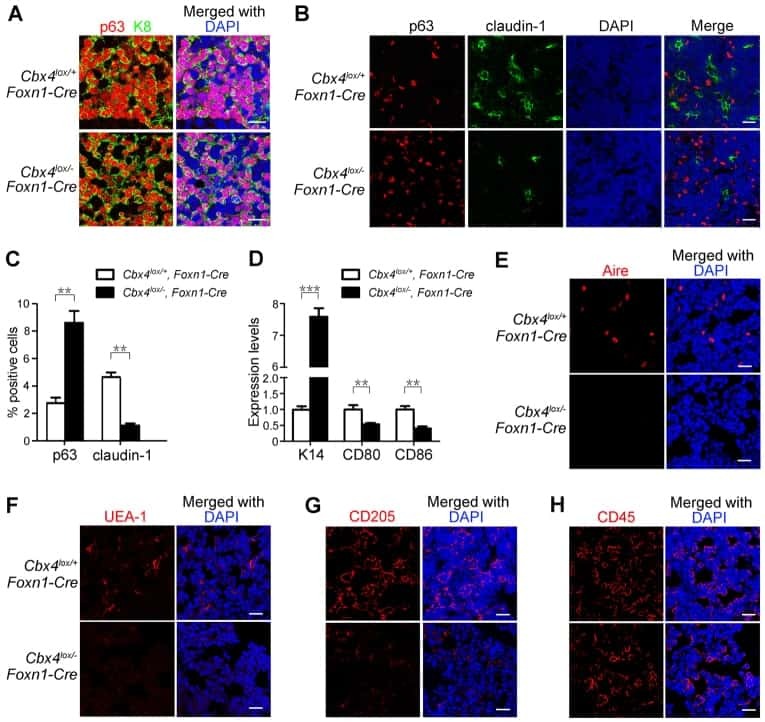
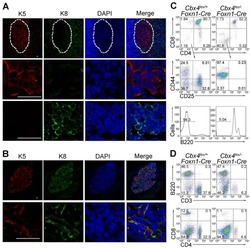
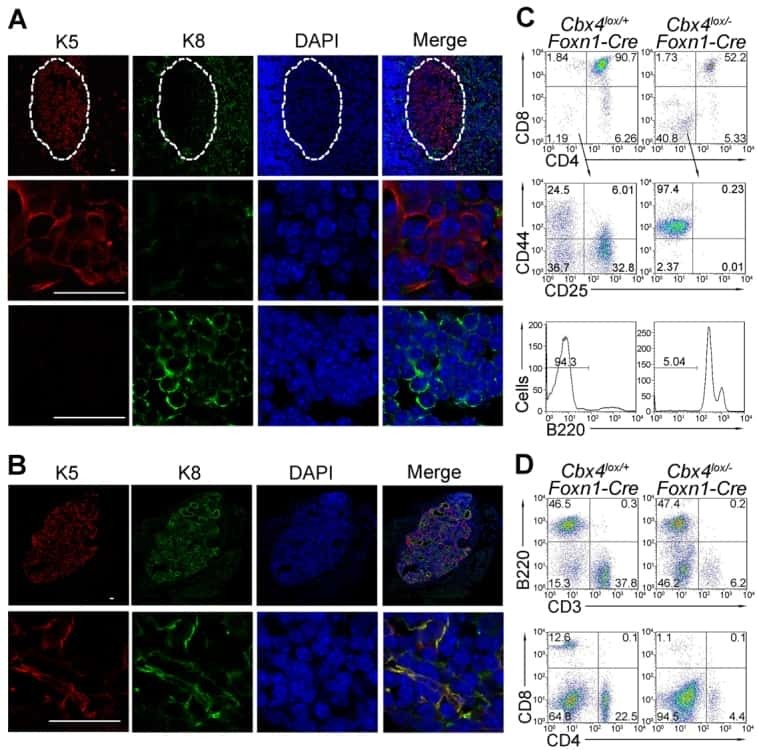
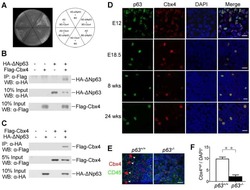
Cbx4 regulates the proliferation of thymic epithelial cells and thymus function.
Nuclear export of the NF-κB inhibitor IκBα is required for proper B cell and secondary lymphoid tissue formation.
A role for brain-derived neurotrophic factor in B cell development.
Identification of monoclonal antibodies for immunohistochemical staining of feline B lymphocytes in frozen and formalin-fixed paraffin-embedded tissues.
Gaurav R, Mikuls TR, Thiele GM, Nelson AJ, Niu M, Guda C, Eudy JD, Barry AE, Wyatt TA, Romberger DJ, Duryee MJ, England BR, Poole JA
PloS one 2021;16(2):e0240707
PloS one 2021;16(2):e0240707
Role of CXCL5 in Regulating Chemotaxis of Innate and Adaptive Leukocytes in Infected Lungs Upon Pulmonary Influenza Infection.
Guo L, Li N, Yang Z, Li H, Zheng H, Yang J, Chen Y, Zhao X, Mei J, Shi H, Worthen GS, Liu L
Frontiers in immunology 2021;12:785457
Frontiers in immunology 2021;12:785457
Targeting Ovarian Carcinoma with TSP-1:CD47 Antagonist TAX2 Activates Anti-Tumor Immunity.
Jeanne A, Sarazin T, Charlé M, Moali C, Fichel C, Boulagnon-Rombi C, Callewaert M, Andry MC, Diesis E, Delolme F, Rioult D, Dedieu S
Cancers 2021 Oct 7;13(19)
Cancers 2021 Oct 7;13(19)
Hypoxia-induced miR-210 modulates the inflammatory response and fibrosis upon acute ischemia.
Zaccagnini G, Greco S, Longo M, Maimone B, Voellenkle C, Fuschi P, Carrara M, Creo P, Maselli D, Tirone M, Mazzone M, Gaetano C, Spinetti G, Martelli F
Cell death & disease 2021 May 1;12(5):435
Cell death & disease 2021 May 1;12(5):435
Monocyte-derived dendritic cells link localized secretory IgA deficiency to adaptive immune activation in COPD.
Richmond BW, Mansouri S, Serezani A, Novitskiy S, Blackburn JB, Du RH, Fuseini H, Gutor S, Han W, Schaff J, Vasiukov G, Xin MK, Newcomb DC, Jin L, Blackwell TS, Polosukhin VV
Mucosal immunology 2021 Mar;14(2):431-442
Mucosal immunology 2021 Mar;14(2):431-442
Murine myeloid cell MCPIP1 suppresses autoimmunity by regulating B-cell expansion and differentiation.
Dobosz E, Lorenz G, Ribeiro A, Würf V, Wadowska M, Kotlinowski J, Schmaderer C, Potempa J, Fu M, Koziel J, Lech M
Disease models & mechanisms 2021 Mar 18;14(3)
Disease models & mechanisms 2021 Mar 18;14(3)
Ibrutinib does not prevent kidney fibrosis following acute and chronic injury.
Belliere J, Casemayou A, Colliou E, El Hachem H, Kounde C, Piedrafita A, Feuillet G, Schanstra JP, Faguer S
Scientific reports 2021 Jun 7;11(1):11985
Scientific reports 2021 Jun 7;11(1):11985
Proteostasis in dendritic cells is controlled by the PERK signaling axis independently of ATF4.
Mendes A, Gigan JP, Rodriguez Rodrigues C, Choteau SA, Sanseau D, Barros D, Almeida C, Camosseto V, Chasson L, Paton AW, Paton JC, Argüello RJ, Lennon-Duménil AM, Gatti E, Pierre P
Life science alliance 2021 Feb;4(2)
Life science alliance 2021 Feb;4(2)
Histone deacetylase 3 represses cholesterol efflux during CD4(+) T-cell activation.
Wilfahrt D, Philips RL, Lama J, Kizerwetter M, Shapiro MJ, McCue SA, Kennedy MM, Rajcula MJ, Zeng H, Shapiro VS
eLife 2021 Dec 2;10
eLife 2021 Dec 2;10
Ischemia Reperfusion Injury Triggers CXCL13 Release and B-Cell Recruitment After Allogenic Kidney Transplantation.
Kreimann K, Jang MS, Rong S, Greite R, von Vietinghoff S, Schmitt R, Bräsen JH, Schiffer L, Gerstenberg J, Vijayan V, Dittrich-Breiholz O, Wang L, Karsten CM, Gwinner W, Haller H, Immenschuh S, Gueler F
Frontiers in immunology 2020;11:1204
Frontiers in immunology 2020;11:1204
Pituitary Adenylate Cyclase-Activating Polypeptide Alleviates Intestinal, Extra-Intestinal and Systemic Inflammatory Responses during Acute Campylobacter jejuni-induced Enterocolitis in Mice.
Heimesaat MM, Mousavi S, Kløve S, Genger C, Weschka D, Tamas A, Reglodi D, Bereswill S
Pathogens (Basel, Switzerland) 2020 Sep 30;9(10)
Pathogens (Basel, Switzerland) 2020 Sep 30;9(10)
The Host-Specific Intestinal Microbiota Composition Impacts Campylobacter coli Infection in a Clinical Mouse Model of Campylobacteriosis.
Heimesaat MM, Genger C, Klove S, Weschka D, Mousavi S, Bereswill S
Pathogens (Basel, Switzerland) 2020 Sep 29;9(10)
Pathogens (Basel, Switzerland) 2020 Sep 29;9(10)
Toll-Like Receptor-4 Dependent Intestinal and Systemic Sequelae Following Peroral Campylobacter coli Infection of IL10 Deficient Mice Harboring a Human Gut Microbiota.
Kløve S, Genger C, Mousavi S, Weschka D, Bereswill S, Heimesaat MM
Pathogens (Basel, Switzerland) 2020 May 18;9(5)
Pathogens (Basel, Switzerland) 2020 May 18;9(5)
Overcoming Immunological Challenges to Helper-Dependent Adenoviral Vector-Mediated Long-Term CFTR Expression in Mouse Airways.
Cao H, Duan R, Hu J
Genes 2020 May 18;11(5)
Genes 2020 May 18;11(5)
Fucoxanthin Ameliorates Atopic Dermatitis Symptoms by Regulating Keratinocytes and Regulatory Innate Lymphoid Cells.
Natsume C, Aoki N, Aoyama T, Senda K, Matsui M, Ikegami A, Tanaka K, Azuma YT, Fujita T
International journal of molecular sciences 2020 Mar 22;21(6)
International journal of molecular sciences 2020 Mar 22;21(6)
Anti-commensal IgG Drives Intestinal Inflammation and Type 17 Immunity in Ulcerative Colitis.
Castro-Dopico T, Dennison TW, Ferdinand JR, Mathews RJ, Fleming A, Clift D, Stewart BJ, Jing C, Strongili K, Labzin LI, Monk EJM, Saeb-Parsy K, Bryant CE, Clare S, Parkes M, Clatworthy MR
Immunity 2019 Apr 16;50(4):1099-1114.e10
Immunity 2019 Apr 16;50(4):1099-1114.e10
Microbial symbionts regulate the primary Ig repertoire.
Chen Y, Chaudhary N, Yang N, Granato A, Turner JA, Howard SL, Devereaux C, Zuo T, Shrestha A, Goel RR, Neuberg D, Wesemann DR
The Journal of experimental medicine 2018 May 7;215(5):1397-1415
The Journal of experimental medicine 2018 May 7;215(5):1397-1415
Anti-inflammatory Effects of the Octapeptide NAP in Human Microbiota-Associated Mice Suffering from Subacute Ileitis.
Escher U, Giladi E, Dunay IR, Bereswill S, Gozes I, Heimesaat MM
European journal of microbiology & immunology 2018 Jun 25;8(2):34-40
European journal of microbiology & immunology 2018 Jun 25;8(2):34-40
Oxysterol Sensing through the Receptor GPR183 Promotes the Lymphoid-Tissue-Inducing Function of Innate Lymphoid Cells and Colonic Inflammation.
Emgård J, Kammoun H, García-Cassani B, Chesné J, Parigi SM, Jacob JM, Cheng HW, Evren E, Das S, Czarnewski P, Sleiers N, Melo-Gonzalez F, Kvedaraite E, Svensson M, Scandella E, Hepworth MR, Huber S, Ludewig B, Peduto L, Villablanca EJ, Veiga-Fernandes H, Pereira JP, Flavell RA, Willinger T
Immunity 2018 Jan 16;48(1):120-132.e8
Immunity 2018 Jan 16;48(1):120-132.e8
Epithelial Fli1 deficiency drives systemic autoimmunity and fibrosis: Possible roles in scleroderma.
Takahashi T, Asano Y, Sugawara K, Yamashita T, Nakamura K, Saigusa R, Ichimura Y, Toyama T, Taniguchi T, Akamata K, Noda S, Yoshizaki A, Tsuruta D, Trojanowska M, Sato S
The Journal of experimental medicine 2017 Apr 3;214(4):1129-1151
The Journal of experimental medicine 2017 Apr 3;214(4):1129-1151
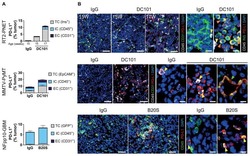
Combined antiangiogenic and anti-PD-L1 therapy stimulates tumor immunity through HEV formation.
Allen E, Jabouille A, Rivera LB, Lodewijckx I, Missiaen R, Steri V, Feyen K, Tawney J, Hanahan D, Michael IP, Bergers G
Science translational medicine 2017 Apr 12;9(385)
Science translational medicine 2017 Apr 12;9(385)
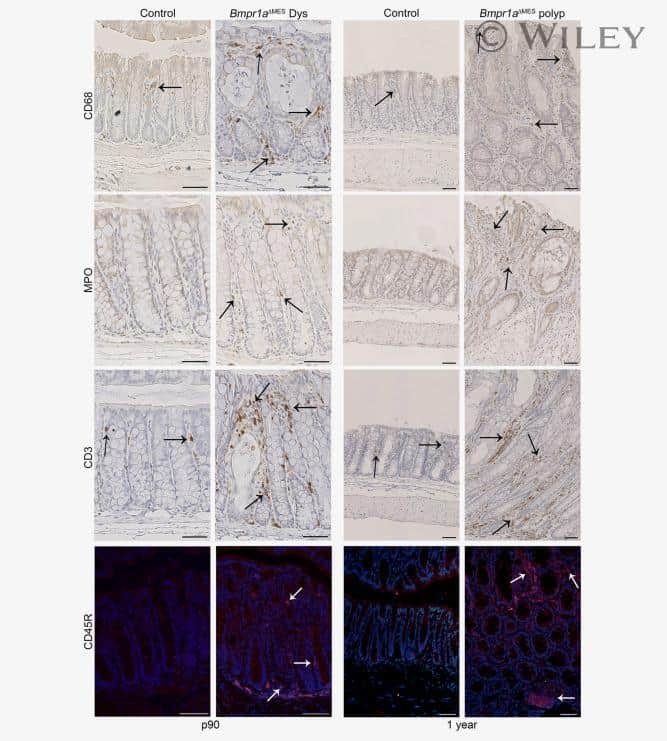
Bmp signaling in colonic mesenchyme regulates stromal microenvironment and protects from polyposis initiation.
Allaire JM, Roy SA, Ouellet C, Lemieux É, Jones C, Paquet M, Boudreau F, Perreault N
International journal of cancer 2016 Jun 1;138(11):2700-12
International journal of cancer 2016 Jun 1;138(11):2700-12
Postnatal lethality and abnormal development of foregut and spleen in Ndrg4 mutant mice.
Qu X, Li J, Baldwin HS
Biochemical and biophysical research communications 2016 Feb 12;470(3):613-619
Biochemical and biophysical research communications 2016 Feb 12;470(3):613-619
The immunosenescence-related gene Zizimin2 is associated with early bone marrow B cell development and marginal zone B cell formation.
Matsuda T, Yanase S, Takaoka A, Maruyama M
Immunity & ageing : I & A 2015;12:1
Immunity & ageing : I & A 2015;12:1
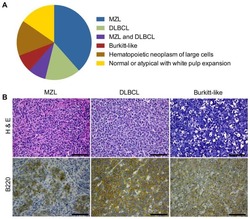
Limited miR-17-92 overexpression drives hematologic malignancies.
Danielson LS, Reavie L, Coussens M, Davalos V, Castillo-Martin M, Guijarro MV, Coffre M, Cordon-Cardo C, Aifantis I, Ibrahim S, Liu C, Koralov SB, Hernando E
Leukemia research 2015 Mar;39(3):335-41
Leukemia research 2015 Mar;39(3):335-41
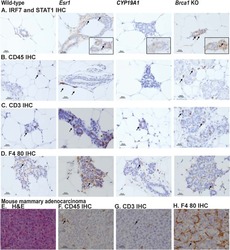
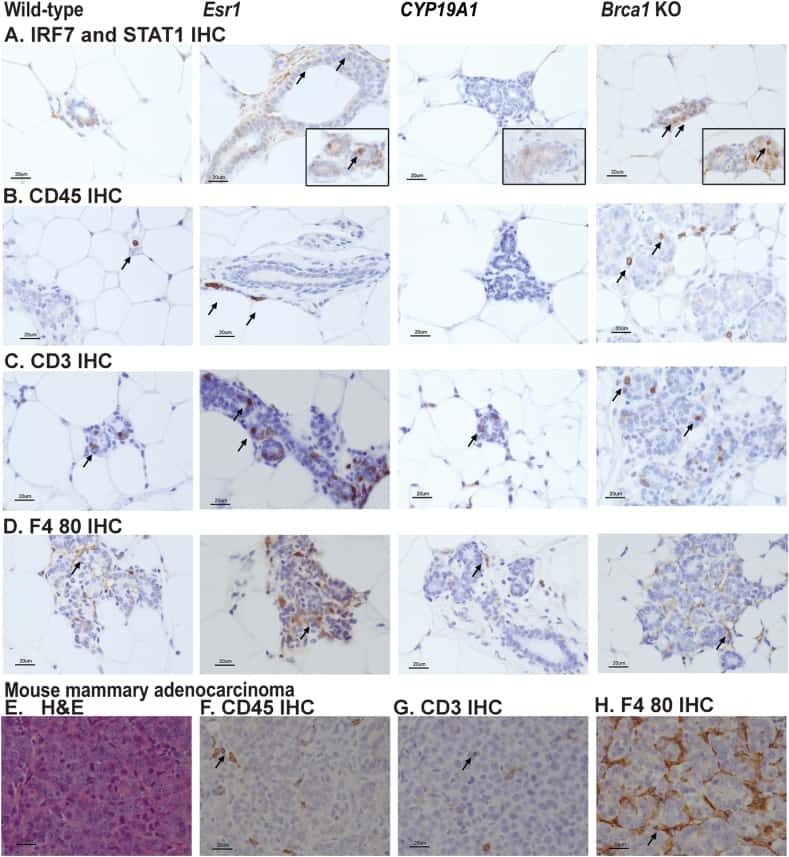
Comparison of tamoxifen and letrozole response in mammary preneoplasia of ER and aromatase overexpressing mice defines an immune-associated gene signature linked to tamoxifen resistance.
Dabydeen SA, Kang K, Díaz-Cruz ES, Alamri A, Axelrod ML, Bouker KB, Al-Kharboosh R, Clarke R, Hennighausen L, Furth PA
Carcinogenesis 2015 Jan;36(1):122-32
Carcinogenesis 2015 Jan;36(1):122-32
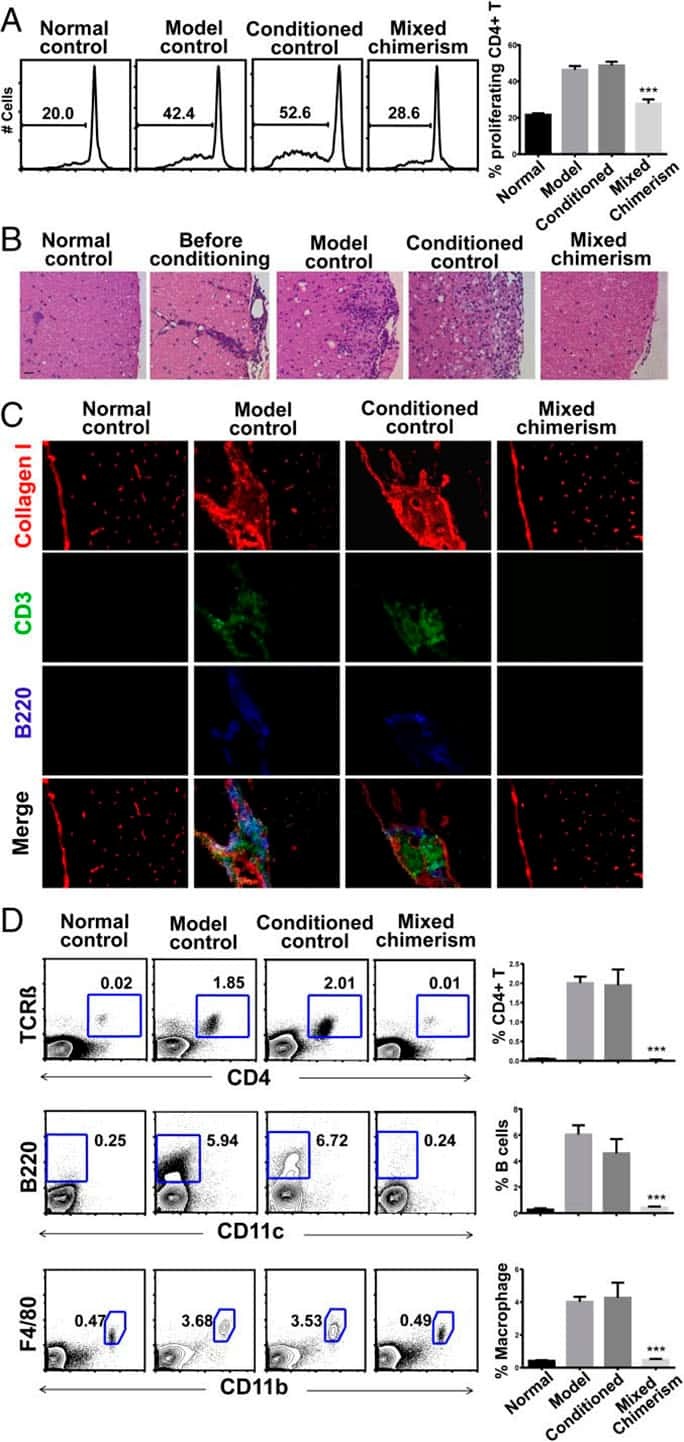
MHC-mismatched mixed chimerism augments thymic regulatory T-cell production and prevents relapse of EAE in mice.
Wu L, Li N, Zhang M, Xue SL, Cassady K, Lin Q, Riggs AD, Zeng D
Proceedings of the National Academy of Sciences of the United States of America 2015 Dec 29;112(52):15994-9
Proceedings of the National Academy of Sciences of the United States of America 2015 Dec 29;112(52):15994-9
B-cell-intrinsic hepatitis C virus expression leads to B-cell-lymphomagenesis and induction of NF-κB signalling.
Kasama Y, Mizukami T, Kusunoki H, Peveling-Oberhag J, Nishito Y, Ozawa M, Kohara M, Mizuochi T, Tsukiyama-Kohara K
PloS one 2014;9(3):e91373
PloS one 2014;9(3):e91373
A component of the mir-17-92 polycistronic oncomir promotes oncogene-dependent apoptosis.
Olive V, Sabio E, Bennett MJ, De Jong CS, Biton A, McGann JC, Greaney SK, Sodir NM, Zhou AY, Balakrishnan A, Foth M, Luftig MA, Goga A, Speed TP, Xuan Z, Evan GI, Wan Y, Minella AC, He L
eLife 2013 Oct 15;2:e00822
eLife 2013 Oct 15;2:e00822
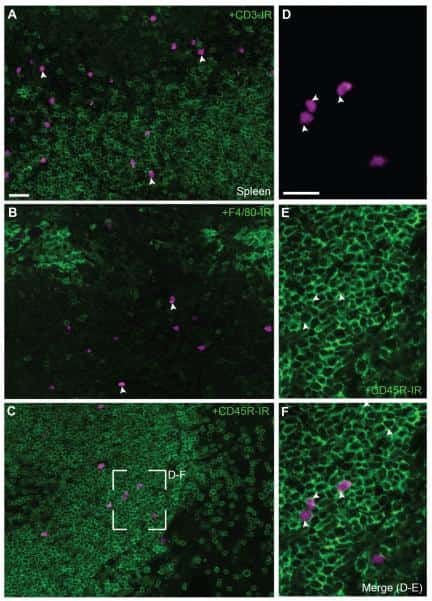
Neuronal and nonneuronal cholinergic structures in the mouse gastrointestinal tract and spleen.
Gautron L, Rutkowski JM, Burton MD, Wei W, Wan Y, Elmquist JK
The Journal of comparative neurology 2013 Nov;521(16):3741-67
The Journal of comparative neurology 2013 Nov;521(16):3741-67
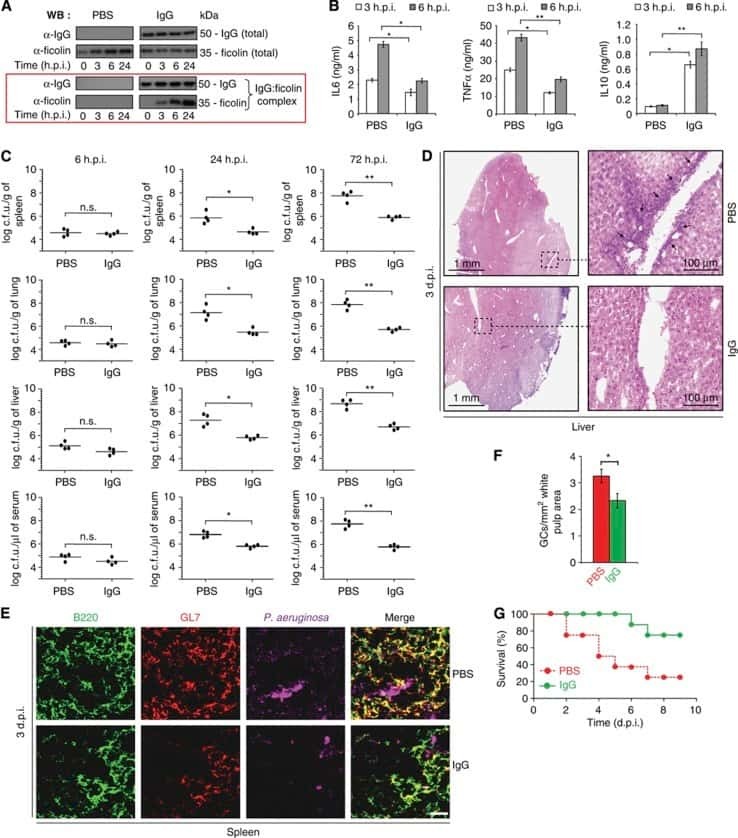
Natural IgG antibodies provide innate protection against ficolin-opsonized bacteria.
Panda S, Zhang J, Tan NS, Ho B, Ding JL
The EMBO journal 2013 Nov 13;32(22):2905-19
The EMBO journal 2013 Nov 13;32(22):2905-19
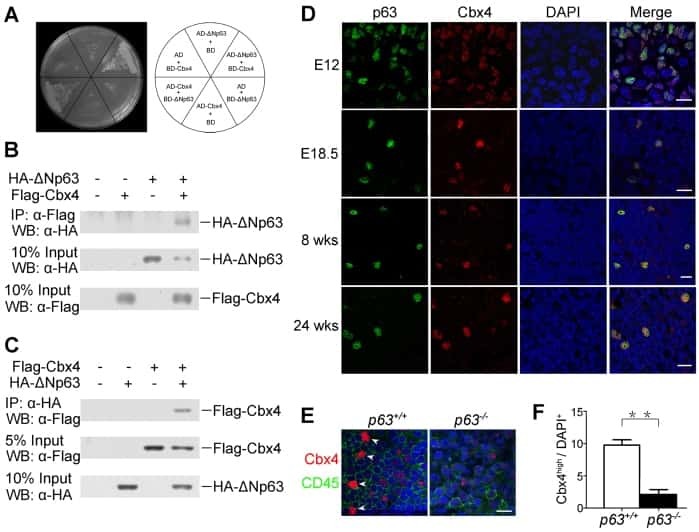
Cbx4 regulates the proliferation of thymic epithelial cells and thymus function.
Liu B, Liu YF, Du YR, Mardaryev AN, Yang W, Chen H, Xu ZM, Xu CQ, Zhang XR, Botchkarev VA, Zhang Y, Xu GL
Development (Cambridge, England) 2013 Feb;140(4):780-8
Development (Cambridge, England) 2013 Feb;140(4):780-8
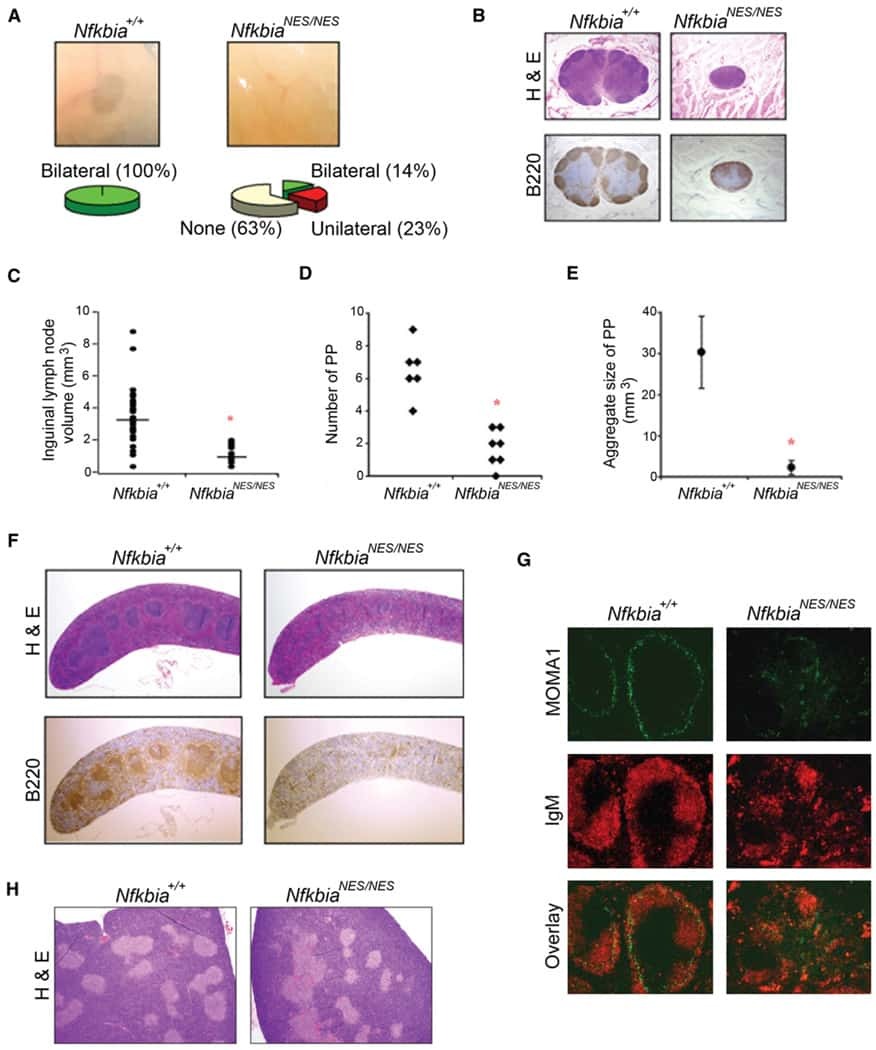
Nuclear export of the NF-κB inhibitor IκBα is required for proper B cell and secondary lymphoid tissue formation.
Wuerzberger-Davis SM, Chen Y, Yang DT, Kearns JD, Bates PW, Lynch C, Ladell NC, Yu M, Podd A, Zeng H, Huang TT, Wen R, Hoffmann A, Wang D, Miyamoto S
Immunity 2011 Feb 25;34(2):188-200
Immunity 2011 Feb 25;34(2):188-200
A role for brain-derived neurotrophic factor in B cell development.
Schuhmann B, Dietrich A, Sel S, Hahn C, Klingenspor M, Lommatzsch M, Gudermann T, Braun A, Renz H, Nockher WA
Journal of neuroimmunology 2005 Jun;163(1-2):15-23
Journal of neuroimmunology 2005 Jun;163(1-2):15-23
Identification of monoclonal antibodies for immunohistochemical staining of feline B lymphocytes in frozen and formalin-fixed paraffin-embedded tissues.
Monteith CE, Chelack BJ, Davis WC, Haines DM
Canadian journal of veterinary research = Revue canadienne de recherche veterinaire 1996 Jul;60(3):193-8
Canadian journal of veterinary research = Revue canadienne de recherche veterinaire 1996 Jul;60(3):193-8
No comments: Submit comment
Supportive validation
- Submitted by
- Invitrogen Antibodies (provider)
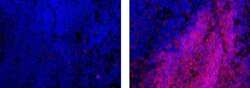
- Main image
- Experimental details
- Immunohistochemistry on frozen mouse spleen using 1 µg/mL Rat IgG2a K Isotype Control eFluor® 615 (left) or 1 µg/mL Anti-Human/Mouse CD45R (B220) eFluor® 615 (right). Nuclei are counterstained with DAPI.

Supportive validation
- Submitted by
- Invitrogen Antibodies (provider)
- Main image

- Experimental details
- NULL
- Submitted by
- Invitrogen Antibodies (provider)
- Main image
- Experimental details
- NULL
- Submitted by
- Invitrogen Antibodies (provider)
- Main image
- Experimental details
- NULL
- Submitted by
- Invitrogen Antibodies (provider)
- Main image
- Experimental details
- NULL
- Submitted by
- Invitrogen Antibodies (provider)
- Main image

- Experimental details
- NULL
- Submitted by
- Invitrogen Antibodies (provider)
- Main image
- Experimental details
- NULL
- Submitted by
- Invitrogen Antibodies (provider)
- Main image
- Experimental details
- NULL
- Submitted by
- Invitrogen Antibodies (provider)
- Main image

- Experimental details
- NULL
- Submitted by
- Invitrogen Antibodies (provider)
- Main image
- Experimental details
- NULL
- Submitted by
- Invitrogen Antibodies (provider)
- Main image
- Experimental details
- NULL
- Submitted by
- Invitrogen Antibodies (provider)
- Main image

- Experimental details
- NULL
- Submitted by
- Invitrogen Antibodies (provider)
- Main image
- Experimental details
- NULL
- Submitted by
- Invitrogen Antibodies (provider)
- Main image
- Experimental details
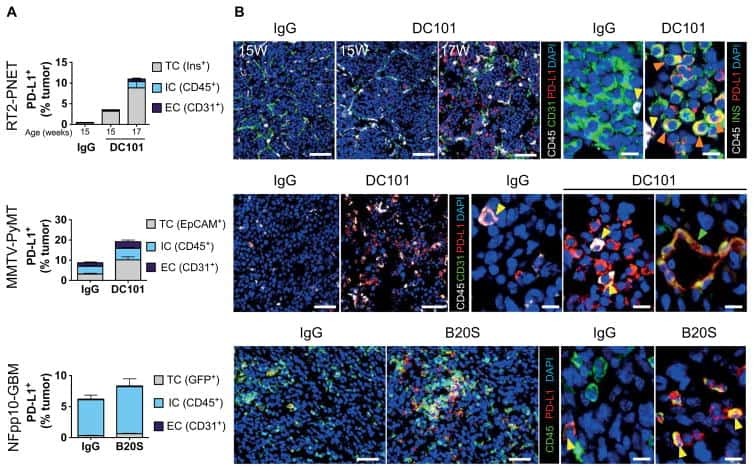
- Figure 4 Double immunofluorescence localisation of B220 (Green) and NF-kappaB p65 (Red) in HCV-Tg mice and the fractionation analysis of mouse tissues. A : Co-localisation of NF-kappaB p65 immunoreactivity with B220 is indicated by arrows. (a-b) Cells double-positive for B220 and NF-kappaB in the control mouse (CD19cre). (c-d) Cells double-positive for B220 and NF-kappaB in the asymptomatic HCV-Tg mouse (RzCD19cre). (e-f) Cells double-positive for B220 and NF-kappaB in the lymphomatous HCV-Tg mouse (RzCD19cre). B : Quantitative analysis of the ratio of double-positive cells among B220-positive cells in each HCV-Tg mouse. Bar graph indicates the percentage of cells with NF-kappaB p65 nuclear translocation in B220-positive cells. C : Bar graph shows the ratio of double-positive cells within the B220-positive cells in normal, asymptomatic and lymphomatous HCV-Tg mice. Ho: Hoechst33342 Data are presented as means +- S.E., * P

- Submitted by
- Invitrogen Antibodies (provider)
- Main image
- Experimental details
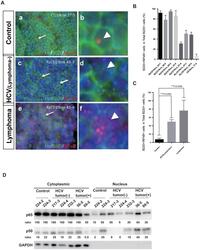
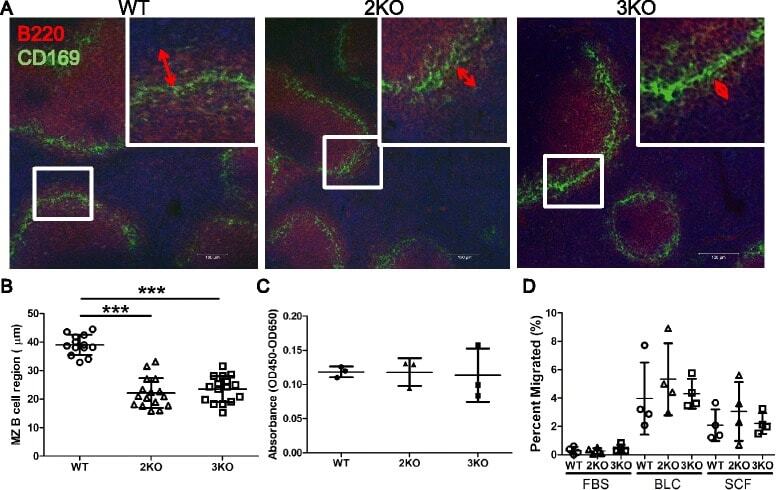
- Figure 7 Marginal zone B cell regions were narrowed in Ziz2 KO mice. (A) Spleen sections were stained with anti-B220 (Red) and anti-CD169 (Green) antibodies for the MZ B cell region (B220-positive region outside CD169-positive cells). All mice were 10 weeks old. Scale bars: 100 mum. (B) MZ B cell regions were narrower in Ziz2 and Ziz3 KO mice than in wild type mice. (C) The proliferative activity of MZ B cells in response to LPS was not altered in both KO mice. Three mice per group were used. Data from three independent experiments (one mouse per group per experiment was used) were summarized. (D) The migratory activity of MZ B cells was analyzed using a transwell and flow cytometry. Activity against BLC or SDF1 (SDF) was not altered in both KO mice. Four mice per group were used. Each plot indicates data from one mouse. Data from four independent experiments (one mouse per group per experiment was used) were summarized. 2KO: Ziz2 KO. 3KO: Ziz3 KO. ***: P < 0.0001.
- Submitted by
- Invitrogen Antibodies (provider)
- Main image
- Experimental details
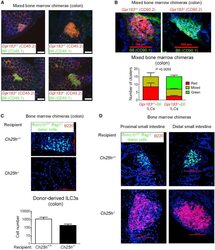
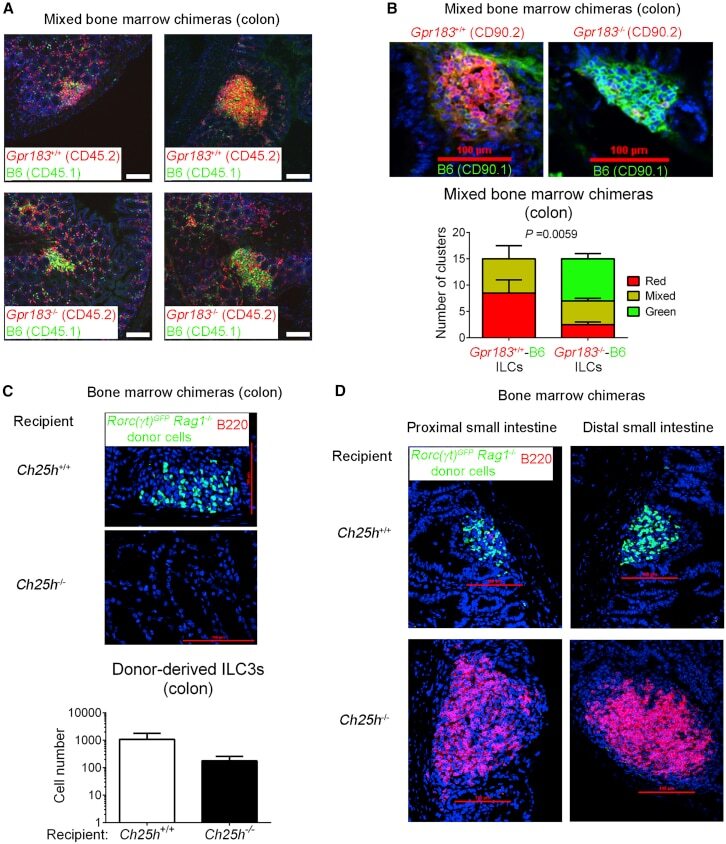
- Figure 3 GPR183 and 7alpha,25-OHC Promote ILC3 Localization to CPs and ILFs (A) Distribution of Gpr183 +/+ and Gpr183 -deficient hematopoietic cells in the colon of mixed bone marrow chimeras. Bone marrow cells from Gpr183 +/+ or Gpr183 -/- mice (CD45.2 + ) were mixed 9:1 with B6 cells (CD45.1 + ) and injected into irradiated Rag1 -/- recipients (CD45.1 + ) for the generation of bone marrow chimeras. Sections were stained for detection of Gpr183 +/+ and Gpr183 -/- cells (CD45.2, red) or B6 cells (CD45.1, green). Nuclei were visualized by DAPI staining (blue). Scale bars on the right (white) represent 100 mum. (B) Distribution of Gpr183 +/+ and Gpr183 -deficient ILCs in the colon of mixed bone marrow chimeras. Bone marrow cells from Gpr183 +/+ or Gpr183 -/- mice (CD90.2 + ) were mixed 9:1 with B6 cells (CD90.1 + ) and injected into irradiated B6 recipients (CD90.1 + ) for the generation of bone marrow chimeras. Colon sections were stained for detection of Gpr183 +/+ and Gpr183 -/- (CD90.2, red) or B6 (CD90.1, green) ILCs. Scale bars (red) represent 100 mum. The lower panel shows the number of clusters in Gpr183 +/+ -B6 and Gpr183 -/- -B6 chimeras consisting of CD90.2 + (red) or CD90.1 + (green) ILCs. Data are represented as means +- SEM. p value by two-way ANOVA. (C and D) Distribution of donor-derived ILC3s (RORgammat-GFP + , green) in the colon (C) and small intestine (D) of bone marrow chimeras. Bone marrow cells from Rag1 -deficient Rorc(gamma
- Submitted by
- Invitrogen Antibodies (provider)
- Main image
- Experimental details
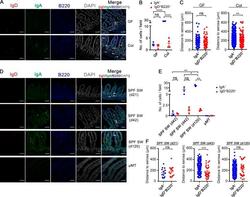
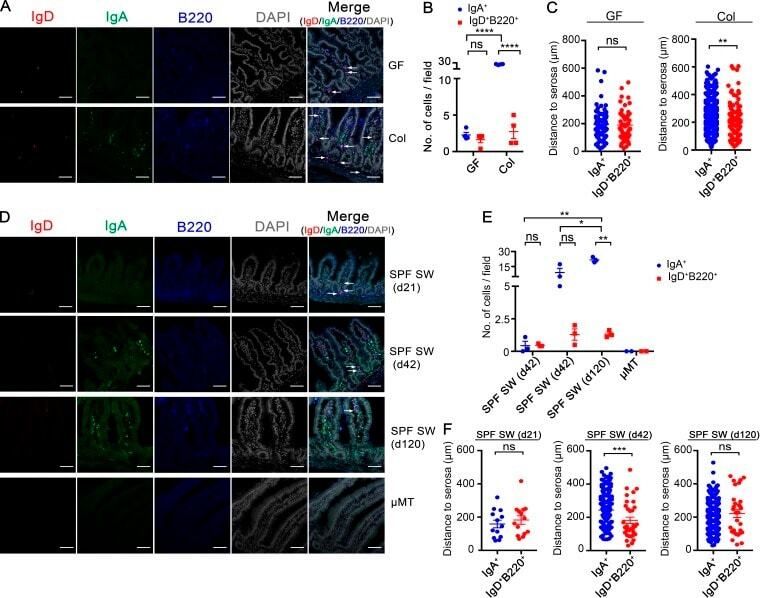
- Figure 3. Localization of intestinal IgD + B Cells. (A) Representative photomicrographs of small intestinal sections stained with DAPI- and fluorophore-conjugated Ab for IgD (FITC), IgA (PE), and B220 (APC) as indicated from GF ( n = 4) and conventionalized SW littermates (Col, n = 4). Photomicrographs shown are representative of one of two independent experiments. (B) Dot plot showing the number of LP IgA + cells and IgD + B220 + cells per high power field (200x) per GF ( n = 4; 10 fields/mouse) and conventionalized SW littermates (Col; n = 4; 11 fields/mouse) described as in A. (C) Dot plots showing the perpendicular distance (see Materials and methods) between individual LP IgA + cells ( n = 85 for GF; n = 971 for Col), IgD + B220 + cells ( n = 59 for GF; n = 108 for Col), and the serosal surface from GF ( n = 4) and colonized SW littermates (Col, n = 4) described as in A. (D) Representative photomicrographs of small intestinal sections stained as in A from SPF SW mice at the age of postnatal day 21 ( n = 3), 42 ( n = 3), and 120 ( n = 3). Negative control uMT mice ( n = 2) are also shown. White arrows indicate IgD + B220 + cells. Bars, 60 um. Photomicrographs are representative images from one of three independent experiments for each time point and two independent experiments for uMT mice. (E) Dot plot showing the number of IgA + cells and IgD + B220 + cells per high power field (200x) from SPF SW mice and uMT mice described as
- Submitted by
- Invitrogen Antibodies (provider)
- Main image
- Experimental details
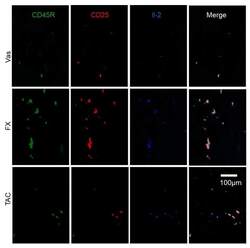
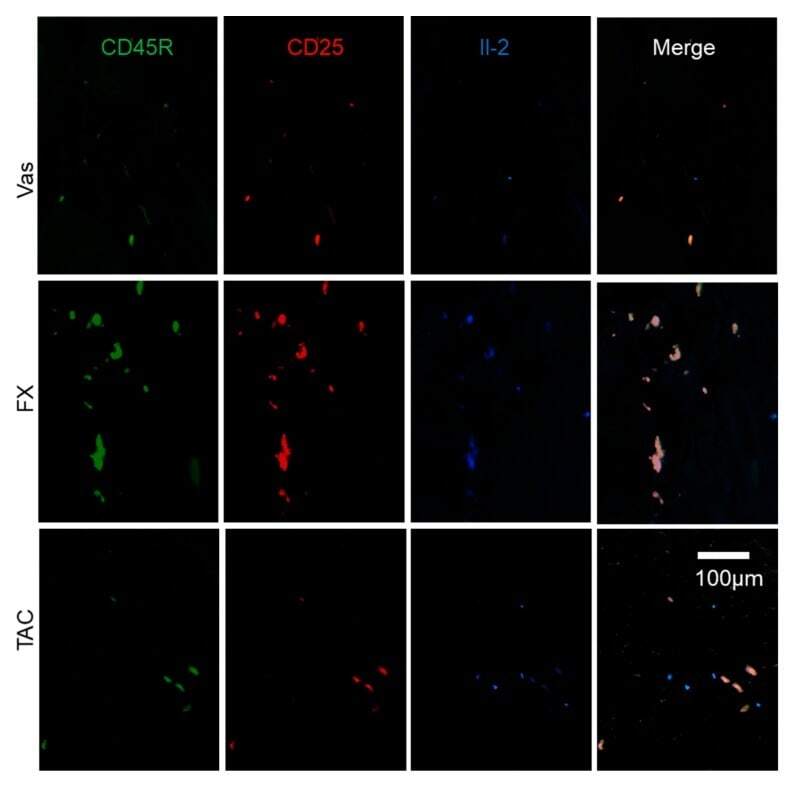
- Figure 6 The characterization of Il-2 producers regulated by FX and TAC. FX stimulated Il-2 production in CD45R + CD25 + ILCregs. Some Il-2 + CD45R + CD25 + ILCregs were observed in TAC treated skin and others were CD45R - CD25 - cells. The panel is focused on the dermis.
- Submitted by
- Invitrogen Antibodies (provider)
- Main image
- Experimental details
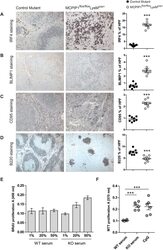
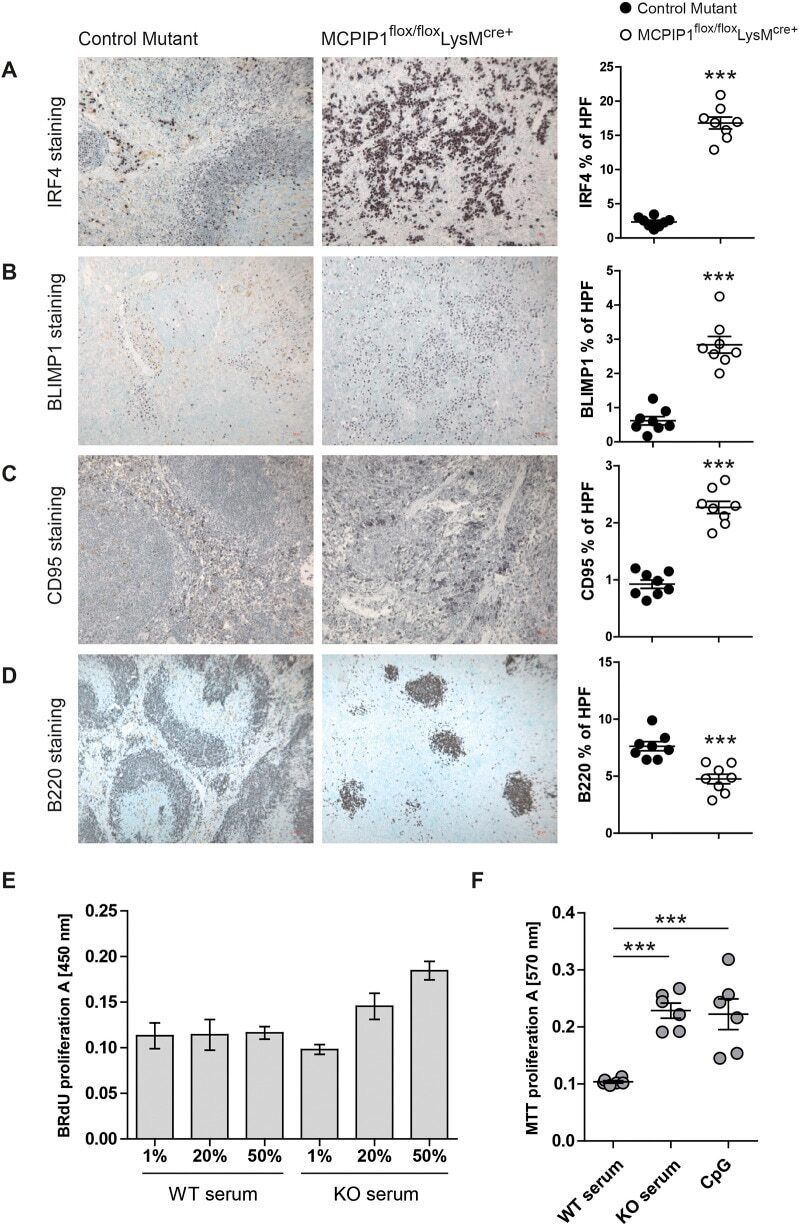
- Fig. 4. Macrophage-derived MCPIP1 regulates B-lymphocyte expansion in lymphoid organs. (A-D) Spleen sections were stained with anti-mouse IRF4, BLIMP1, CD95 and B220 antibodies and quantified by Adobe Photoshop software as percentage of positively stained high-power field (HPF) from eight mice per group; *** P
- Submitted by
- Invitrogen Antibodies (provider)
- Main image
- Experimental details
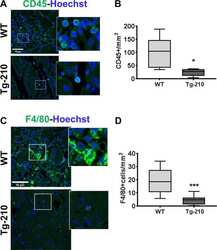
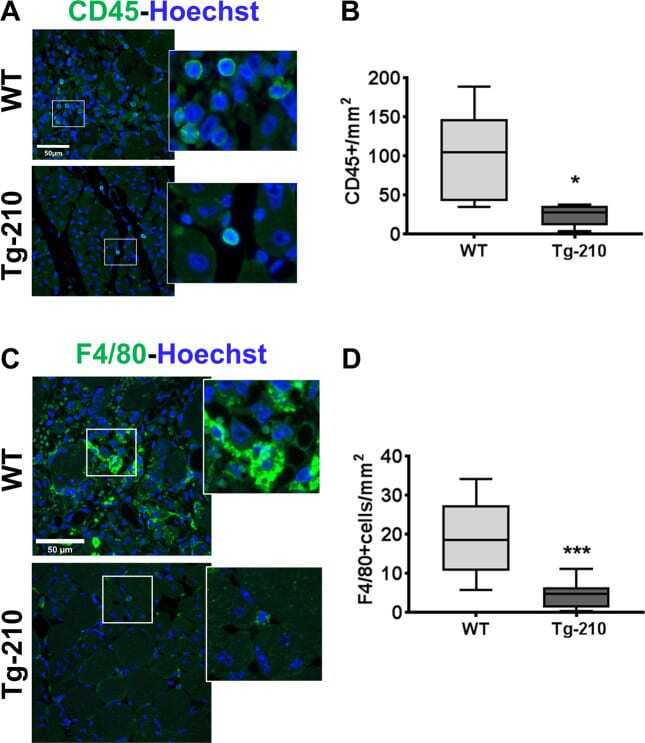
- Fig. 1 Ubiquitous miR-210 over-expression attenuates the inflammatory response after hindlimb ischemia. A Representative immunofluorescence staining for CD45 (green), a common leukocyte marker expressed in all nucleated hematopoietic cells, of gastrocnemius muscle sections of Wt and Tg-210 mice, 7 days after ischemia. Nuclei were stained by Hoechst (blue). Images are presented as merge. Magnification x400. Calibration bar 50 um. B Quantification of CD45-positive cells/mm 2 ( n = 5, test T * P < 0.03). C Representative immunofluorescence staining for F4/80 (green), a pan-macrophage marker, in gastrocnemius muscle sections of Wt, and Tg-210 mice, 7 days after ischemia. Nuclei were stained by Hoechst (Blue). Images are presented as merge. Magnification 63 x 0.5. Calibration bar 50 um. D Quantification of F4/80-positive macrophages/mm 2 ( n = 6-7, ** P < 0.009). In both A , C insets show magnification of the indicated areas.
- Submitted by
- Invitrogen Antibodies (provider)
- Main image
- Experimental details
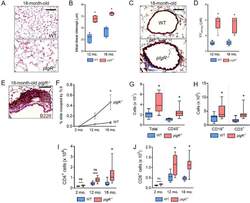
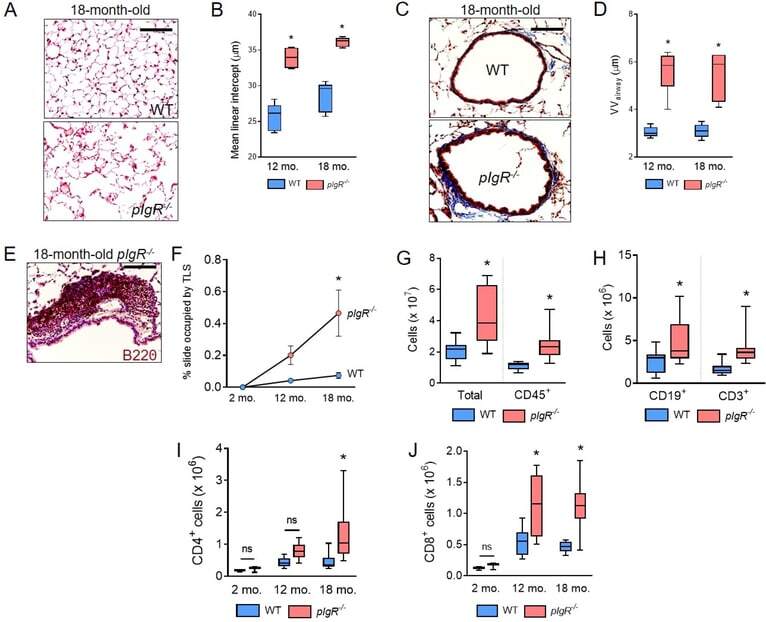
- Figure 2. pIgR -/- mice spontaneously develop COPD-like lung pathology and adaptive immune activation. ( A ) Representative image of emphysema in an 18-month-old pIgR -/- and age-matched WT mouse (hematoxylin and eosin, scale bar = 50 mum). ( B ) Measurement of mean linear intercept (MLI), a morphometric measurement of emphysema, in WT and pIgR -/- mice at the indicated ages. ( C ) Representative image of small airway wall thickening in an 18-month-old pIgR -/- and age-matched WT mouse (Masson's trichrome, scale bar = 50 mum). ( D ) Measurement of VV airway , a morphometric measurement of small airway wall thickness, in WT and pIgR -/- mice at the indicated ages. ( E ) Example of a tertiary lymphoid structure (TLS) in an 18-month-old pIgR -/- mouse as indicated by immunostaining for B220. Scale bar = 50 mum. ( F ) Morphometric analysis of TLS area in lungs of WT or pIgR -/- mice at the indicated ages. ( G-J ) Quantification of total, CD45 + , CD19 + , CD3 + , CD4 + , and CD8 + cells in the lungs of 18-month-old WT and pIgR -/- mice by flow cytometry. ( B and D ) * = p
- Submitted by
- Invitrogen Antibodies (provider)
- Main image
- Experimental details
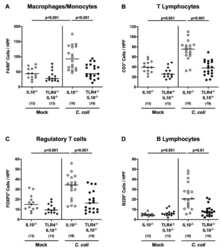
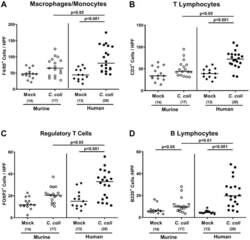
- Figure 6 Colonic innate and adaptive immune cell responses following peroral C. coli infection of human microbiota-associated TLR4-deficient IL10 -/- mice. IL10 -/- mice (open symbols) and TLR4-deficient IL10 -/- mice (TLR4 -/- IL10 -/- ; closed symbols) with a human gut microbiota were either perorally infected with C. coli (circles) or received vehicle (mock; diamonds) on days 0 and 1 by gavage. Upon necropsy on day 21 post-infection, the average counts of ( A ) macrophages and monocytes (F4/80 + ), ( B ) T lymphocytes (CD3 + ), ( C ) regulatory T cells (FOXP3+) and ( D ) B lymphocytes (B220+) were microscopically determined in six high power fields (HPF, 400 times magnification) per mouse in immunohistochemically stained colonic paraffin sections. Medians (black bars) and numbers of examined mice (in parentheses), as well as levels of significance ( p -values) determined by the one-way ANOVA test and Tukey's post-correction or the Kruskal-Wallis test and Dunn's post-correction, are shown. Data were pooled from three independent experiments.

- Submitted by
- Invitrogen Antibodies (provider)
- Main image
- Experimental details
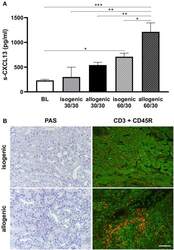
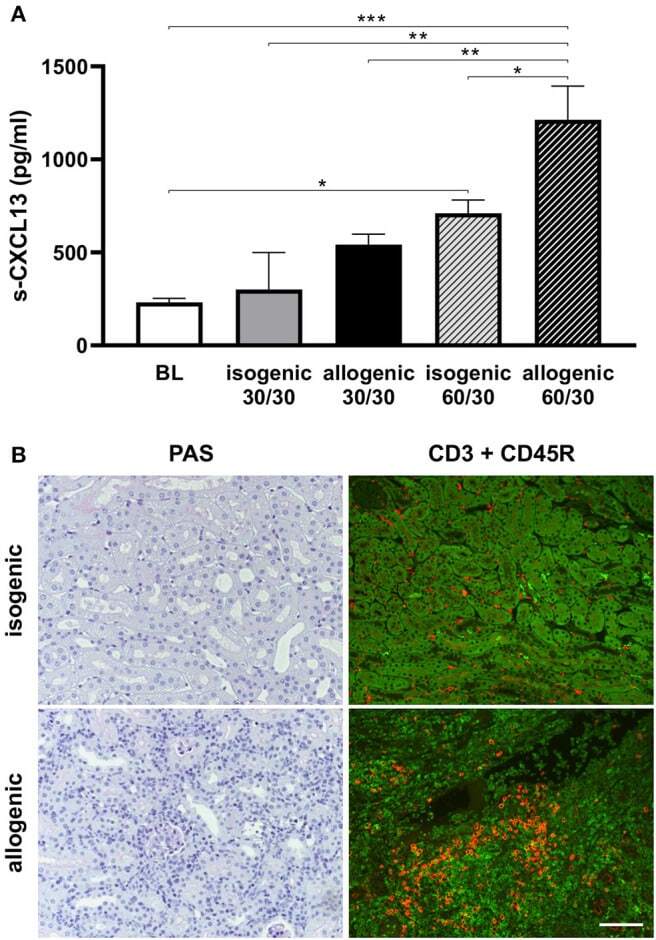
- Figure 6 Serum CXCL13 levels in mouse ktx. Post ktx levels of serum CXCL13 at day 1 were significantly increased compared to baseline. A higher increase was observed in longer cold ischemia time (30 vs. 60 min cold ischemia time). Isogenic ktx with prolonged cold ischemia time of 60 min had significantly lower CXCL13 levels compared to allogenic ktx (A) . PAS stain at day 7 revealed enhanced cell infiltration in allogenic compared to isogenic ktx (B) . Double staining for CD3+ T-lymphocytes (green) and CD45R+ B-cells (red) was performed at day 7. More interstitial CD3+ T-lymphocytes were observed in allografts compared to isografts. Allografts exhibited scattered B-cells in interstitial tissue, but also clusters of CD45R+ cells. Isografts showed only few B cells in the interstitium at day 7 (B) (bar: 100 mum, n = 6 per group, one-way ANOVA * p < 0.05; ** p < 0.01; *** p < 0.001). BL, baseline.
- Submitted by
- Invitrogen Antibodies (provider)
- Main image
- Experimental details
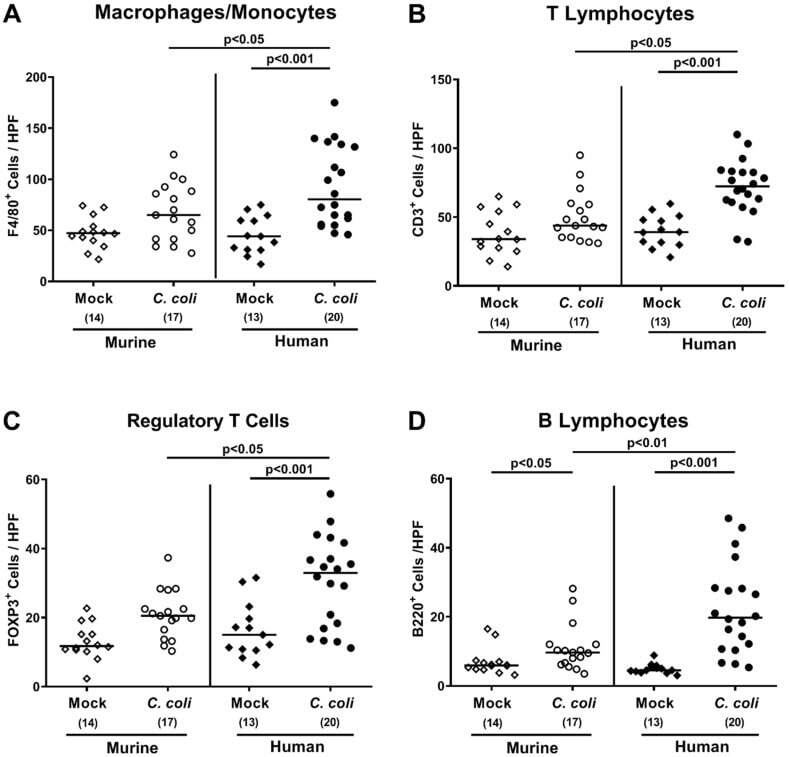
- Figure 7 Colonic immune cell responses upon oral C. coli infection of microbiota-depleted IL-10 -/- mice that had been challenged with human or murine fecal microbiota transplantations. On days -7, -6, and -5, mice were subjected to murine (open symbols) or human (closed symbols) fecal microbiota transplantations and challenged with a C. coli patient isolate (circles) or vehicle as mock controls (diamonds) on days 0 and 1 by gavage. On day 21 post-infection, the average numbers of ( A ) macrophages and monocytes (F4/80+), ( B ) T lymphocytes (CD3+), ( C ) regulatory T cells (FOXP3+), and ( D ) B lymphocytes (B220+) were determined in the large intestinal mucosa and lamina propria out of 6 high-power fields (HPF, 400x magnification) per mouse. Medians (black bars), significance levels ( p -values calculated by the Kruskal-Wallis test and Dunn's post-correction), and total numbers of mice under investigation (in parentheses) are shown. Results from four experiments were pooled.
- Submitted by
- Invitrogen Antibodies (provider)
- Main image
- Experimental details
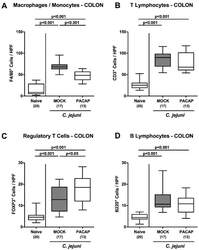
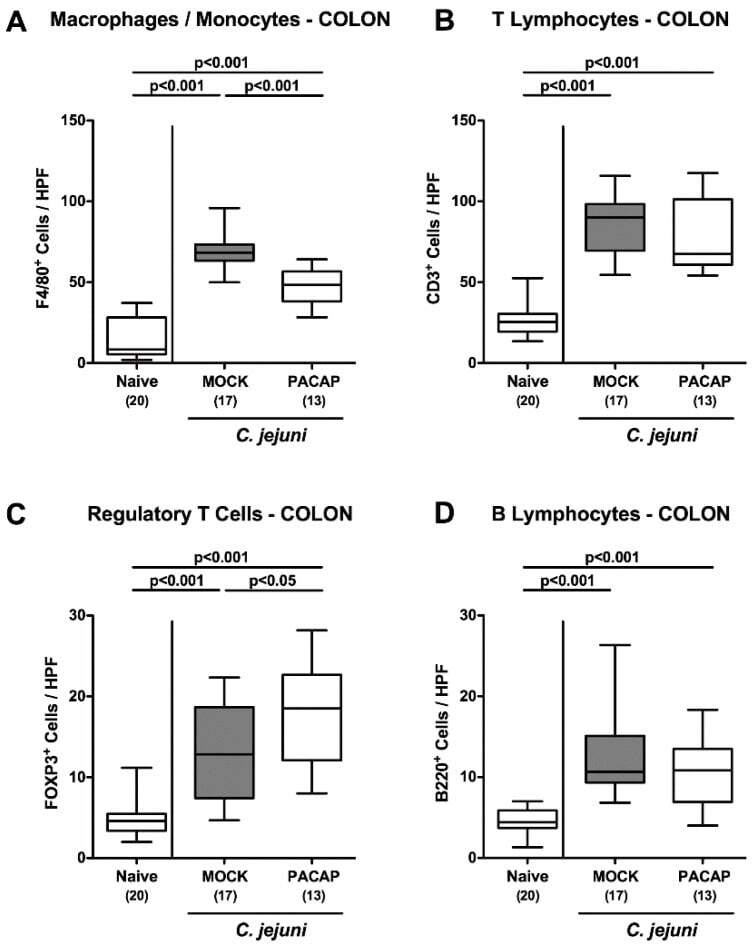
- Figure 5 Innate and adaptive immune cell responses in the colon following PACAP treatment of C. jejuni infected secondary abiotic IL-10 -/- mice. Mice were perorally infected with C. jejuni strain 81-176 by gavage on day (d) 0 and d1, and subjected to intraperitoneal treatment with either synthetic PACAP or vehicle (mock) from d2 until d5 post-infection. On d6 the average numbers of ( A ) macrophages and monocytes (F4/80 + ), ( B ) T lymphocytes (CD3 + ), ( C ) regulatory T cells (FOXP3 + ) and ( D ) B lymphocytes (B220 + ) were quantitated in six high power fields (HPF) of colonic paraffin sections applying immunohistochemistry. Naive mice were used as negative controls. Box plots indicate the 75th and 25th percentiles of the median (black bar within boxes). The total range, the significance levels ( p values calculated by the one-way ANOVA test followed by the Tukey post-correction test for multiple comparisons) and the total numbers of mice under investigation (in parentheses) are indicated. Results pooled from four independent experiments are shown.
- Submitted by
- Invitrogen Antibodies (provider)
- Main image
- Experimental details
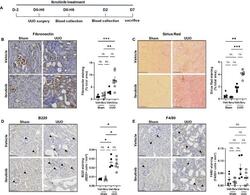
- Figure 1 Ibrutinib promotes renal fibrosis after unilateral ureteric obstruction (UUO). ( A ) Design of the study. ( B - E ) Representatives images and quantifications of Fibronectin ( B ), Sirius Red ( C ), B220 ( D ) and F4/80 ( E ) staining in sham and UUO mice receiving ibrutinib (Ibru) or vehicle (Veh). Data are represented as means +- SEM. *p < 0.05 (Mann-Whitney test; n = 6 mice per group); ns, not significant.

- Submitted by
- Invitrogen Antibodies (provider)
- Main image
- Experimental details
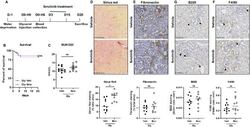
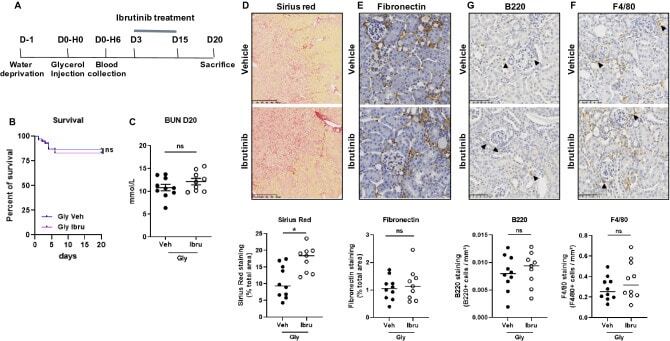
- Figure 3 Ibrutinib promotes rhabdomyolysis-induced renal fibrosis. ( A ) Design of the study. ( B ) Kaplan-Meier survival curves after glycerol injection in mice receiving ibrutinib (Ibru) or vehicle (Veh) from day 3. ( C ) Blood urea nitrogen (BUN) 20 days after glycerol injection. ( D - G ) Representatives images and quantification of Sirius Red ( D ), Fibronectin ( E ), F4/80 ( F ) and B220 ( G ) staining 20 days after glycerol injection in mice receiving ibrutinib (Ibru) or vehicle (Veh) from day 3. Values are expressed as mean +- SEM. * p < 0.05, compared with the vehicle group (Mann-Whitney test, n = 5-10 mice); ns, not significant.
- Submitted by
- Invitrogen Antibodies (provider)
- Main image
- Experimental details
- Figure 4 Proof-of-mechanism study for TAX2 use as an anti-tumor immunomodulatory drug. The effects of TAX2 peptide treatment on the activation of an anti-tumor immune response were investigated in two syngeneic models of epithelial ovarian carcinoma. We inoculated 5 x 10 6 ID8 cells either subcutaneously or intraperitoneally to C57BL/6JRj mice in order to mimic primary tumor growth ( a - h ) and metastatic dissemination (peritoneal carcinosis, i - l ), respectively. TAX2 treatments (30 mg * kg -1 BW) vs. vehicle injections (0.9% NaCl) were performed thrice weekly for 4 and 8 weeks for the s.c. and i.p. ID8 models, respectively ( n = 11 per group for both models). ( a - h ) IHC staining of s.c. ovarian carcinoma allografts for the analysis of the vascular/lymphovascular features, as well as immune-cell-infiltration profile. ( a ) Representative microphotograph for CD31 immunostaining of intra-tumor vascular structures. Histogram displays results of automated quantification for the percent of CD31-positive pixels across the whole tumor section (mean +- SEM, Mann-Whitney U test; n.s., not significant). ( b ) Lymphatic vessel density analysis. Microscopic views are shown, while histogram displays the number of Lyve-1-positive functional lymphatic vessels in 5 high power fields (HPF), as determined by a pathologist who was blinded to the treatment (mean +- SEM, Mann-Whitney U test, * p < 0.05). ( c - f ) Macroscopic views (x20 magnification) of s.c. tumor allograft sections after

- Submitted by
- Invitrogen Antibodies (provider)
- Main image
- Experimental details
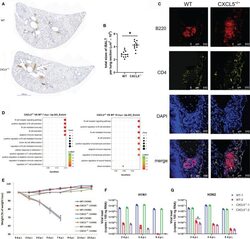
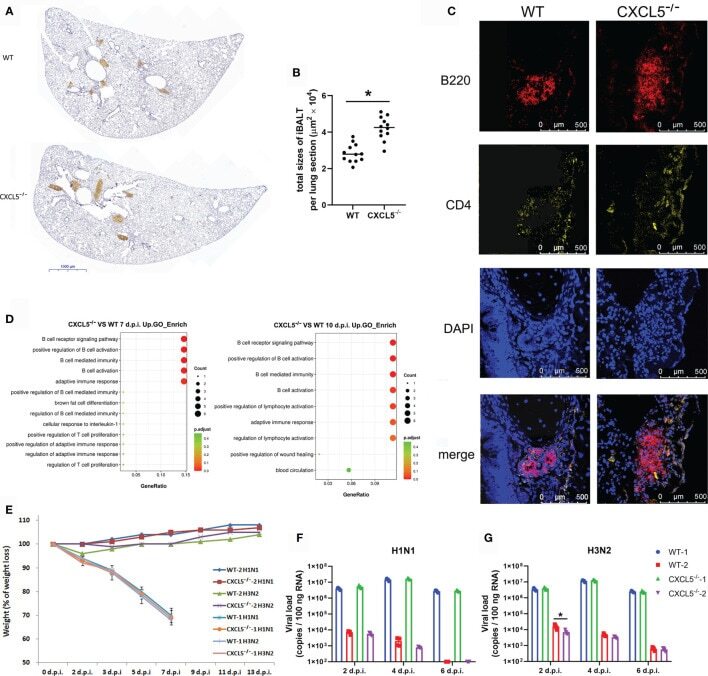
- Figure 8 Establishment of adaptive immunity in the infected lungs of WT and CXCL5 -/- mice. (A) Lung lobe sections from WT and CXCL5 -/- mice were stained at 10 d.p.i. with an anti-B220 antibody and hematoxylin (x30 magnification). (B) The positively stained area (iBALT structure) in each lung lobe section was calculated using CaseViewer software (3DHISTECH). The total area of iBALT per lung section was calculated from 4 mice per group (3 lung lobe sections per mouse). (C) Lung sections were stained with anti-B220 (red) and anti-CD4 (yellow) antibodies for immunofluorescence detection. The immunofluorescence sections were counterstained with DAPI (blue). (D) GO functional analysis of upregulated genes in the infected lungs of CXCL5 -/- mice compared to WT mice at 7 and 10 d.p.i. The methods and criteria for filtration of differentially expressed genes are described in the MATERIALS AND METHODS section. (E) Mice were infected with H1N1 or H3N2 (3000 CCID 50 ), and the body weight loss (n=12) of the mice was monitored until 2 weeks post infection. WT-1 H1N1: WT mice infected with H1N1; WT-1 H3N2: WT mice infected with H3N2; CXCL5 -/- 1 H1N1: CXCL5 -/- mice infected with H1N1; CXCL5 -/- 1 H3N2: CXCL5 -/- mice infected with H3N2; WT-2 H1N1: WT mice recovered from H1N1 infection and infected with H1N1; WT-2 H3N2: WT mice recovered from H1N1 infection and infected with H3N2; CXCL5 -/- 2 H1N1: CXCL5 -/- mice recovered from H1N1 infection and infected with H1N1; CXCL5 -/- 2 H3N2: CXC
- Submitted by
- Invitrogen Antibodies (provider)
- Main image
- Experimental details
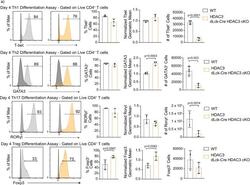
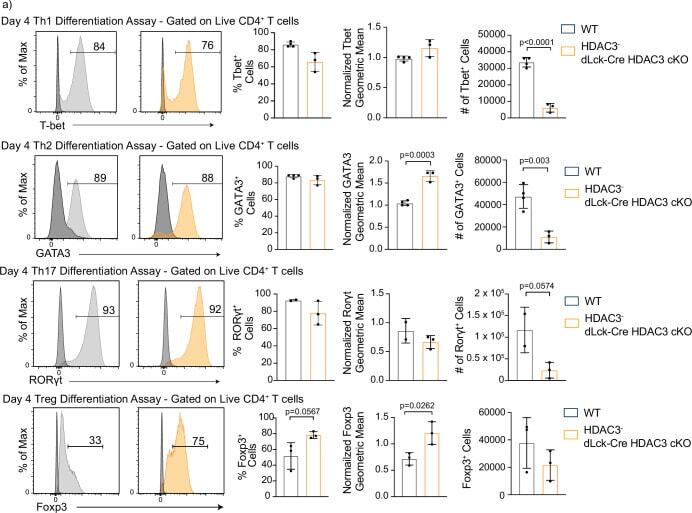
- Figure 3. Histone deacetylase 3 (HDAC3)-deficient CD4 + T cells are capable of differentiation, but produce fewer cells than wild-type (WT). ( a ) In vitro differentiation assays were performed to examine differentiation into the T h 1, T h 2, T h 17, and T reg lineages characterized by transcription factor expression. Splenocytes were harvested and magnetically enriched for naive (CD44 - ) CD4 + T cells by negative selection. Cells in all assays were stimulated with 2 ug/ml plate-bound alphaCD3 and 0.5 ug/ml alphaCD28 for 4 days. For T h 1 differentiation, 1 ug/ml alphaIL-4 antibody and 10 ng/ml of IL-12 were added to the media. For T h 2 differentiation, 1 ug/ml of each alphaIFNgamma and alphaIL-12 antibody, as well as 10 ng/ml of IL-4 was added to the media. For T h 17 differentiation, media was supplemented with 10 ug/ml of alphaIFNgamma and alphaIL-4 antibody as well as 10 ng/ml of rIL-23, 5 ng/ml TGF-beta1, and 20 ng/ml IL-6. For T reg differentiation, media was supplemented with 10 ug/ml alphaIFNgamma and alphaIL-4 antibody as well as 2 ng/ml TGF-beta1, and 2 ng/ml interleukin-2 (IL-2). Unstimulated control samples did not receive alphaCD3/alphaCD28 stimulation, but did receive 10 ng/ml IL-7 to maintain cell survival during culture. Bar plots on the right show % of cells from the total culture that are positive for the transcription factor +- standard deviation (SD), total cell number +- SD, and geometric mean of expression +- SD ( n = 2-4 mice/group from two to three
- Submitted by
- Invitrogen Antibodies (provider)
- Main image
- Experimental details
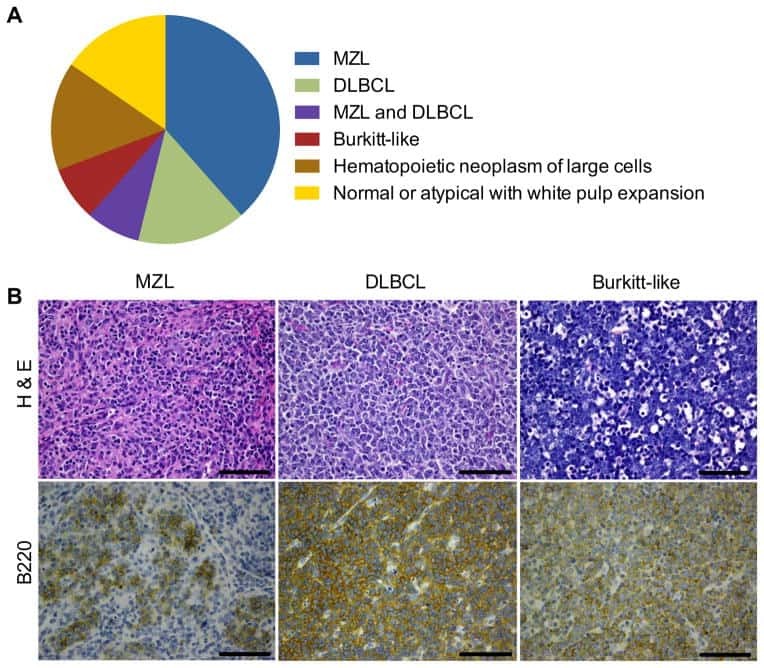
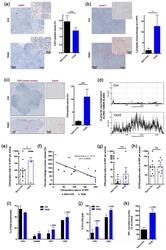
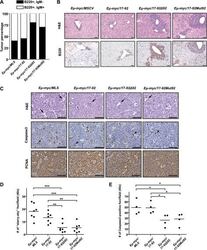
- Figure 2. The miR-92 deficient mir-17-92 cooperates with c-Myc to promote highly aggressive B-lymphomas. ( A ) The percentage of IgM positive and IgM negative B-lymphomas was calculated for each genotype ( Emu-myc/MSCV, n = 10 ; Emu-myc/17-92, n = 9; Emu-myc/17-92Delta92, n = 10; Emu-myc/17-92Mut92, n = 10). ( B ) The Emu-myc/17-92Mut92 and Emu-myc/17-92Delta92 mice developed high grade B-lymphomas that were frequently disseminated into the liver. When compared to Emu-myc/MSCV and Emu-myc/17-92 mice, Emu-myc/17-92Mut92 and Emu-myc/17-92Delta92 lymphomas gave rise to more liver dissemination, as indicated by H&E and B220 staining. ( C ) Emu-myc/17-92Mut92 and Emu-myc/17-92Delta92 lymphomas exhibited a decreased apoptosis compared to Emu-myc/MSCV or Emu-myc/17-92 lymphomas. Representative lymphomas were stained for H&E, cleaved caspase-3 and PCNA. Arrow, 'starry sky' feature of apoptotic lymphoma cells; arrowhead, apoptotic cells with positive staining for cleaved caspase-3; scale bar, 50 mum. ( D and E ) Apoptosis was quantitatively measured in representative lymphomas of each genotype using the 'starry sky' features ( D ) and cleaved caspase-3 staining ( E ). *p < 0.05, **p < 0.01, ***p < 0.001. DOI: http://dx.doi.org/

- Submitted by
- Invitrogen Antibodies (provider)
- Main image
- Experimental details
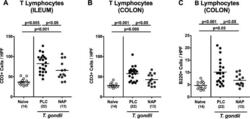
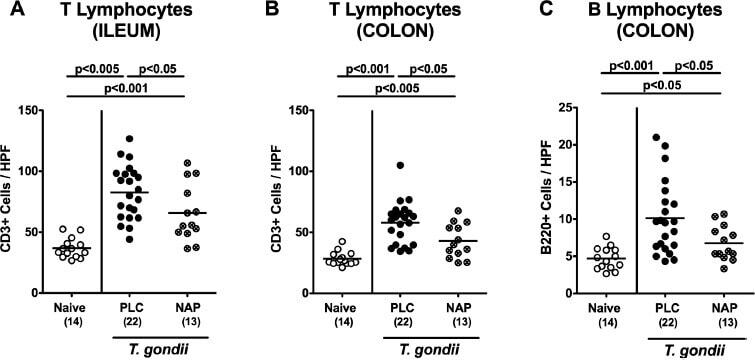
- Figure 1. Intestinal immune cell responses upon NAP treatment of human microbiota-associated mice suffering from subacute ileitis. Subacute ileitis was induced in human microbiota-associated (hma) mice on day 0 by peroral low-dose T. gondii infection as described in Materials and Methods section. Hma mice were then treated with synthetic NAP (crossed circles) or placebo (PLC; black circles) from day 1 until day 8 postinfection (p.i.). At day 9 p.i., the average numbers of (A) ileal and (B) colonic T lymphocytes (positive for CD3) and of (C) colonic B lymphocytes (positive for B220) were determined microscopically in immunohistochemically stained intestinal paraffin sections from six high power fields (HPF, 400x magnification) per animal. Naive mice (i.e., without ileitis and without treatment; white circles) served as negative controls. Numbers of animals (in parentheses), means, and significance levels ( p values) determined by Mann-Whitney U test are indicated. Data shown were pooled from four independent experiments
- Submitted by
- Invitrogen Antibodies (provider)
- Main image
- Experimental details
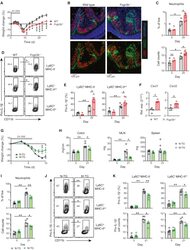
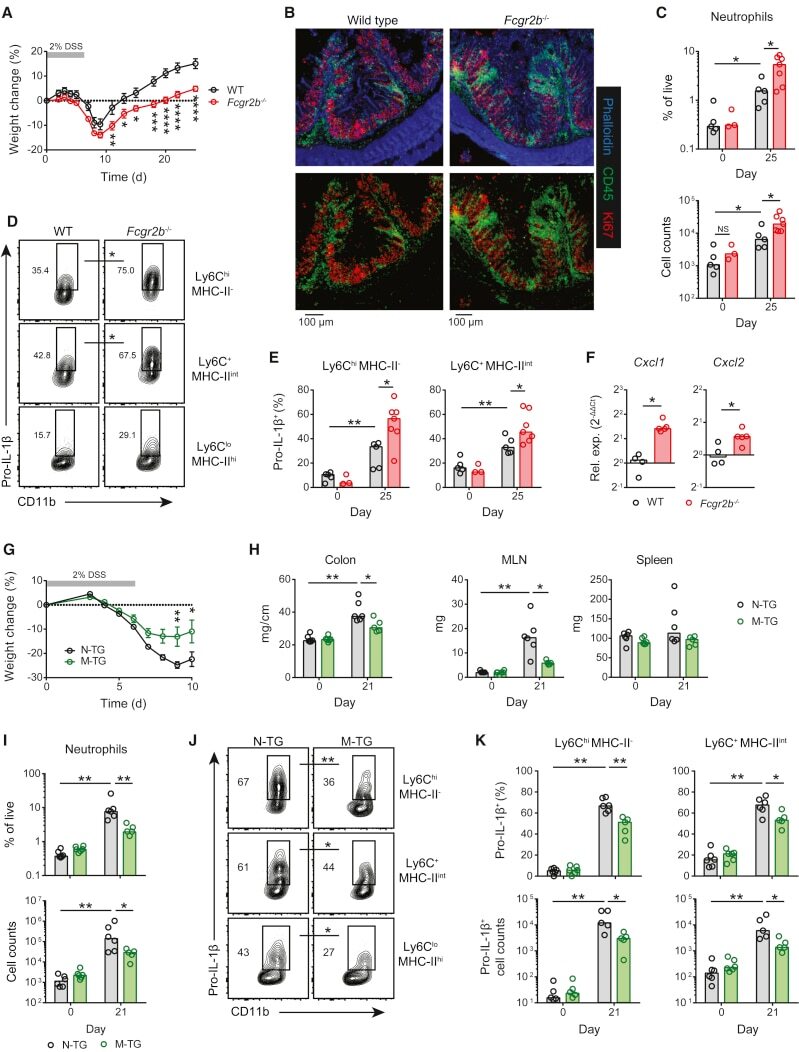
- Figure 5 MNP FcgammaR A:I Ratio Modulates Intestinal Inflammation (A) Weight loss in co-housed sex-matched WT (black circles, n = 8) and Fcgr2b -/- (red circles, n = 9) mice after a single 6-day course of 2% DSS. Means +- SEM are indicated. Data are representative of 3 independent experiments. (B) Confocal microscopy of colonic CD45 + leukocytes in mice treated as in (A). Data are representative of 2 independent experiments. (C) Flow-cytometric quantification of colonic neutrophil frequency (top) and absolute neutrophil counts (bottom) in WT and Fcgr2b -/- colons at day 25 after aDSS (n = 5-7 per group) or in healthy controls (day 0) (n = 3-5 per group). Medians are indicated. Data are representative of 3 independent experiments. (D) Pro-IL-1beta expression by colonic CD11b + CX3CR1 + MNPs at day 25 after aDSS (n = 5-7 per group). (E) Frequency of pro-IL-1beta expression within the Ly6C hi MHC-II - monocyte and Ly6C + MHC-II int macrophage populations as shown in aDSS (n = 5-7 per group) versus controls (day 0) (n = 3-5 per group). Medians are indicated. Data are representative of 3 independent experiments. (F) Chemokine mRNA levels in flow-sorted Ly6C lo MHC-II hi colonic macrophages at day 21 after aDSS (n = 4-5 per group). Data normalized to WT mRNA levels. Medians are indicated. (G and H) Weight loss (G) and clinical colonic and lymphoid organ features (H) of co-housed sex-matched M-TG (green circles, n = 5 or 6) and N-TG littermate controls (black circles, n = 6) after a
- Submitted by
- Invitrogen Antibodies (provider)
- Main image

- Experimental details
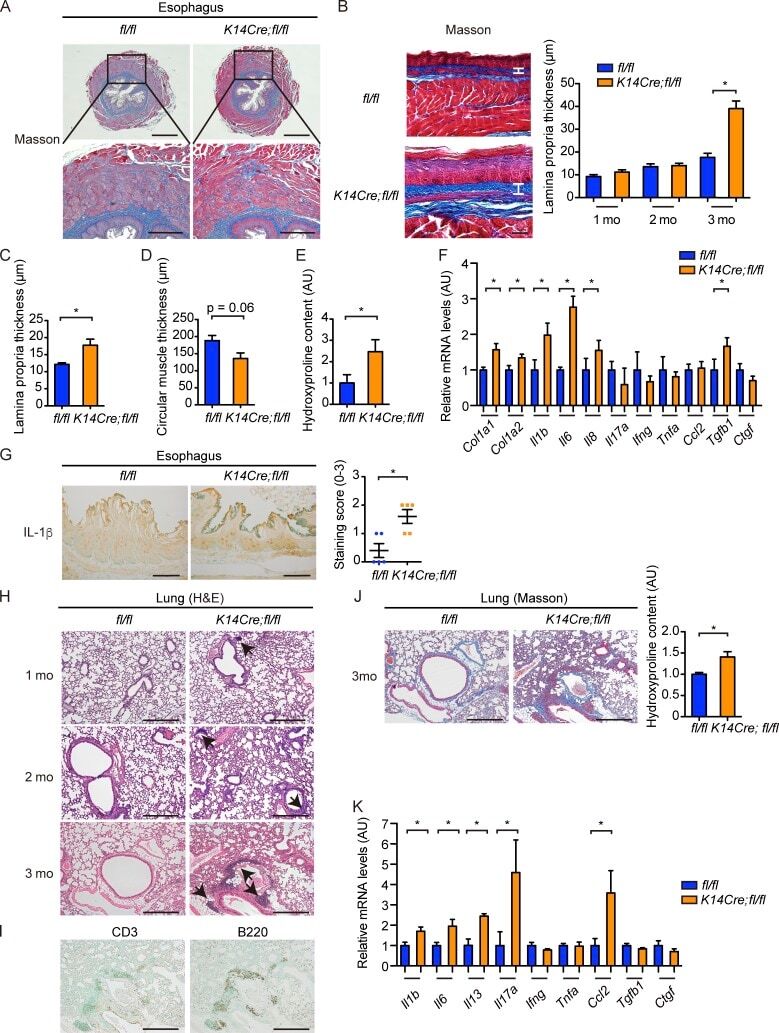
- Figure 4. K14Cre;fl/fl mice develop esophageal fibrosis and ILD. (A) Masson-Trichrome staining of the lower esophagus of 3-mo-old fl/fl and K14Cre; fl/fl mice. (Bottom) Higher magnification images of the regions indicated by squares in the top panels. Bars: (top) 500 um; (bottom) 200 um. (B) The lower esophagi were cut along the longitudinal direction, spread on sheets, fixed in formalin, and embedded in the paraffin. Masson-Trichrome staining was performed, and the thickness of the lamina propria was evaluated at the ages of 1, 2, and 3 mo. Vertical bars represent lamina propria thickness. Bars, 50 um. (C) The thickness of lamina propria at upper (thoracic) esophagus was evaluated at the age of 3 mo. (D) The thickness of the circular muscle layer was evaluated in the sections of 3-mo-old mice. (E) Hydroxyproline contents of the lower esophagus were compared between these two strains of mice at the age of 3 mo. (F) mRNA levels of type I collagen, cytokines, chemokines, and growth factors in the lower esophagi of 3-mo-old mice were assessed. (G) The lower esophagus sections from 3-mo-old mice were immunohistochemically stained for IL-1beta. Bars, 50 um. (Right) The graph shows the result of semiquantitative scoring of the staining intensity. (H) H&E staining of the lungs from 1-, 2-, and 3-mo-old fl/fl and K14Cre;fl/fl mice. Arrows indicate the peribronchial lymphocyte aggregates. Bars, 200 um. (I) Infiltrating inflammatory cells were immunohistochemically stained for CD3 and
- Submitted by
- Invitrogen Antibodies (provider)
- Main image
- Experimental details
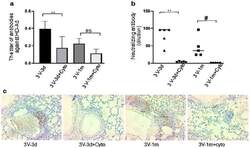
- Figure 4 Host humoral immune responses to vector delivery. ( a ) The titer of anti-adenoviral antibodies in mouse bronchoalveolar lavage fluid (BALF). The total anti-Ad antibodies (IgA, IgE, IgGs, IgM) were detected with ELISA in all groups. Data were presented as mean +- SD (standard deviation). ( b ) Neutralizing antibody in mouse BALF. n = 5, #: p < 0.05; **: p < 0.01. ( c ) B-cell presence in mouse lungs. B-cells were detected in mouse lungs with antibodies against B220 by immunohistochemistry staining. The positive cells are shown in brown color. ns, no significant difference.

- Submitted by
- Invitrogen Antibodies (provider)
- Main image

- Experimental details
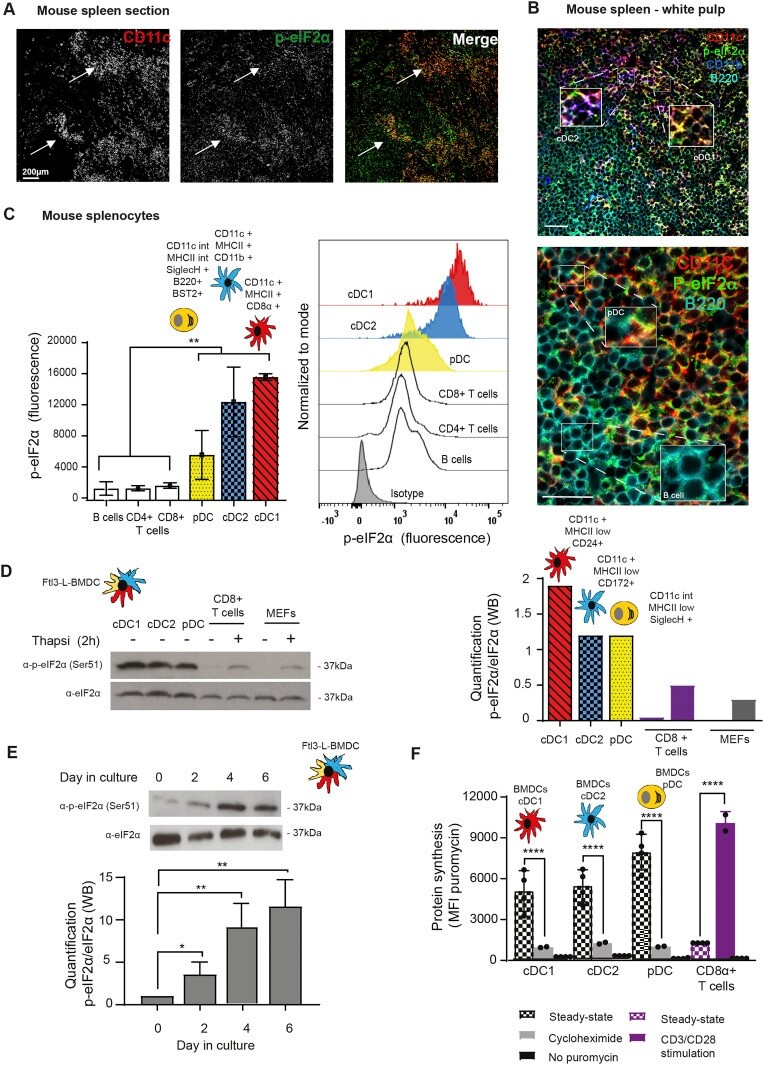
- Figure 1. Steady-state Flt3-L BMDCs and splenic DCs display remarkably high levels of eIF2alpha without inhibition of translation. (A) Immunohistochemistry of mouse spleen with staining for CD11c (red) and p-eIF2alpha (green). Scale bar: 200 mum, magnification: 10x. Single color images are shown and merged picture (right row), high level of p-eIF2alpha staining is mostly found co-localizing in cells positive for CD11c+ (DCs, white arrowheads). (B) Immunohistochemistry of mouse spleen in the white pulp for CD11c (red), p-eIF2alpha (green), CD11b (blue), and B220 (turquoise). Scale bars: 50 mum, magnification: 40x. In the upper panel, magnified areas show p-eIF2 detection in cDC2 (CD11c+/CD11b+) and cDC1 (CD11c+/CD11b-). In the lower panel, magnified areas show p-eIF2 detection in pDCs (B220+/CD11c+) and in B cells (B220+ and CD11c-). (C) Relative p-eIF2alpha levels measured by flow in different mouse spleen populations. Statistical analysis was performed by Mann-Whitney test. ** P < 0.01. (D) Levels of p-eIF2alpha and total eIF2alpha were measured in DC populations by immunoblot. Sorted steady-state Flt3-L BMDCs were compared with MEFs and freshly isolated CD8alpha+ T cells stimulated or not with thapsigargin (Tg) for 2 h (200 nM). Ratio of p-eIF2alpha/eIF2alpha is quantified in the graph of the lower panel. (E) Levels of p-eIF2alpha and total eIF2alpha were measured in bulk Flt3-L BMDCs during different days of BM differentiation in vitro. (F) Levels of protein synthesis were
- Submitted by
- Invitrogen Antibodies (provider)
- Main image

- Experimental details
- Fig 1 Agriculture (swine) exposure-related Organic Dust Extract (ODE) induced airway inflammation coupled with Collagen Induced Arthritis (CIA) model. ( A ) Line graph depicts mean with SE bars of arthritis inflammatory score at respective time points from treatment groups. Statistical difference versus sham denoted as ""a"" (p