 Explore
 Validate
 Learn
Learn Other assay
Antibody data
- Antibody Data
- Antigen structure
- References [2]
- Comments [0]
- Validations
- Other assay [3]
Submit
Validation data
Reference
Comment
Report error
- Product number
- BMS120FI - Provider product page

- Provider
- Invitrogen Antibodies
- Product name
- ErbB2 (HER-2) Monoclonal Antibody (2G11), FITC, eBioscience™
- Antibody type
- Monoclonal
- Antigen
- Other
- Description
- Description: The antibody (2G11) can be used to stain cryostat sections or cell smears. BMS120 is also suitable as primary antibody in staining for FACS analysis, BMS120FI can be used for direct staining of cells, BMS120BT can be used in a 2-step procedure using the biotin-(strept)avidin system.
- Conjugate
- Green dye
- Antibody clone number
- 2G11
- Concentration
- 10 µL/Test
Submitted references Comparative Analysis of Cell-Cell Contact Abundance in Ovarian Carcinoma Cells Cultured in Two- and Three-Dimensional In Vitro Models.
Hepatitis C Virus Activates a Neuregulin-Driven Circuit to Modify Surface Expression of Growth Factor Receptors of the ErbB Family.
Kutova OM, Sencha LM, Pospelov AD, Dobrynina OE, Brilkina AA, Cherkasova EI, Balalaeva IV
Biology 2020 Dec 4;9(12)
Biology 2020 Dec 4;9(12)
Hepatitis C Virus Activates a Neuregulin-Driven Circuit to Modify Surface Expression of Growth Factor Receptors of the ErbB Family.
Stindt S, Cebula P, Albrecht U, Keitel V, Schulte am Esch J, Knoefel WT, Bartenschlager R, Häussinger D, Bode JG
PloS one 2016;11(2):e0148711
PloS one 2016;11(2):e0148711
No comments: Submit comment
Supportive validation
- Submitted by
- Invitrogen Antibodies (provider)
- Main image

- Experimental details
- Fig 1 HCV suppresses expression of ErbB3 and modulates the expression of EGFR and ErbB2 to various extents. For (A) and (B) the hepatoma cell lines Huh7 and Huh7.5 were cultured for 48 hours while primary human hepatocytes (PHH) were isolated and cultured for 24 hours. Subsequently (A) total mRNA was analysed for transcript abundance of EGFR, ErbB2, ErbB3 and ErbB4 by rtPCR and for (B) total protein lysates were prepared and protein expression of EGFR, ErbB2 and ErbB3 was analysed by immunoblot using specific antibodies. beta-actin or GAPDH levels were determined as loading controls. For (C) to (E) Huh cell lines harbouring the subgenomic replicon of HCV genotype 1b and the respective control cell line Huh7 cells were cultured for 48 hours and thereafter for (C) total RNA and for (D and E) total protein extracts were prepared and analysed for the abundance of EGFR, ErbB2, ErbB3 and ErbB4 transcripts (C) or for the protein levels of ErbB3 (D) as well as EGFR and ErbB2 (E). Additionally, NS3 expression was assessed for control of replication and beta-actin levels for loading control. For (F) Huh9-13 cells were cultured for 24 hours and subsequently treated with 2-C'-Methylcytidine as indicated. After an additional 48 hours total protein extracts were prepared and analysed for ErbB3 and NS3 protein levels by immunoblot. (G and H) Huh7.5 cells were infected with 1 MOI of the HCVcc strain JC1 or left un-infected for control. Total RNA or protein lysates were prepared 48 hours
- Conjugate
- Green dye

- Submitted by
- Invitrogen Antibodies (provider)
- Main image

- Experimental details
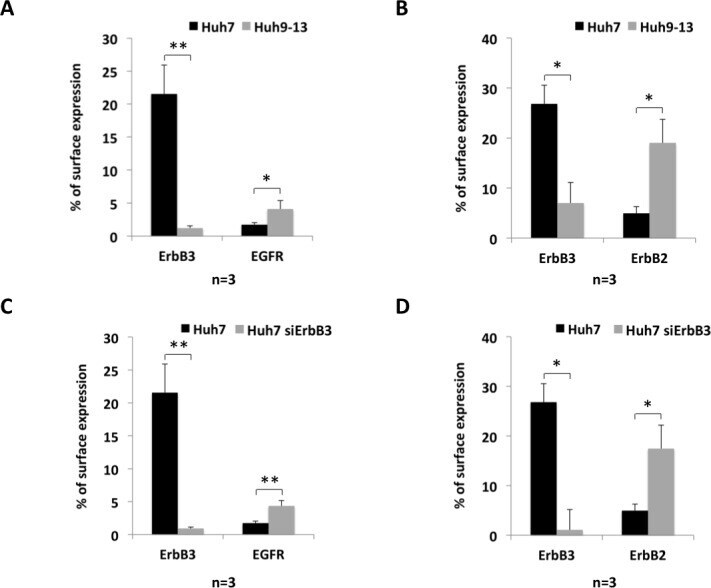
- Fig 5 Reduction of ErbB3 expression on the cell surface is accompanied by increased cell surface expression of EGFR and ErbB2. (A) and (B) Huh9-13 replicon cells were analysed by FACS to determine surface expression of ErbB3 and EGFR (A) or of ErbB3 and ErbB2 (B). (C) and (D) Huh7 cells were transfected with ErbB3 specific siRNA or with control siRNA. 72 hours later cells were prepared for FACS analysis to determine the amounts of ErbB3 and EGFR (C) or of ErbB3 and ErbB2 (D) on the cell surface. Data were analysed using the FlowJo software against the corresponding isotype controls and analysis of EGFR (A and C) or ErbB2 (B and D) surface expression was gated to cells with low expression of ErbB3. Results correspond to the average of the receptors at the cell surface (in precent); error bars indicate SEM from at least 3 independent experiments.
- Conjugate
- Green dye
- Submitted by
- Invitrogen Antibodies (provider)
- Main image

- Experimental details
- Figure 5 Human Epidermal growth factor Receptor 2 (HER2) expression level in SKOV-3 and SKOV-3.ip cells cultured in monolayer and 3D in vitro models. ( A ) The distributions of SKOV-3 cells (left plot) and SKOV-3.ip cells (right plot) according to fluorescence intensity detected after staining with HER2-specific antibodies (red--monolayer culture, blue--spheroids, green--collagen hydrogel); ( B ) HER2 expression level in monolayer and 3D models denoted as relative fluorescence values. mnlr , monolayer; sph , spheroids; clgn , collagen hydrogel. ""*"" indicates significant difference in RF level from monolayer culture (ANOVA, Holm-Sidak's multiple comparisons test, p < 0.05).
- Conjugate
- Green dye
