 Explore
 Validate
 Learn
Learn Western blot
Antibody data
- Antibody Data
- Antigen structure
- References [2]
- Comments [0]
- Validations
- Western blot [2]
- Immunohistochemistry [1]
- Flow cytometry [1]
- Other assay [5]
Submit
Validation data
Reference
Comment
Report error
- Product number
- PA5-13538 - Provider product page

- Provider
- Invitrogen Antibodies
- Product name
- Decorin Polyclonal Antibody
- Antibody type
- Polyclonal
- Antigen
- Synthetic peptide
- Description
- This antibody is predicted to react with bovine and porcine based on sequence homology.
- Reactivity
- Human, Mouse
- Host
- Rabbit
- Isotype
- IgG
- Vial size
- 400 µL
- Concentration
- 1.9 mg/mL
- Storage
- Store at 4°C short term. For long term storage, store at -20°C, avoiding freeze/thaw cycles.
Submitted references Obesity reduces mammary epithelial cell TGFβ1 activity through macrophage-mediated extracellular matrix remodeling.
Cadherin-6 type 2, K-cadherin (CDH6) is regulated by mutant p53 in the fallopian tube but is not expressed in the ovarian surface.
Chamberlin T, Thompson V, Hillers-Ziemer LE, Walton BN, Arendt LM
FASEB journal : official publication of the Federation of American Societies for Experimental Biology 2020 Jun;34(6):8611-8624
FASEB journal : official publication of the Federation of American Societies for Experimental Biology 2020 Jun;34(6):8611-8624
Cadherin-6 type 2, K-cadherin (CDH6) is regulated by mutant p53 in the fallopian tube but is not expressed in the ovarian surface.
Karthikeyan S, Lantvit DD, Chae DH, Burdette JE
Oncotarget 2016 Oct 25;7(43):69871-69882
Oncotarget 2016 Oct 25;7(43):69871-69882
No comments: Submit comment
Supportive validation
- Submitted by
- Invitrogen Antibodies (provider)
- Main image
- Experimental details
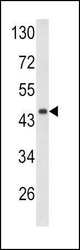
- Western blot analysis using a DCN polyclonal antibody (Product # PA5-13538) in mouse heart tissue lysates (35 µg per lane).

- Submitted by
- Invitrogen Antibodies (provider)
- Main image
- Experimental details
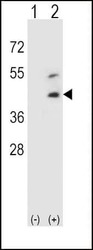
- Western blot analysis of DCN (arrow) using a DCN polyclonal antibody (Product # PA5-13538) in 293 cell lysates (2 µg/lane) either nontransfected (Lane 1) or transiently transfected (Lane 2) with the DCN gene.

Supportive validation
- Submitted by
- Invitrogen Antibodies (provider)
- Main image
- Experimental details
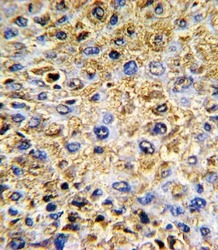
- Immunohistochemical analysis of formalin-fixed, paraffin-embedded human hepatocarcinoma tissue using a DCN polyclonal antibody (Product # PA5-13538), followed by HRP-conjugated secondary antibody and DAB staining.

Supportive validation
- Submitted by
- Invitrogen Antibodies (provider)
- Main image

- Experimental details
- Flow cytometry analysis of HepG2 cells using a DCN polyclonal antibody (Product # PA5-13538) (bottom) compared to a negative control cell (top) at a dilution of 1:10-50, followed by a FITC-conjugated goat anti-rabbit antibody

Supportive validation
- Submitted by
- Invitrogen Antibodies (provider)
- Main image

- Experimental details
- Figure 3 CDH6 is repressed by mutant p53 in murine oviducts A. qPCR data on the pro-migratory genes mRNA levels from PAX8 cre/+ p53 R270H/+ oviducts relative to Pax8 cre/+ oviducts. B. Immunohistochemistry analysis of CDH6, DCN and p53 staining in Pax8 cre/+ and PAX8 cre/+ p53 R270H/+ oviducts C. Immunohistochemistry on human fallopian tube for CDH6, DCN and p53. Black arrow indicates positive staining. Scale bars = 100 mum. D. Immunohistochemistry on human ovaries for CDH6 and CK8. Black arrow indicates positive staining. Scale bars = 20 mum. E. CDH6 western blot in normal human IOSE cells. Actin is used as loading control. Data represent mean +- SEM. Student t -test was used to determine significance, (* p < 0.05) relative to control.

- Submitted by
- Invitrogen Antibodies (provider)
- Main image

- Experimental details
- Figure 1 Comparative pro-migratory gene expression levels in MOE and MOSE cells Pro-migratory mRNA levels were measured by qPCR in MOE and MOSE cells with p53 mutation and normalized to their respective controls. A. MOEp53 R270H relative to MOE Floxed control cells. Cell lysates were probed with CDH6 and DCN antibodies. alpha - Tubulin is used as a loading control. B. Western blot on MOE Floxed and MOEp53 R270H cells. C. Densitometry analysis of MOEp53 R270H relative to MOE Floxed control cells. D. qPCR data obtained from MOEp53 R273H relative to MOE Neo control cells. E. Western blot on MOE Neo and MOEp53 R273H cells. F. Densitometry analysis of MOEp53 R273H relative to MOE Neo control cells. G. qPCR data obtained from MOSEp53 R270H relative to MOSE Floxed control cells. H. Western blot on MOSE Floxed and MOSEp53 R270H cells. Data represent mean +- SEM. Student t -test was used to determine significance, (* p < 0.05) relative to control.

- Submitted by
- Invitrogen Antibodies (provider)
- Main image

- Experimental details
- Figure 2 p53 R248W reduces CDH6 expression and increases migration in MOE cells A. qPCR analysis on MOEp53 R248W cells relative to MOE Neo control cells. Cell lysates were probed with CDH6 and DCN antibodies. alpha - Tubulin is used as a loading control. B. Western blot on MOE Neo and MOEp53 R248W cells. C. Densitometry analysis of MOEp53 R248W relative to MOE Neo control cells. D. Migration assay of MOE Neo , MOEp53 R273H , and MOEp53 R248W cells 8 hours after wounding. E. FOXM1 and SLUG western blot. alpha - Tubulin is used as loading control. F. Densitometry analysis on relative FOXM1 and SLUG protein levels compared to empty vector cells. Data represent mean +- SEM. Data was analyzed with a student t -test (* p < 0.05 relative to control) or one-way ANOVA (a-c or A-B bar without common letter differ, p < 0.05).

- Submitted by
- Invitrogen Antibodies (provider)
- Main image

- Experimental details
- FIGURE 2 Obesity enhances decorin around mouse mammary ducts and in lobules of women. A, Western analysis and quantification of decorin from FVB/N mouse mammary glands (n = 4 mice/group). B, Decorin expression in ECM surrounding adipocytes within FVB/N mouse mammary glands (n = 5 mice/group). C, Percent area of decorin in ECM surrounding mouse mammary ducts (n = 5 mice/group). D, Western analysis and quantification of decorin from breast tissue of women (n = 4 samples/group). E, Representative images of breast tissue from obese women (BMI > 30) stained for Hematoxylin and Eosin (H&E) and decorin. F, Percent area of decorin in ECM within breast lobules of women (n = 6 samples/group). Data analyzed with Student's t test, mean +- SEM. Magnification bar = 50 um

- Submitted by
- Invitrogen Antibodies (provider)
- Main image

- Experimental details
- FIGURE 3 TGFbeta1 associated with decorin in ECM enhances SMA expression in breast ASCs. A, Western analysis of whole breast tissue and isolated ECM protein fraction for decorin (35 kDa), latent TGFbeta1 (47 kDa), and GAPDH (36 kDa) (n = 3 breast samples). B, Immunoprecipitation of decorin and Western analysis to detect latent TGFbeta1 (47 kDa) in protein isolated from whole mammary glands of FVB/N HFD-fed mice and breast tissue from obese women (BMI > 30). Dimers of the active form of TGFbeta1 (25 kDa) were also observed in the mouse samples. Representative blots from three experiments. C, SMA expression in breast ASCs cultured on collagen I and treated with vehicle, recombinant TGFbeta1 or TGFbeta1 and TGFbeta1 inhibitor, SB431542 (n = 3 experiments; one way ANOVA analysis with Tukey's multiple comparison posttest). D, SMA expression in breast ASCs cultured on isolated ECM with vehicle or SB431542 (n = 3 experiments; Student's t test). Bars represent mean +- SEM. Magnification bar = 50 um
