Explore
 Validate
 Learn
Learn Western blot
Antibody data
- Antibody Data
- Antigen structure
- References [11]
- Comments [0]
- Validations
- Western blot [10]
- Immunocytochemistry [4]
- Immunohistochemistry [4]
- Other assay [13]
Submit
Validation data
Reference
Comment
Report error
- Product number
- PA5-20839 - Provider product page

- Provider
- Invitrogen Antibodies
- Product name
- SQSTM1 Polyclonal Antibody
- Antibody type
- Polyclonal
- Antigen
- Synthetic peptide
- Description
- A suggested positive control is human spleen tissue lysate.
- Concentration
- 1 mg/mL
Submitted references NBR1 is a critical step in the repression of thermogenesis of p62-deficient adipocytes through PPARγ.
Sinoporphyrin sodium is a promising sensitizer for photodynamic and sonodynamic therapy in glioma.
Long Term Pharmacological Perturbation of Autophagy in Mice: Are HCQ Injections a Relevant Choice?
Aggresome-Like Formation Promotes Resistance to Proteotoxicity in Cells from Long-Lived Species.
The Second Case of Saposin A Deficiency and Altered Autophagy.
δ-Tocotrienol induces apoptosis, involving endoplasmic reticulum stress and autophagy, and paraptosis in prostate cancer cells.
Chick Embryo: A Preclinical Model for Understanding Ischemia-Reperfusion Mechanism.
Systemic overexpression of SQSTM1/p62 accelerates disease onset in a SOD1(H46R)-expressing ALS mouse model.
Dual role of autophagy on docetaxel-sensitivity in prostate cancer cells.
Ubiquitin-mediated regulation of the E3 ligase GP78 by MGRN1 in trans affects mitochondrial homeostasis.
Mahogunin regulates fusion between amphisomes/MVBs and lysosomes via ubiquitination of TSG101.
Huang J, Linares JF, Duran A, Xia W, Saltiel AR, Müller TD, Diaz-Meco MT, Moscat J
Nature communications 2021 May 17;12(1):2876
Nature communications 2021 May 17;12(1):2876
Sinoporphyrin sodium is a promising sensitizer for photodynamic and sonodynamic therapy in glioma.
An YW, Liu HQ, Zhou ZQ, Wang JC, Jiang GY, Li ZW, Wang F, Jin HT
Oncology reports 2020 Oct;44(4):1596-1604
Oncology reports 2020 Oct;44(4):1596-1604
Long Term Pharmacological Perturbation of Autophagy in Mice: Are HCQ Injections a Relevant Choice?
Masson JD, Blanchet B, Periou B, Authier FJ, Mograbi B, Gherardi RK, Crépeaux G
Biomedicines 2020 Mar 1;8(3)
Biomedicines 2020 Mar 1;8(3)
Aggresome-Like Formation Promotes Resistance to Proteotoxicity in Cells from Long-Lived Species.
Sunchu B, Riordan RT, Yu Z, Almog I, Dimas-Munoz J, Drake AC, Perez VI
The journals of gerontology. Series A, Biological sciences and medical sciences 2020 Jul 13;75(8):1439-1447
The journals of gerontology. Series A, Biological sciences and medical sciences 2020 Jul 13;75(8):1439-1447
The Second Case of Saposin A Deficiency and Altered Autophagy.
Kose M, Demir SA, Akinci G, Eraslan C, Yilmaz U, Ceylaner S, Yildirim ES, Seyrantepe V
JIMD reports 2019;44:43-54
JIMD reports 2019;44:43-54
δ-Tocotrienol induces apoptosis, involving endoplasmic reticulum stress and autophagy, and paraptosis in prostate cancer cells.
Fontana F, Moretti RM, Raimondi M, Marzagalli M, Beretta G, Procacci P, Sartori P, Montagnani Marelli M, Limonta P
Cell proliferation 2019 May;52(3):e12576
Cell proliferation 2019 May;52(3):e12576
Chick Embryo: A Preclinical Model for Understanding Ischemia-Reperfusion Mechanism.
Fauzia E, Barbhuyan TK, Shrivastava AK, Kumar M, Garg P, Khan MA, Robertson AAB, Raza SS
Frontiers in pharmacology 2018;9:1034
Frontiers in pharmacology 2018;9:1034
Systemic overexpression of SQSTM1/p62 accelerates disease onset in a SOD1(H46R)-expressing ALS mouse model.
Mitsui S, Otomo A, Nozaki M, Ono S, Sato K, Shirakawa R, Adachi H, Aoki M, Sobue G, Shang HF, Hadano S
Molecular brain 2018 May 29;11(1):30
Molecular brain 2018 May 29;11(1):30
Dual role of autophagy on docetaxel-sensitivity in prostate cancer cells.
Cristofani R, Montagnani Marelli M, Cicardi ME, Fontana F, Marzagalli M, Limonta P, Poletti A, Moretti RM
Cell death & disease 2018 Aug 30;9(9):889
Cell death & disease 2018 Aug 30;9(9):889
Ubiquitin-mediated regulation of the E3 ligase GP78 by MGRN1 in trans affects mitochondrial homeostasis.
Mukherjee R, Chakrabarti O
Journal of cell science 2016 Feb 15;129(4):757-73
Journal of cell science 2016 Feb 15;129(4):757-73
Mahogunin regulates fusion between amphisomes/MVBs and lysosomes via ubiquitination of TSG101.
Majumder P, Chakrabarti O
Cell death & disease 2015 Nov 5;6(11):e1970
Cell death & disease 2015 Nov 5;6(11):e1970
No comments: Submit comment
Supportive validation
- Submitted by
- Invitrogen Antibodies (provider)
- Main image

- Experimental details
- Western blot analysis of SQSTM1 was performed by loading 30 µg of THP-1 whole cell lysates per well onto an SDS-PAGE gel. Proteins were transferred to a PVDF membrane and blocked with 5% non-fat dry milk in TBST for 1 hour at room temperature. The membrane was probed with a SQSTM1 polyclonal antibody (Product # PA5-20839) at a dilution of 1:1000 overnight at 4°C, washed in TBST, and probed with an HRP-conjugated goat anti-rabbit IgG secondary antibody at a dilution of 1:40,000 for 1 hour at room temperature. Detection was performed using ECL substrate. Data courtesy of the Innovators Program.

- Submitted by
- Invitrogen Antibodies (provider)
- Main image

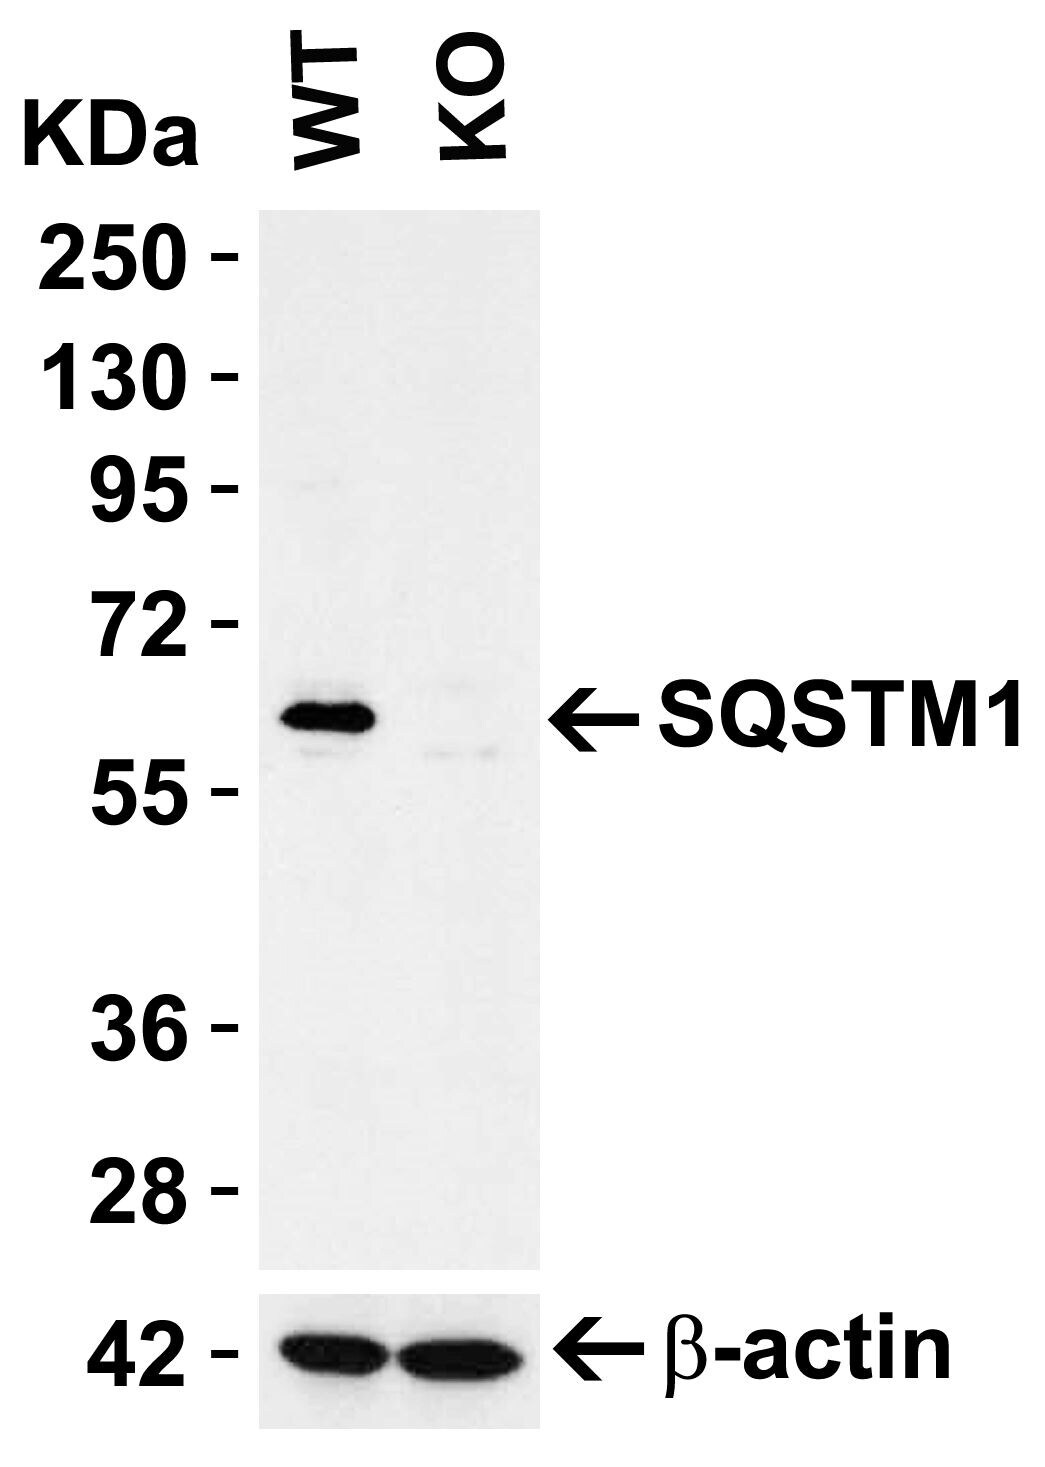
- Experimental details
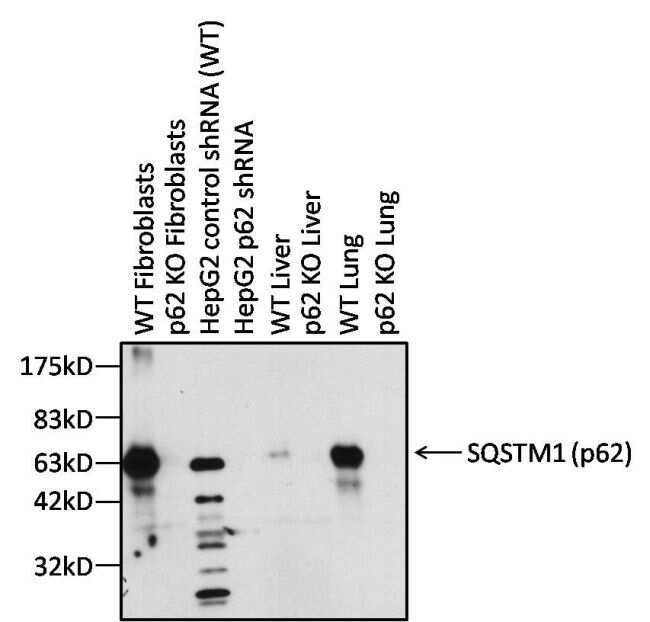
- Western blot analysis of SQSTM1 was performed by loading 20 µg of the indicated wild type (WT) or knock-out (KO) cell lines or tissues per well onto an SDS-PAGE gel. Proteins were transferred to a PVDF membrane and blocked with 5% Milk in TBST for 30 minutes at room temperature. The membrane was probed with a SQSTM1 polyclonal antibody (Product # PA5-20839) at a dilution of 1:6000 overnight at 4C, washed in TBST, and probed with an HRP-conjugated goat anti-rabbit IgG F (ab’)2 secondary antibody (Product # 31461) at a dilution of 1:3000 for one hour at room temperature. Detection was performed using ECL Substrate (Product # 32106). Data courtesy of the Innovators Program.
- Submitted by
- Invitrogen Antibodies (provider)
- Main image
- Experimental details
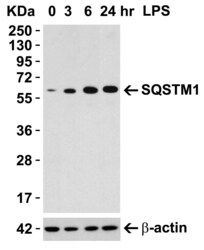
- Western Blotting in Mouse Macrophage Cells using SQSTM1 Polyclonal Antibody (Product # PA5-20839) (0.5 µg/mL). 1h incubation at RT in 5% NFDM/TBST. Secondary: Goat anti-rabbit IgG HRP conjugate at 1:10,000 dilution. 15 µg of lysates loaded per lane. Raw 264.7 cells were treated with LPS (0.3 µg/mL) for different time period (0-24 hrs). There was an increase in SQSTM1 protein expression overtime after LPS treatment.

- Submitted by
- Invitrogen Antibodies (provider)
- Main image
- Experimental details
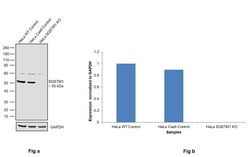
- Knockout of SQSTM1 was achieved by CRISPR-Cas9 genome editing using LentiArray™ Lentiviral sgRNA (Product # A32042, Assay ID CRISPR970861_LV) and LentiArray Cas9 Lentivirus (Product # A32064). Western blot analysis of SQSTM1 was performed by loading 30 µg of HeLa Wild Type (Lane 1), HeLa Cas9 (Lane 2) andHela SQSTM1 KO (Lane 3) whole cell extracts. The samples were electrophoresed using NuPAGE™ Novex™ 4-12% Bis-Tris Protein Gel (Product # NP0322BOX). Resolved proteins were then transferred onto a nitrocellulose membrane (Product # IB23001) by iBlot® 2 Dry Blotting System (Product # IB21001). The blot was probed with Anti-SQSTM1 Polyclonal Antibody (Product # PA5-20839, 0.75 µg/mL dilution) and Goat anti-Rabbit IgG (H+L) Superclonal™ Recombinant Secondary Antibody, HRP (Product # A27036, 1:6,000 dilution) using the iBright FL 1000 (Product # A32752). Chemiluminescent detection was performed using Novex® ECL Chemiluminescent Substrate Reagent Kit (Product # WP20005). Loss of signal upon CRISPR mediated knockout (KO) using the LentiArray™ CRISPR product line confirms that antibody is specific to SQSTM1. Uncharacterized band was observed in all the samples at 60 kDa.

- Submitted by
- Invitrogen Antibodies (provider)
- Main image

- Experimental details
- Western Blot analysis of SQSTM1 in HEK293T WT or SQSTM1 KO cells. Lysates (10 µg) were loaded onto SDS-PAGE and blots were probed with SQSTM1 Polyclonal Antibody (Product # PA5-20839) diluted to 1 µg/mL and anti-beta actin diluted to 1 µg/mL. 1 h incubation at RT in 0.05 NFDM/TBST. Secondary: Goat Anti-Rabbit IgG HRP conjugate at 1:10,000 dilution.
- Submitted by
- Invitrogen Antibodies (provider)
- Main image

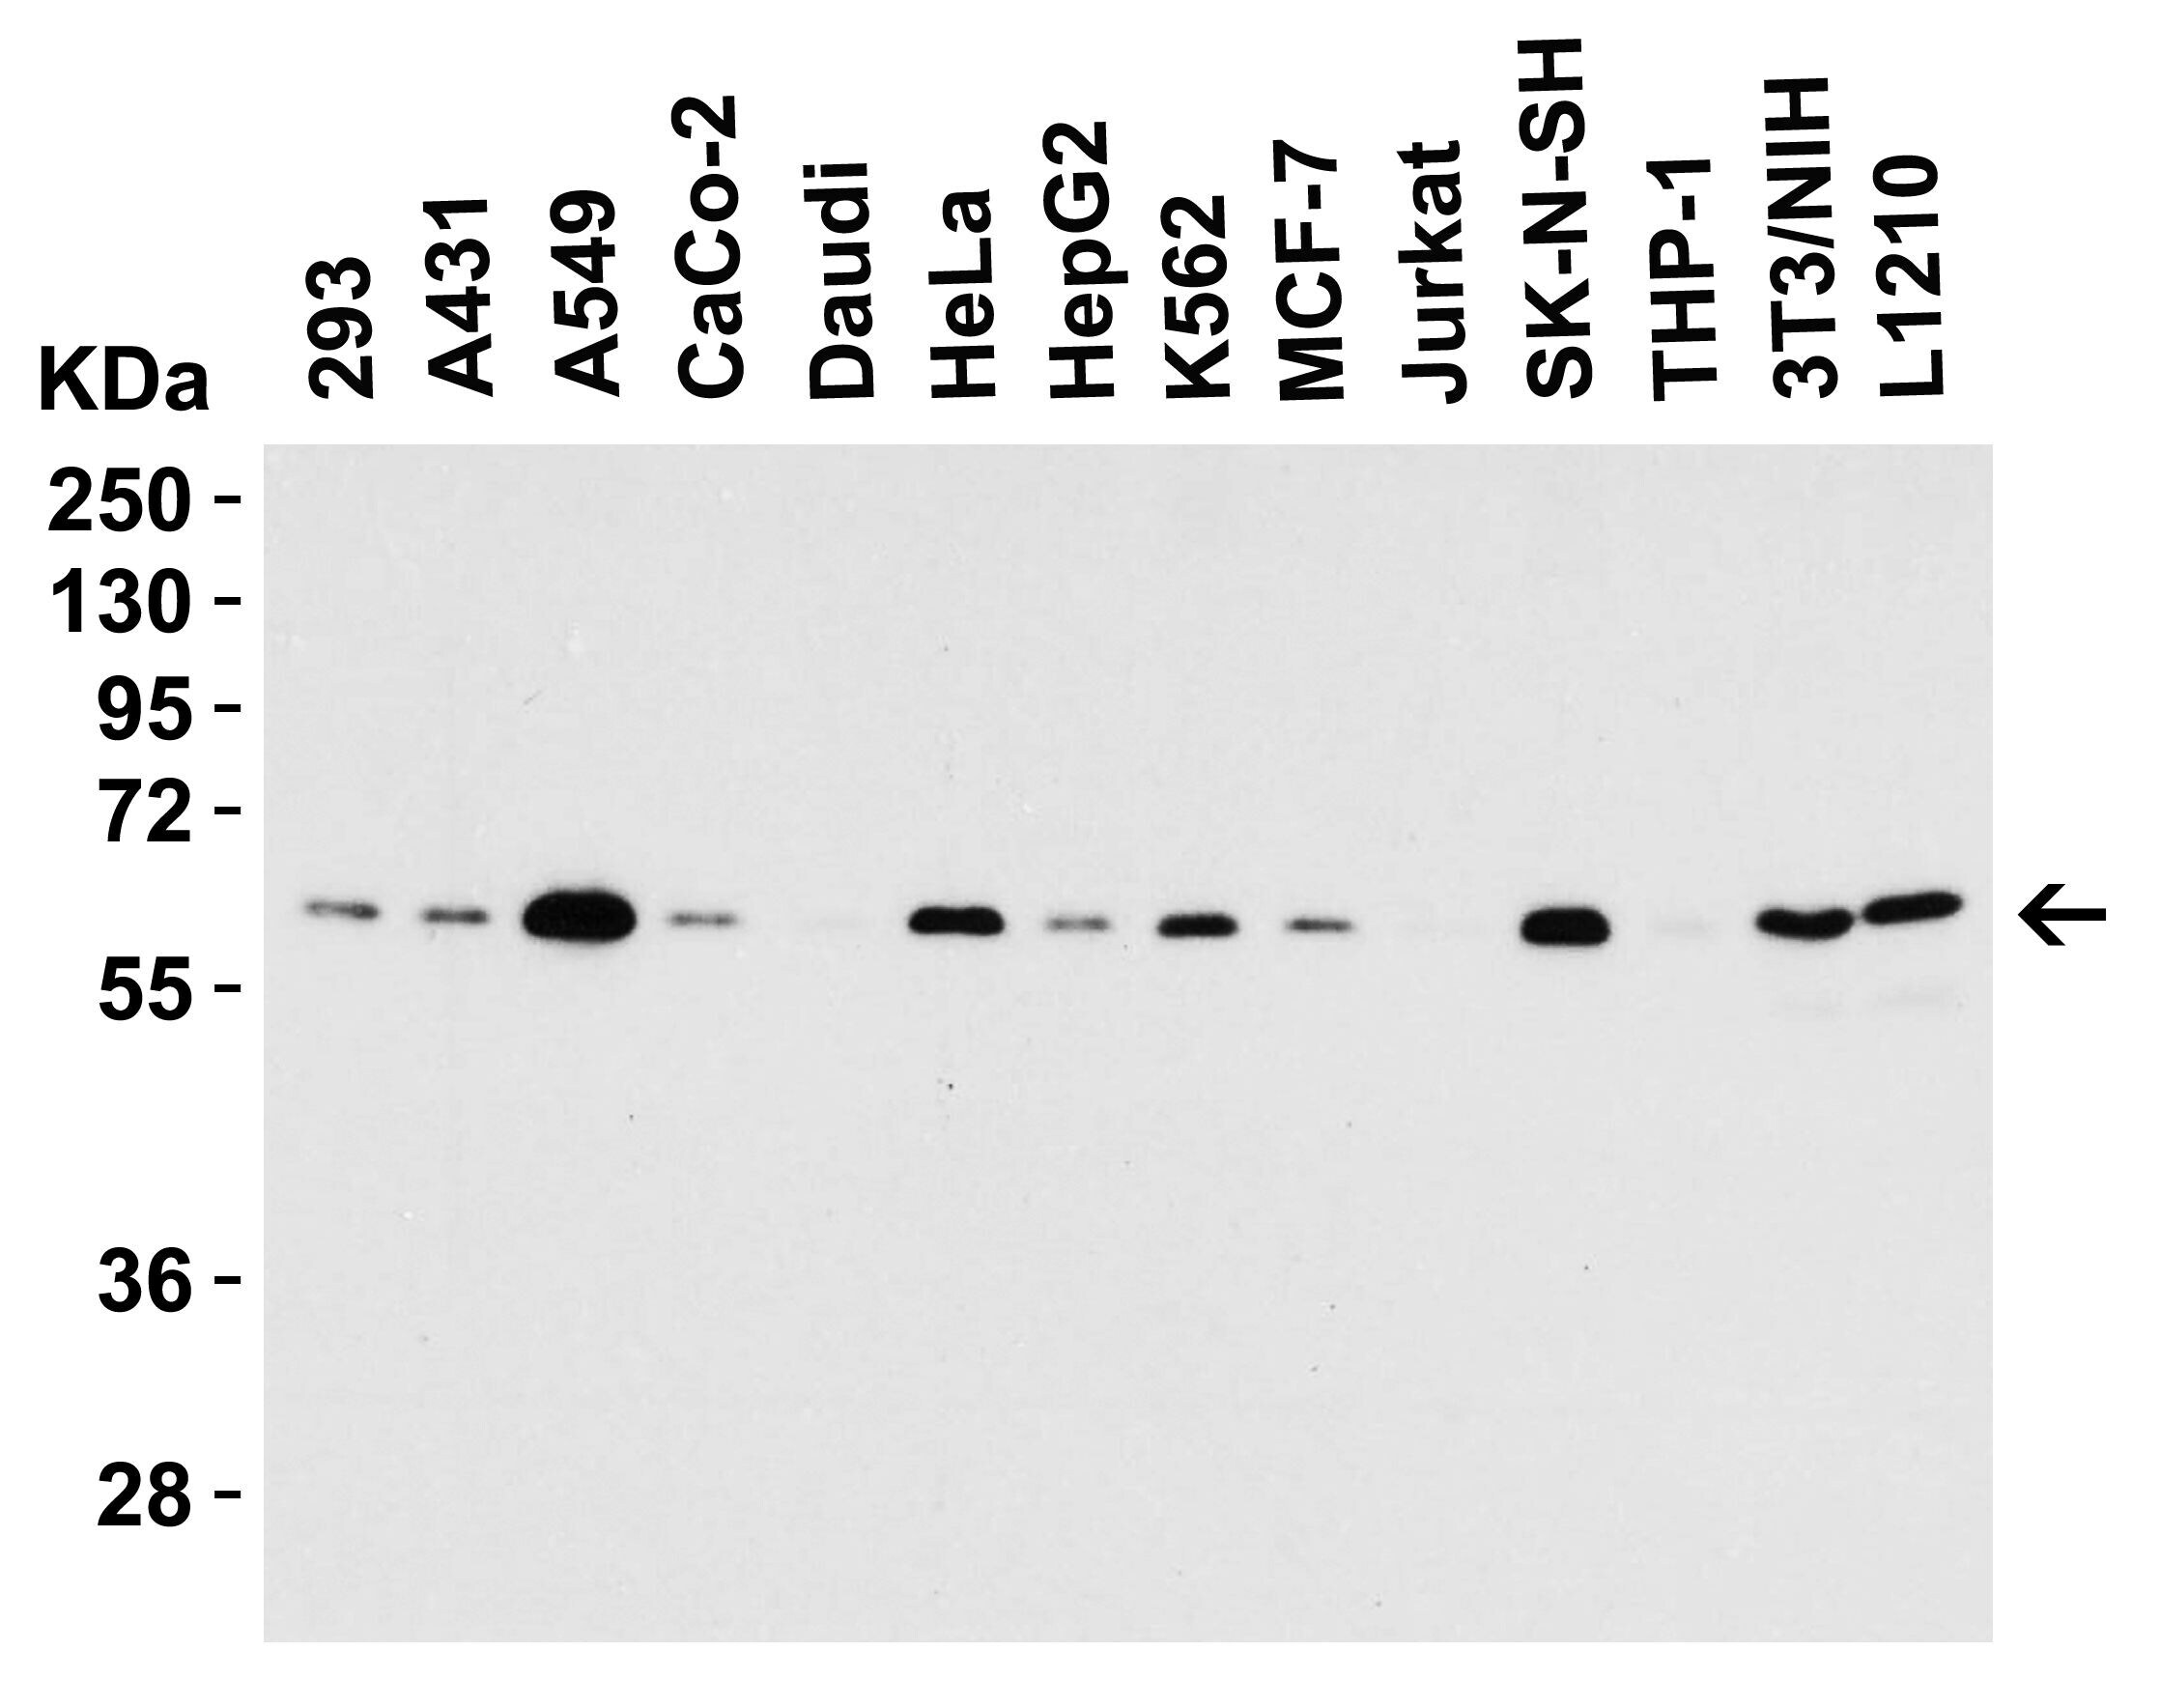
- Experimental details
- Western Blot Validation in Cell Lines. Loading: 15 µg of lysates per lane. Antibodies: SQSTM1 Polyclonal Antibody (Product # PA5-20839) (0.5 µg/mL), 1h incubation at RT in 0.05 NFDM/TBST. Secondary: Goat anti-rabbit IgG HRP conjugate at 1:10,000 dilution.
- Submitted by
- Invitrogen Antibodies (provider)
- Main image

- Experimental details
- Western Blot Validation in Human K562 Cell Lysate. Loading: 15 µg of lysates per lane. Antibodies: SQSTM1 Polyclonal Antibody (Product # PA5-20839) (1 µg/mL), 1h incubation at RT in 0.05 NFDM/TBST. Secondary: Goat anti-rabbit IgG HRP conjugate at 1:10,000 dilution. (A) No blocking peptide (B) With blocking peptide

- Submitted by
- Invitrogen Antibodies (provider)
- Main image
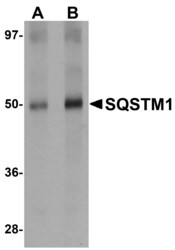
- Experimental details
- Western Blot Validation in Human Spleen Tissue Lysate. Loading: 15 µg of lysates per lane. Antibodies: SQSTM1 Polyclonal Antibody (Product # PA5-20839) (A: 1 µg/mL, B: 2 µg/mL), 1h incubation at RT in 0.05 NFDM/TBST. Secondary: Goat anti-rabbit IgG HRP conjugate at 1:10,000 dilution.

- Submitted by
- Invitrogen Antibodies (provider)
- Main image
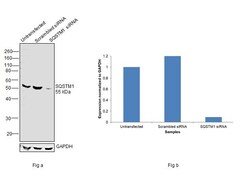
- Experimental details
- Knockdown of SQSTM1 was achieved by transfecting Hep G2 with SQSTM1 specific siRNAs (Silencer® select Product # S16960, S16962). Western blot analysis (Fig. a) was performed using Whole cell extracts from the SQSTM1 knockdown cells (lane 3), non-targeting scrambled siRNA transfected cells (lane 2) and untransfected cells (lane 1). The blot was probed with SQSTM1 Polyclonal Antibody (Product # PA5-20839, 0.75 µg/mL) and Goat anti-Rabbit IgG (H+L) Superclonal™ Recombinant Secondary Antibody, HRP (Product # A27036, 1:4000 dilution). Densitometric analysis of this western blot is shown in histogram (Fig. b). Decrease in signal upon siRNA mediated knock down confirms that antibody is specific to SQSTM1.

- Submitted by
- Invitrogen Antibodies (provider)
- Main image

- Experimental details
- Western blot was performed using Anti-SQSTM1 Polyclonal Antibody (Product # PA5-20839) and a ~55 kDa band corresponding to SQSTM1 was observed across cell lines and tissue tested. Whole cell extracts (30 µg lysate) of HeLa (Lane 1),Hep G2 (Lane 2), BeWo (Lane 3), SH-SY5Y (Lane 4) and THP 1 (Lane 5); and tissue extracts of Mouse Thymus were electrophoresed using NuPAGE™ 10% Bis-Tris Protein Gel (Product # NP0301BOX). Resolved proteins were then transferred onto a Nitrocellulose membrane (Product # IB23001) by iBlot® 2 Dry Blotting System (Product # IB21001). The blot was probed with the primary antibody (0.75 µg/mL) and detected by chemiluminescence with Goat anti-Rabbit IgG (H+L) Superclonal™ Recombinant Secondary Antibody, HRP (Product # A27036, 1:4000 dilution) using the iBright FL 1000 (Product # A32752). Chemiluminescent detection was performed using SuperSignal™ West Dura Extended Duration Substrate (Product # 34076).

Supportive validation
- Submitted by
- Invitrogen Antibodies (provider)
- Main image

- Experimental details
- Immunofluorescent analysis of rat spleen cells using a SQSTM1 polyclonal antibody (Product # PA5-20839) at a 20 µg/mL dilution.
- Submitted by
- Invitrogen Antibodies (provider)
- Main image
- Experimental details
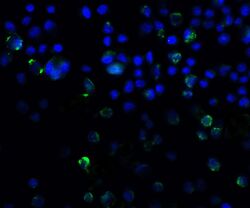
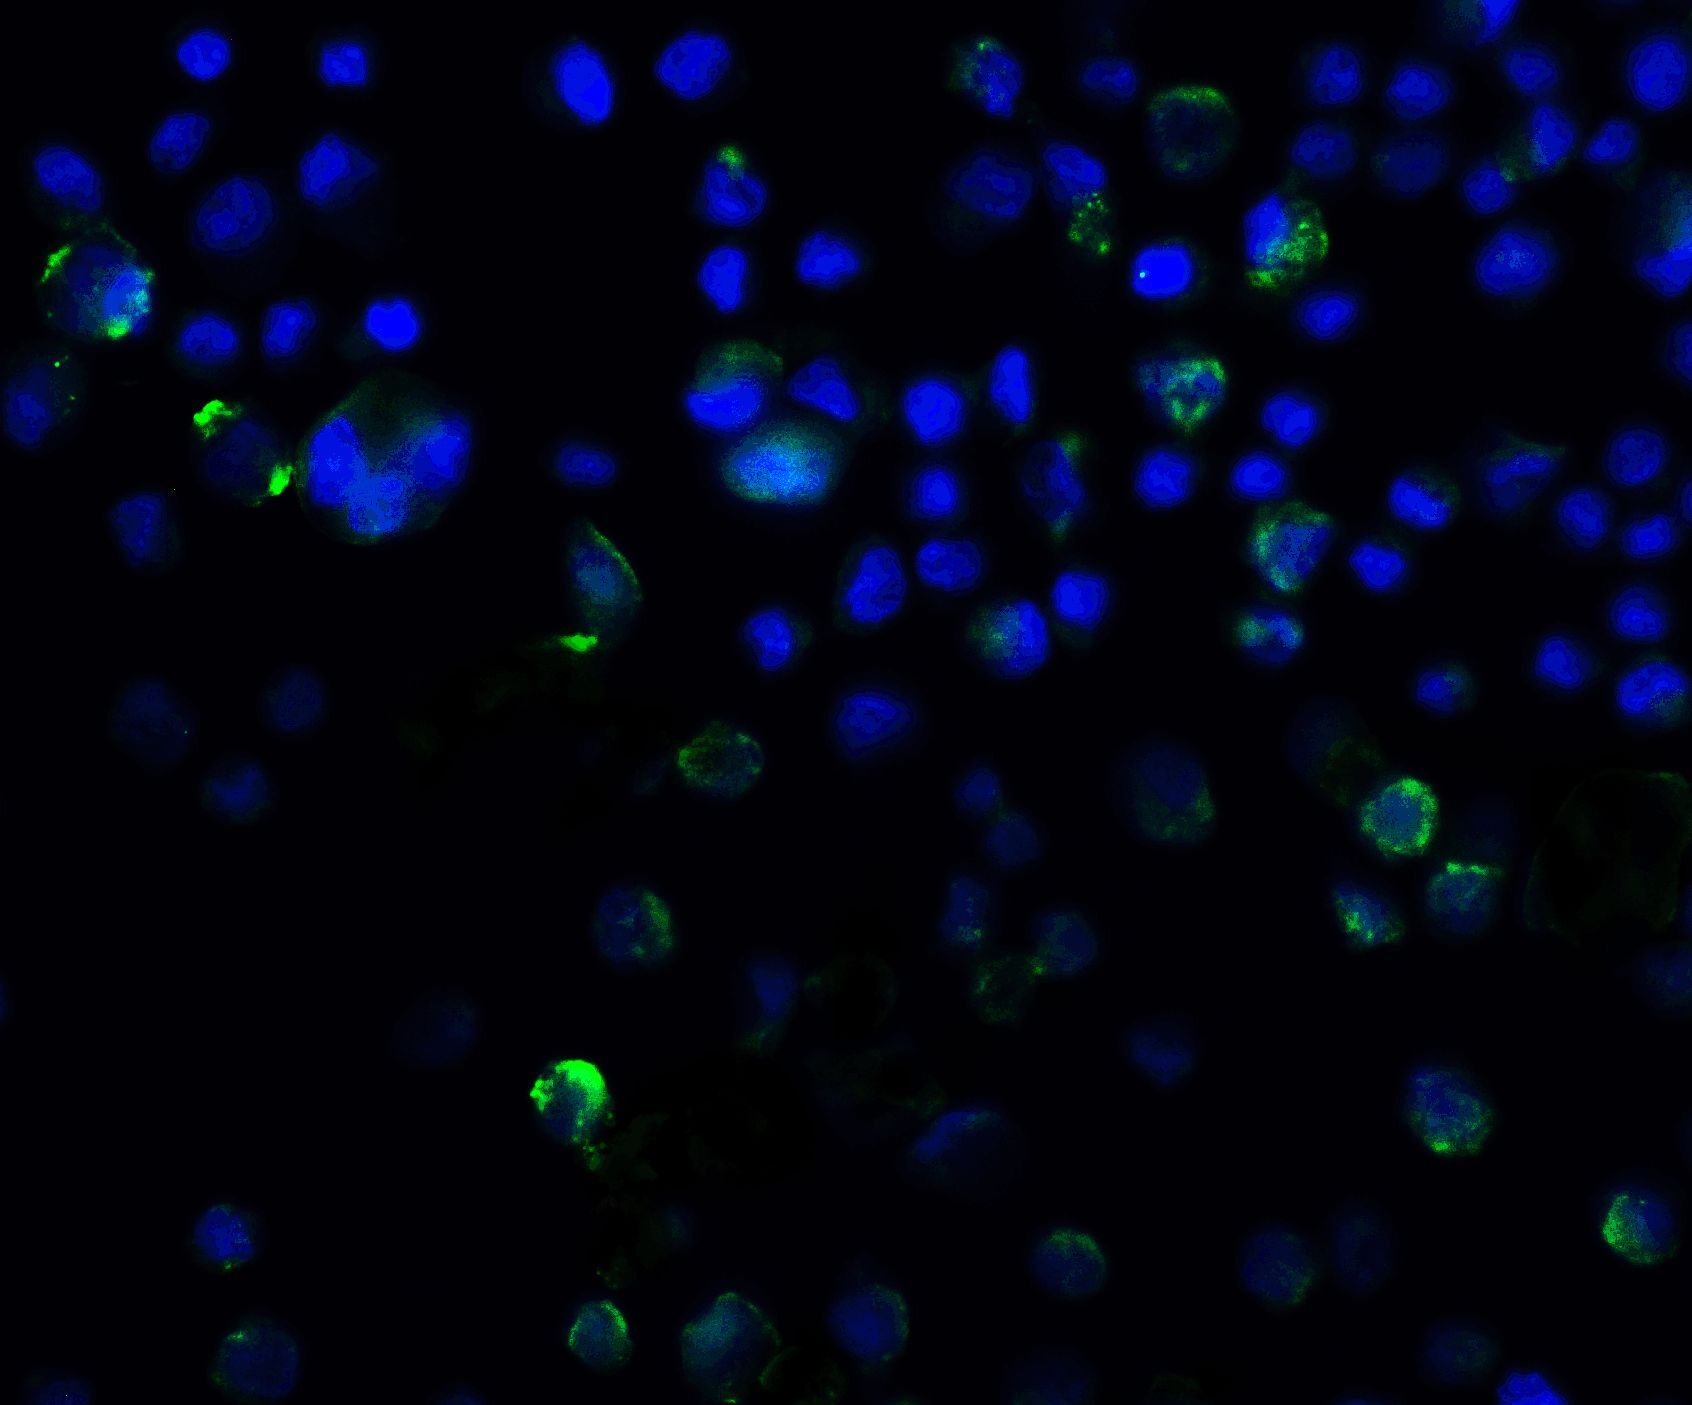
- Immunofluorescent analysis of 4% paraformaldehyde-fixed A431 Cells labeling SQSTM1 with SQSTM1 Polyclonal Antibody (Product # PA5-20839) at 20 µg/mL, followed by goat anti-rabbit IgG secondary antibody at 1:500 dilution (green) and DAPI staining (blue).
- Submitted by
- Invitrogen Antibodies (provider)
- Main image
- Experimental details
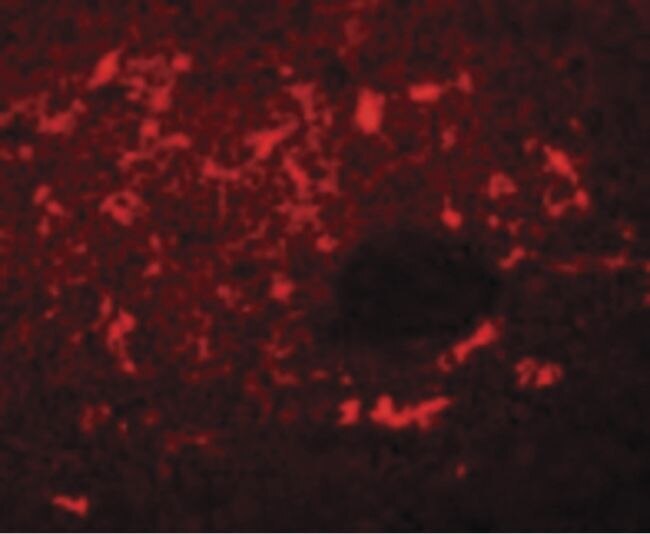
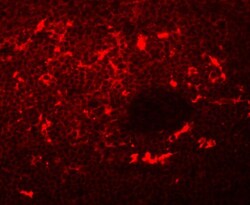
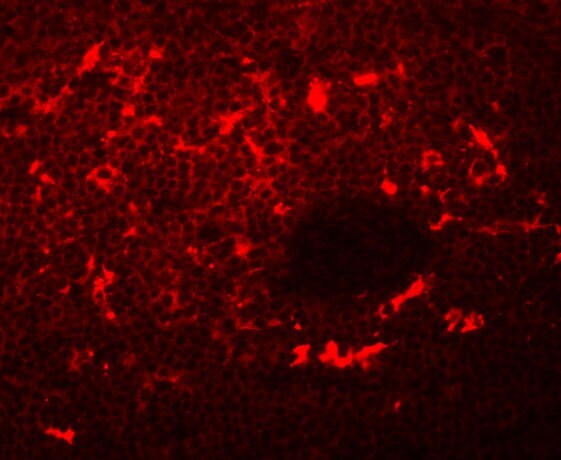
- Immunofluorescent analysis of 4% paraformaldehyde-fixed Rat Spleen Cells labeling SQSTM1 with SQSTM1 Polyclonal Antibody (Product # PA5-20839) at 20 µg/mL, followed by goat anti-rabbit IgG secondary antibody at 1:500 dilution (red).
- Submitted by
- Invitrogen Antibodies (provider)
- Main image
- Experimental details
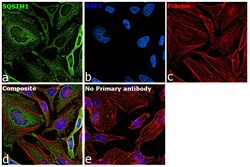
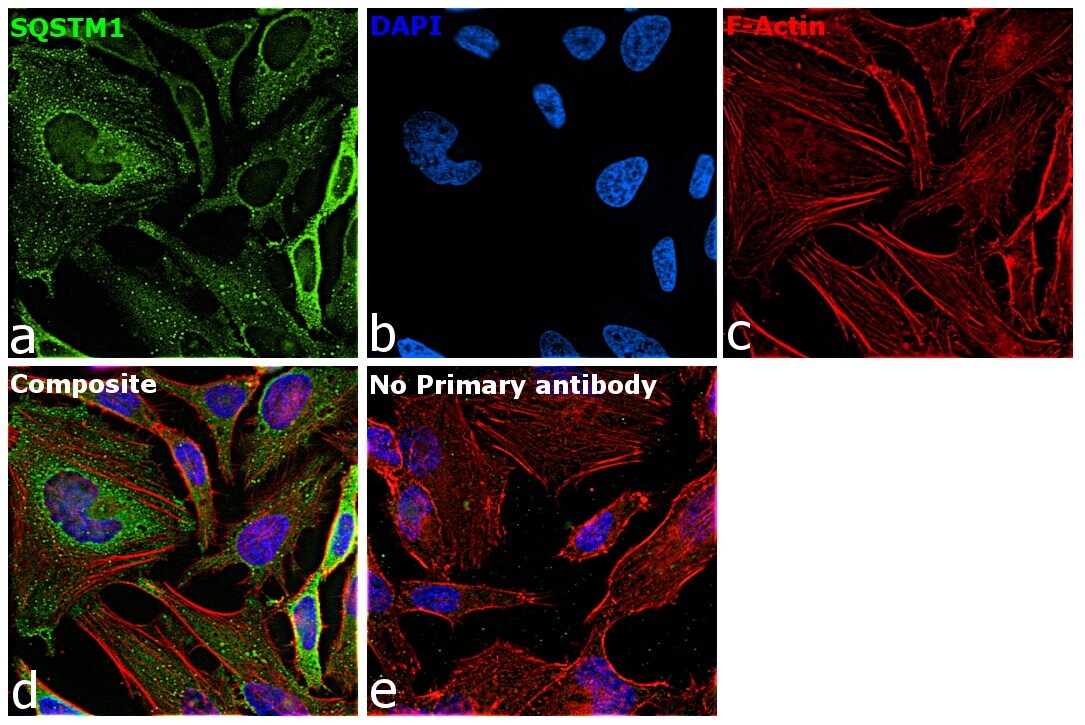
- Immunofluorescence analysis of SQSTM1 was performed using 70% confluent log phase HeLa cells. The cells were fixed with 4% paraformaldehyde for 10 minutes, permeabilized with 0.1% Triton™ X-100 for 15 minutes, and blocked with 2% BSA for 45 minutes at room temperature. The cells were labeled with SQSTM1 Polyclonal Antibody (Product # PA5-20839) at 20 µg/mL in 0.1% BSA, incubated at 4 degree celsius overnight and then labeled with Goat anti-Rabbit IgG (H+L) Highly Cross-Adsorbed Secondary Antibody, Alexa Fluor Plus 488 (Product # A32731), (1:2000 dilution), for 45 minutes at room temperature (Panel a: Green). Nuclei (Panel b:Blue) were stained with ProLong™ Diamond Antifade Mountant with DAPI (Product # P36962). F-actin (Panel c: Red) was stained with Rhodamine Phalloidin (Product # R415, 1:300 dilution). Panel d represents the merged image showing cytoplasmic, Endosome-like, plasma membrane and nuclear localization. Panel e represents control cells with no primary antibody to assess background. The images were captured at 60X magnification.
Supportive validation
- Submitted by
- Invitrogen Antibodies (provider)
- Main image
- Experimental details
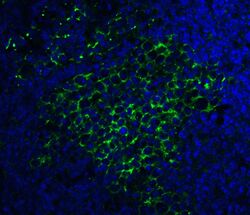
- Immunofluorescent analysis of 4% paraformaldehyde-fixed Mouse Spleen Tissue labeling SQSTM1 with SQSTM1 Polyclonal Antibody (Product # PA5-20839) at 20 µg/mL, followed by goat anti-rabbit IgG secondary antibody at 1:500 dilution (green) and DAPI staining (blue).

- Submitted by
- Invitrogen Antibodies (provider)
- Main image
- Experimental details
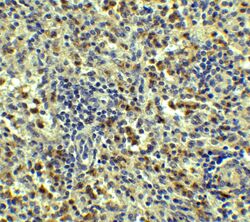
- Immunohistochemical analysis of paraffin-embedded Human Spleen Tissue using SQSTM1 Polyclonal Antibody (Product # PA5-20839) at 5 µg/mL. Tissue was fixed with formaldehyde and blocked with 0.1 serum for 1 h at RT; antigen retrieval was by heat mediation with a citrate buffer (pH6). Samples were incubated with primary antibody overnight at 4˚C. A goat anti-rabbit IgG H&L (HRP) at 1/250 was used as secondary. Counter stained with Hematoxylin.

- Submitted by
- Invitrogen Antibodies (provider)
- Main image
- Experimental details
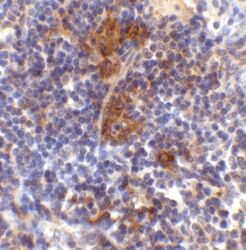
- Immunohistochemical analysis of paraffin-embedded Mouse Spleen Tissue using SQSTM1 Polyclonal Antibody (Product # PA5-20839) at 2 µg/mL. Tissue was fixed with formaldehyde and blocked with 0.1 serum for 1 h at RT; antigen retrieval was by heat mediation with a citrate buffer (pH6). Samples were incubated with primary antibody overnight at 4˚C. A goat anti-rabbit IgG H&L (HRP) at 1/250 was used as secondary. Counter stained with Hematoxylin.

- Submitted by
- Invitrogen Antibodies (provider)
- Main image
- Experimental details
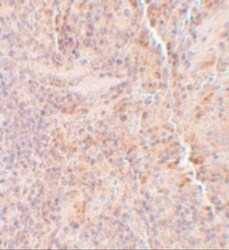
- Immunohistochemical analysis of paraffin-embedded Rat Spleen Tissue using SQSTM1 Polyclonal Antibody (Product # PA5-20839) at 5 µg/mL. Tissue was fixed with formaldehyde and blocked with 0.1 serum for 1 h at RT; antigen retrieval was by heat mediation with a citrate buffer (pH6). Samples were incubated with primary antibody overnight at 4˚C. A goat anti-rabbit IgG H&L (HRP) at 1/250 was used as secondary. Counter stained with Hematoxylin.

Supportive validation
- Submitted by
- Invitrogen Antibodies (provider)
- Main image

- Experimental details
- Figure 6 Autophagy and endo-lysosomal pathway defects caused by MGRN1 are mediated via TSG101. ( a ) Experimental logic to establish that MGRN1 interacts with TSG101 to mediate vesicular fusion with lysosomes. ( b ) HeLa cells treated with the indicated siRNAs were transfected with either empty vector or HA-TSG101. Cell lysates were immunoblotted to analyze the levels of endogenous LC3 II and p62 in the presence or absence of 300 nM bafilomycin A1. GAPDH was used as loading control. Efficiency of knockdown was shown by immunoblotting with anti-MGRN1. indicates HA-TSG101; endogenous TSG101. The blots are representative of at least three independent experiments. ( c ) Graph shows fold change in LC3 II when normalized against corresponding GAPDH levels; analyzed from three independent experiments. ** P

- Submitted by
- Invitrogen Antibodies (provider)
- Main image
- Experimental details
- Figure 3 Compromise in MGRN1 activity perturbs autophagic fusion events. ( a ) HeLa cells treated with irrelevant siRNAs (mock siRNAs) were transfected with mCherry-EGFP-LC3B construct; live cells were imaged over indicated time periods to track the fate of vesicles in real time. One representative field, out of 25 cells is shown. Scale bar, 5 mu m. ( b ) Cells treated with MGRN1 siRNAs and transfected with mCherry-EGFP-LC3B construct were imaged similar to ( a ). One representative field, out of 25 cells is shown. Scale bar, 5 mu m. ( c ) Mock or MGRN1 siRNA-transfected HeLa cells were lysed and immunoblotted to analyze the levels of endogenous LC3 II and p62 in the presence or absence of 300 nM bafilomycin A1. The levels of beta- tubulin serve as loading control. Efficiency of knockdown was confirmed by immunoblotting with anti-MGRN1. The blots are representative of at least three experiments. ( d ) The immunoblots from ( c ) were analyzed for the levels of LC3 II. Graph shows fold change in LC3 II when normalized against corresponding beta- tubulin in the cell lysates, analyzed from three independent experiments. ** P

- Submitted by
- Invitrogen Antibodies (provider)
- Main image

- Experimental details
- Additional file 2: Figure S2. Whole transverse sectional images of the lumbar spinal cord in Figs. 2 , 3 and 4 . a Whole transverse sectional images of fluorescence Nissl staining in the lumbar spinal cords in Fig. 2 . b Whole transverse sectional images of double immunostaining with Ubiquitin (green) and SQSTM1 (red) in the lumbar spinal cord in Fig. 3 . c Whole transverse sectional images of double immunostaining with MAP2 (green) and Ubiquitin (red), Ubiquitin (green) and GFAP (red), and Ubiquitin (green) and Iba1 (red) in the lumbar spinal cord in Fig. 4 . a-c Scale bars = 300 mum. b, c The nuclei were counterstained with DAPI (blue). (PDF 7238 kb)

- Submitted by
- Invitrogen Antibodies (provider)
- Main image

- Experimental details
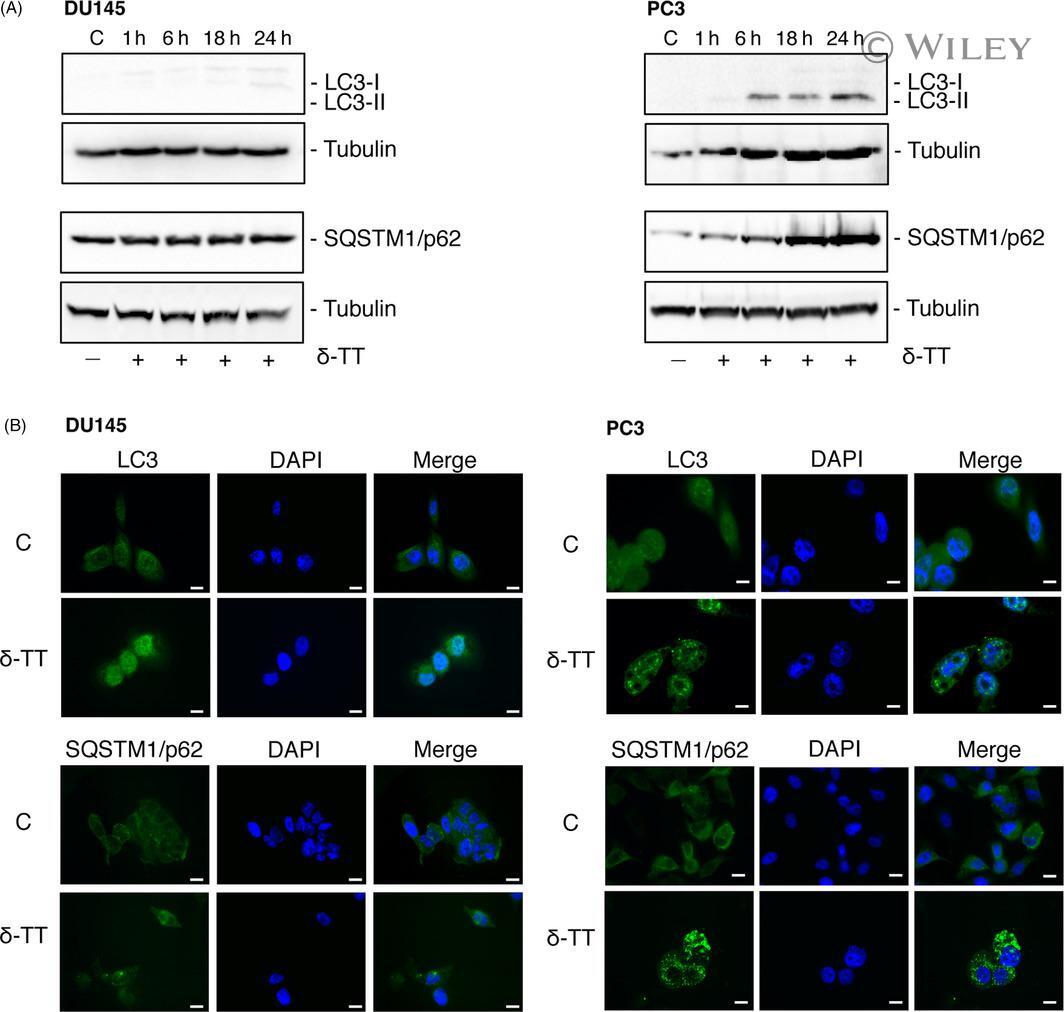
- delta-TT triggers autophagy in PC3, but not in DU145, prostate cancer cells. DU145 and PC3 cells were treated with delta-TT (15 mug/mL) for 1-24 h. A, Western blot analysis was performed to investigate the expression levels of autophagy-related proteins (LC3-II/LC3-I, SQSTM1/p62). Tubulin expression was evaluated as a loading control. B, The expression levels and intracellular localization of LC3 and SQSTM1/p62 were evaluated by immunofluorescence. One representative of three different experiments performed is shown. C, controls (vehicle). Scale bars are 20 mum
- Submitted by
- Invitrogen Antibodies (provider)
- Main image

- Experimental details
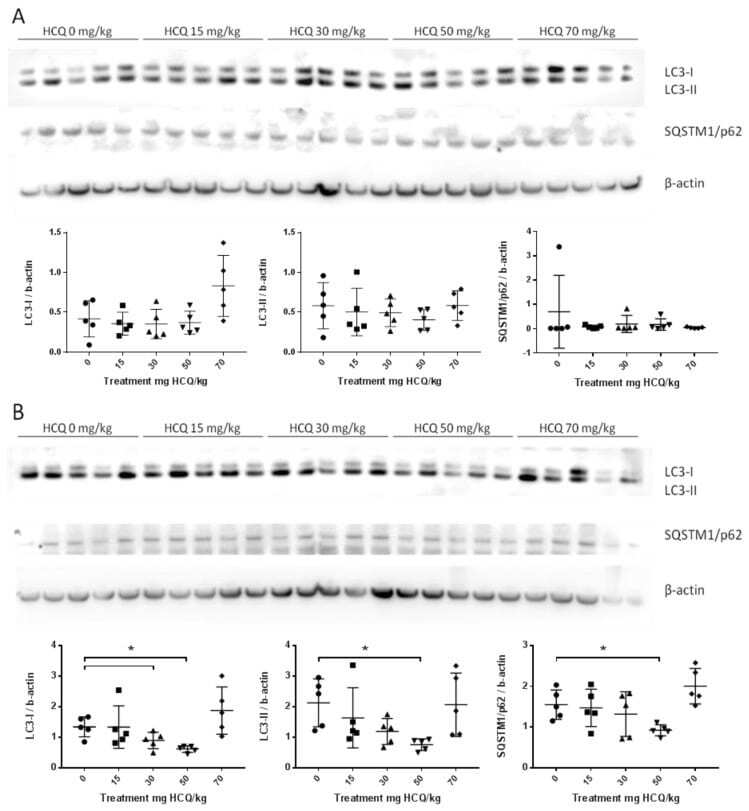
- Figure 3 Representative western blots of LC3 and SQSTM1/p62 proteins in the anterior tibialis muscle of juvenile mice sacrificed at post-natal day (PND)136 showing the inter-individual and inter-group variation of protein expression: ( A ) Male data n = 5/group; ( B ) Female data n = 5/group. Standardized protein levels were analysed by the Kruskal-Wallis test. Mann-Whitney was used for multiple comparisons; * p < 0.05.
- Submitted by
- Invitrogen Antibodies (provider)
- Main image

- Experimental details
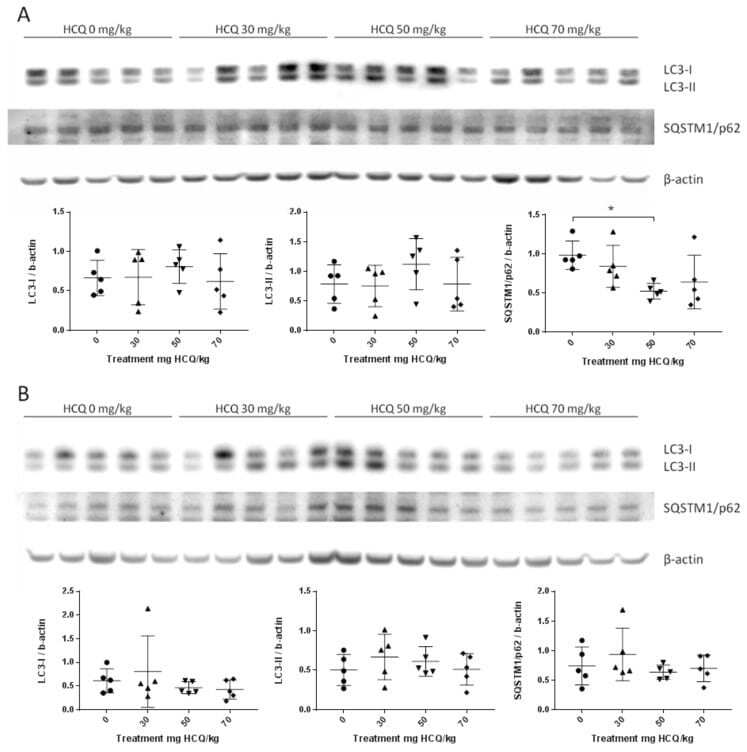
- Figure 4 Representative Western blot of LC3 and SQSTM1/p62 proteins in the anterior tibialis muscle of adult mice sacrificed at PND136 showing the inter-individual and inter-group variation of protein expression: ( A ) Male data n = 5/group; ( B ) Female data n = 5/group. Standardized protein levels were analysed by Kruskal-Wallis test. Mann-Whitney was used for multiple comparisons; * p < 0.05.
- Submitted by
- Invitrogen Antibodies (provider)
- Main image

- Experimental details
- Fig. 3 Progressive accumulation of ubiquitin/SQSTM1-positive aggregates in the anterior horn of lumbar spinal cord. a-c Representative images of double immunostaining with Ubiquitin (green) and SQSTM1 (red) in the lumbar spinal cord (L4-5) from wild-type (WT), SQSTM1 (SQSTM1), SOD1 H46R (H46R) and SQSTM1 ; SOD1 H46R (SQSTM1;H46R) mice at 16 weeks of age (wk) ( a ), 22 wk. ( b ), and end-stage (H46R and SQSTM1;H46R) or 28 wk. (WT and SQSTM1) ( c ). The nuclei were counterstained with DAPI (blue). Scale bars = 50 mum. Ubiquitin-positive aggregates and SQSTM1 aggregates were observed in the anterior horn of SOD1 H46R (H46R) and SQSTM1 ; SOD1 H46R (SQSTM1;H46R) mice at 22 wk. and end-stage. Arrows indicate ubiquitin-positive aggregates that are colocalized with SQSTM1

- Submitted by
- Invitrogen Antibodies (provider)
- Main image
- Experimental details
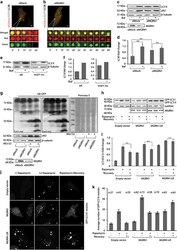
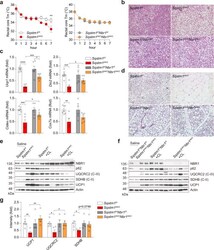
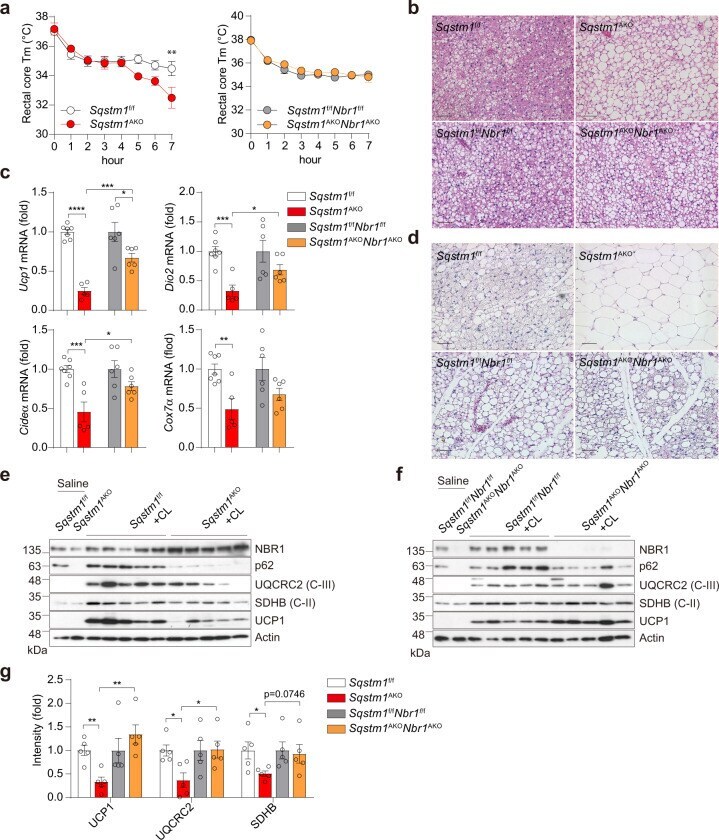
- Fig. 5 Role of NBR1 in adaptive thermogenesis in BAT and inguinal WAT. a - c Male mice at 25 weeks of age were subjected to acute cold exposure (4 degC) for 7 h to stimulate brown thermogenesis. a Rectal core temperature was measured for consecutive 7 h. Sqstm1 f/f ( n = 10), Sqstm1 AKO ( n = 6), Sqstm1 f/f Nbr1 f/f ( n = 9), and Sqstm1 AKO Nbr1 AKO ( n = 10). Two-way ANOVA followed by Bonferroni's post-test. b Representative H&E staining in BAT of indicated mice ( n = 3, per genotype). Scale bar = 100 mum. c qPCR analysis of thermogenesis-related genes in BAT of mice. Results are presented as change fold related to individual controls. Sqstm1 f/f ( n = 7), Sqstm1 AKO ( n = 5), Sqstm1 f/f Nbr1 f/f ( n = 6), and Sqstm1 AKO Nbr1 AKO ( n = 6). Two-tailed Student's T -test. d - g Male mice at 25 weeks of age were injected with CL316,243 or saline as control for consecutive 5 days. d Representative H&E staining in iWAT of indicated mice. Sqstm1 f/f ( n = 4), Sqstm1 AKO ( n = 4), Sqstm1 f/f Nbr1 f/f ( n = 3), and Sqstm1 AKO Nbr1 AKO ( n = 3). Scale bar = 100 mum. e , f Immunoblot analysis of mitochondrial OXPHOS genes and UCP1 in BAT of Sqstm1 AKO ( e ) and Sqstm1 AKO Nbr1 AKO ( f ) and their respective controls ( n = 5, per genotype). g Densitometric quantification of gene intensity from western blot ( e , f ). Results are presented as change fold related to individual controls. Two-tailed Student's T -test. Data are presented as mean +- SEM ( a , c , g ). * p < 0.05, ** p < 0.01,
- Submitted by
- Invitrogen Antibodies (provider)
- Main image

- Experimental details
- Fig. 7 p62 and NBR1 interact with PPARgamma in brown adipocytes. a Representative immunoblotting of p62 and NBR1 levels in cytoplasmic/nuclear fractions in primary brown adipocytes. Cells were treated with 0.5 uM isoproterenol (ISO) for indicated time. Densitometric quantification of nuclear NBR1 and p62 levels was also shown ( n = 3 independent experiments). b , c Endogenous interaction of PPARgamma with p62 and NBR1. p62 ( b ) or PPARgamma ( c ) immunoprecipitates from nuclear lysates extracted from ISO and rosiglitazone-treated brown adipocytes were analyzed for the levels of specified proteins. Representative blots and densitometric quantification were shown ( n = 3 independent experiments for both). d , e Recombinant FLAG-p62 ( d ) or FLAG-NBR1 ( e ) was incubated with GST and GST-PPARgamma proteins separately and the interactions were analyzed by immunoblotting in glutathione-beads pull-down. Representative blots and densitometric quantification were shown ( n = 4 independent experiments for d and n = 3 independent experiments for e ). f HEK293T cells were transfected with cDNA vectors expressing WT/mutants of HA-p62 or HA-NBR1, and GST-PPARgamma. The interacting proteins were pulled down using glutathione-beads against GST-PPARgamma and analyzed by immunoblotting. Representative blots from three independent replicates with similar results were shown. Data are presented as mean +- SEM ( a - e ). * p < 0.05, ** p < 0.01. Two-tailed Student's T -test ( a - e ). Source dat

- Submitted by
- Invitrogen Antibodies (provider)
- Main image

- Experimental details
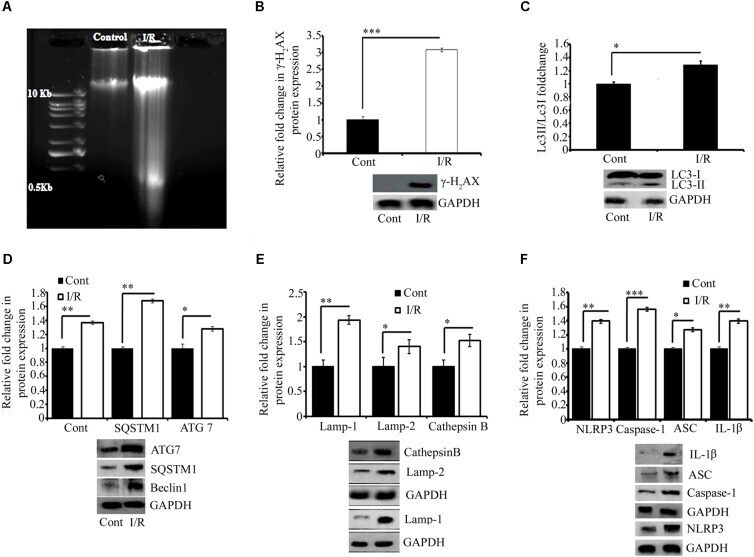
- FIGURE 3 Representative pictures of effect of I/R on DNA damage, cell survival, and inflammation. (A) DNA gel electrophoresis diagram. (B) The phosphorylation of H2AX in response to I/R-induced DNA damage ( *** P < 0.001 vs. control). Western blot analysis expression level of LC3 I/II ( * P < 0.05) (C) , Beclin1 ( *** P < 0.001), SQSTM1 ( * P < 0.05), and ATG7 ( ** P < 0.01) (D) and lysosomal associated proteins Lamp1 ( ** P < 0.01), Lamp2 ( * P < 0.05), and Cathepsin B ( * P < 0.05) (E) in total protein extract from RVA of I/R treated vs. control group. (F) The expression of NLRP3 ( *** P < 0.001), Caspase-1 ( ** P < 0.01), ASC ( ** P < 0.01), and IL-1beta ( ** P < 0.01). Results represent mean +- SE ( n = 3). The graph shows the densitometry quantification of western blot bands. Here control group represented Sham group. * P < 0.05, ** P < 0.01, and *** P < 0.001.
- Submitted by
- Invitrogen Antibodies (provider)
- Main image
- Experimental details
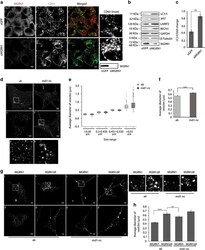
- Figure 1 Compromised function of MGRN1 affects markers of late endocytosis/lysosomes and autophagy. ( a ) HeLa cells treated with irrelevant siRNAs (GFP siRNAs) or MGRN1 siRNAs, co-immunostained for CD63 and MGRN1 were imaged. Note a qualitative increase in size of vesicles with the functional depletion of MGRN1. The channels for acquiring the images are indicated. Enlarged views of the areas within the white boxes are also shown (insets). Scale bar, 5 mu m. The immunoblot on the right shows efficiency of siRNA-mediated MGRN1 knockdown. ( b ) HeLa cells similarly treated as in ( a ) were lysed and immunoblotted for autophagy and lysosomal proteins. The levels of GAPDH and beta- tubulin serve as loading controls. The blots are representative of at least three experiments. Efficiency of knockdown was checked using anti-MGRN1 antibody. Note that the antibody used against LC3, detects only endogenous LC3 II. ( c ) The immunoblots shown in ( b ) were analyzed for the levels of LC3 II. Graph shows results from three independent experiments. ** P

- Submitted by
- Invitrogen Antibodies (provider)
- Main image

- Experimental details
- Fig. 1 Trehalose induces autophagy in PC3 cells. a MTT viability assay was performed on PC3 cells treated for 48 h with 20, 50 or 100 mM trehalose. Six independent biological samples for each condition were analysed ( n = 6), bar graph represents the mean relative cell viability +- SD. Statistical analysis was performed using Student's t test. b TFEB localization was carried out by IF after treatment with 100 mM trehalose for 24 h. Nuclei were stained with DAPI. Scale bar, 20 mum. c LC3 mRNA expression was analysed by RT-qPCR after treatment with 100 mM trehalose for 48 or 72 h. Data were normalized to the amount of RplP0 mRNA. Bar graph represents the mean of four independent biological samples ( n = 4) +- SD (* p < 0.01 vs. control 48 h, ** p < 0.01 vs. control 72 h; Student's t test). d Autophagy was analysed by quantification of LC3-II/LC3-I ratio by WB analysis of PC3 cells treated for 24, 48 or 72 h with 100 mM trehalose. e LC3 puncta was carried out by IF after treatment with 100 mM trehalose for 48 h. Nuclei were stained with DAPI. Scale bar, 20 mum. f PC3 cells pretreated with or without 1 mM 3-MA for 1 h were exposed to 100 mM trehalose for additional 48 h. WB analysis of LC3 was carried out. Relative optical density of LC3II/I was quantified by ImageJ software. Bar graph represents mean +- SD calculated from three independent experiments. Statistical analysis was performed by one-way ANOVA followed by Bonferroni post-test (* p < 0.05). g PC

- Submitted by
- Invitrogen Antibodies (provider)
- Main image

- Experimental details
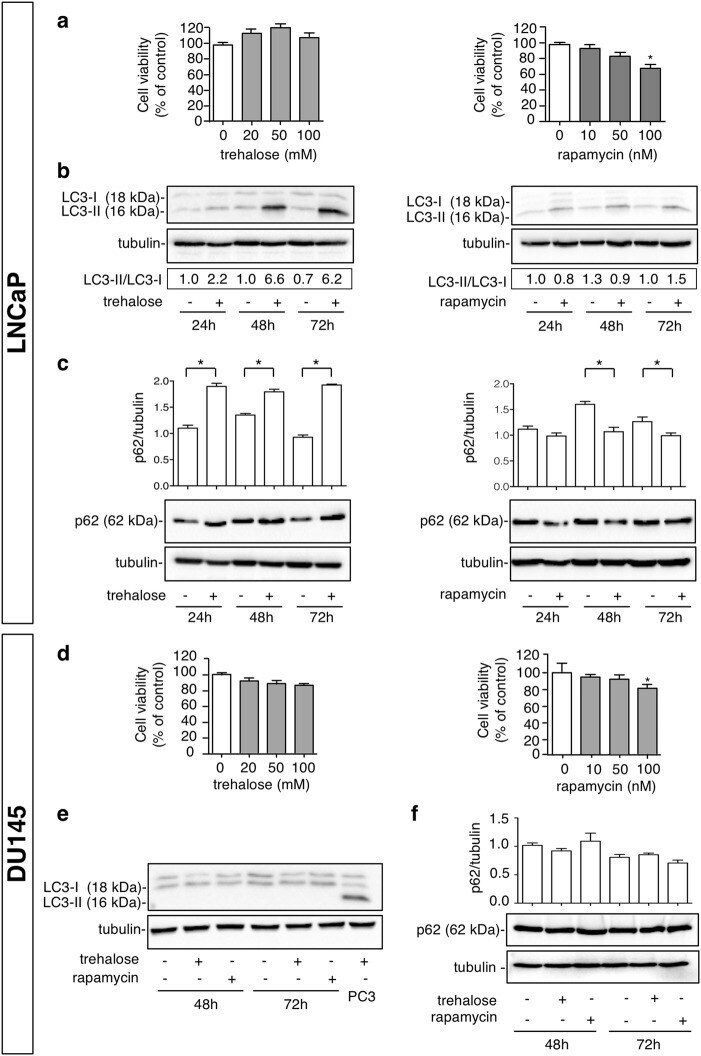
- Fig. 3 Trehalose and rapamycin induce autophagy in LNCaP cells, but do not induce autophagy in DU145 cells. a LNCaP cells were treated with 20, 50,100 mM trehalose or with 10, 50, 100 nM rapamycin for 48 h. MTT assays were performed. Data are mean +- SD of six independent biological samples ( n = 6). Each experiment was repeated three times. Statistical analysis of data was performed by Dunnet test (* p < 0.05 vs. control). b LNCaP cells were treated for 24, 48 or 72 h with 100 mM trehalose or 100 nM rapamycin and WB analysis of LC3 was performed. Detection of autophagy was analysed by quantification of LC3-II/LC3-I ratio. Relative optical density was determined by ImageJ software. Experiments were performed independently three times and a representative blot is shown. c LNCaP cells were treated for 24, 48 or 72 h with 100 mM trehalose or 100 nM rapamycin and WB analysis of p62 was performed. Tubulin was used as loading control. Bar graph represents mean optical density +- SD of p62 levels. The experiments were performed independently three times. Statistical analysis was performed by one-way ANOVA with Bonferroni post-test (* p < 0.05). d DU145 cells were treated with 20, 50,100 mM trehalose or with 10, 50, 100 nM rapamycin for 48 h. MTT assays were performed. Data are mean +- SD of six independent biological samples ( n = 6). Each experiment was repeated three times. Statistical analysis of data was performed by Dunnet test (* p < 0.05 vs. control). e DU145 ce