 Explore
 Validate
 Learn
Learn Western blot
 Immunocytochemistry
Antibody data
- Antibody Data
- Antigen structure
- References [37]
- Comments [0]
- Validations
- Immunocytochemistry [2]
- Other assay [28]
Submit
Validation data
Reference
Comment
Report error
- Product number
- 339188 - Provider product page

- Provider
- Invitrogen Antibodies
- Product name
- ZO-1 Monoclonal Antibody (ZO1-1A12), Alexa Fluor 488
- Antibody type
- Monoclonal
- Antigen
- Recombinant full-length protein
- Reactivity
- Human, Canine
- Host
- Mouse
- Conjugate
- Green dye
- Isotype
- IgG
- Antibody clone number
- ZO1-1A12
- Vial size
- 100 µg
- Concentration
- 0.5 mg/mL
- Storage
- 4° C, store in dark
Submitted references Effect of Physiological Oxygen on Primary Human Corneal Endothelial Cell Cultures.
Epithelial cells sacrifice excess area to preserve fluidity in response to external mechanical stress.
Loss of Ciliary Gene Bbs8 Results in Physiological Defects in the Retinal Pigment Epithelium.
Cryopreservation of human cerebral microvascular endothelial cells and astrocytes in suspension and monolayers.
The Role of Intestinal Dysbacteriosis Induced Arachidonic Acid Metabolism Disorder in Inflammaging in Atherosclerosis.
Start codon disruption with CRISPR/Cas9 prevents murine Fuchs' endothelial corneal dystrophy.
New Stable Cell Lines Derived from the Proximal and Distal Intestine of Rainbow Trout (Oncorhynchus mykiss) Retain Several Properties Observed In Vivo.
Distinctive probiotic features share common TLR2-dependent signalling in intestinal epithelial cells.
The molecular dynamics of subdistal appendages in multi-ciliated cells.
Rapid Manufacturing of Multilayered Microfluidic Devices for Organ on a Chip Applications.
AMPK modulation ameliorates dominant disease phenotypes of CTRP5 variant in retinal degeneration.
WNT11/ROR2 signaling is associated with tumor invasion and poor survival in breast cancer.
Three-Dimensional Aggregated Spheroid Model of Hepatocellular Carcinoma Using a 96-Pillar/Well Plate.
Tbx20 Induction Promotes Zebrafish Heart Regeneration by Inducing Cardiomyocyte Dedifferentiation and Endocardial Expansion.
Maternal administration of probiotics promotes gut development in mouse offsprings.
The impact of synthetic amorphous silica (E 551) on differentiated Caco-2 cells, a model for the human intestinal epithelium.
Nanotopography Enhances Dynamic Remodeling of Tight Junction Proteins through Cytosolic Liquid Complexes.
Adhesion of Epithelial Cells to PNIPAm Treated Surfaces for Temperature-Controlled Cell-Sheet Harvesting.
Magnesium and vitamin C supplementation attenuates steroid-associated osteonecrosis in a rat model.
A Novel Three-Dimensional Glioma Blood-Brain Barrier Model for High-Throughput Testing of Tumoricidal Capability.
Human gut derived-organoids provide model to study gluten response and effects of microbiota-derived molecules in celiac disease.
PI3K-Yap activity drives cortical gyrification and hydrocephalus in mice.
Human intestinal spheroids cultured using Sacrificial Micromolding as a model system for studying drug transport.
Regional Differences in Tight Junction Protein Expression in the Blood-DRG Barrier and Their Alterations after Nerve Traumatic Injury in Rats.
Generation of an inducible RPE-specific Cre transgenic-mouse line.
Long-Term In Vitro Expansion of Epithelial Stem Cells Enabled by Pharmacological Inhibition of PAK1-ROCK-Myosin II and TGF-β Signaling.
EPHB6 augments both development and drug sensitivity of triple-negative breast cancer tumours.
SNX16 Regulates the Recycling of E-Cadherin through a Unique Mechanism of Coordinated Membrane and Cargo Binding.
A multi-stage process including transient polyploidization and EMT precedes the emergence of chemoresistent ovarian carcinoma cells with a dedifferentiated and pro-inflammatory secretory phenotype.
Cytoskeleton remodelling of confluent epithelial cells cultured on porous substrates.
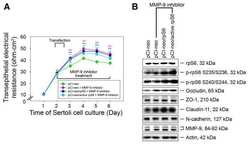
rpS6 regulates blood-testis barrier dynamics through Akt-mediated effects on MMP-9.
NLRP3 inflammasome blockade inhibits VEGF-A-induced age-related macular degeneration.
Renal intercalated cells are rather energized by a proton than a sodium pump.
Primordium of an artificial Bruch's membrane made of nanofibers for engineering of retinal pigment epithelium cell monolayers.
Thrombin induces epithelial-mesenchymal transition and collagen production by retinal pigment epithelial cells via autocrine PDGF-receptor signaling.
rpS6 Regulates blood-testis barrier dynamics by affecting F-actin organization and protein recruitment.
Microtubule affinity-regulating kinase 4 (MARK4) is a component of the ectoplasmic specialization in the rat testis.
Patel SP, Calle Gonzalez B, Paone N, Mueller C, Floss JC, Sousa ME, Shi MY
Translational vision science & technology 2022 Feb 1;11(2):33
Translational vision science & technology 2022 Feb 1;11(2):33
Epithelial cells sacrifice excess area to preserve fluidity in response to external mechanical stress.
Bodenschatz JFE, Ajmail K, Skamrahl M, Vache M, Gottwald J, Nehls S, Janshoff A
Communications biology 2022 Aug 22;5(1):855
Communications biology 2022 Aug 22;5(1):855
Loss of Ciliary Gene Bbs8 Results in Physiological Defects in the Retinal Pigment Epithelium.
Schneider S, De Cegli R, Nagarajan J, Kretschmer V, Matthiessen PA, Intartaglia D, Hotaling N, Ueffing M, Boldt K, Conte I, May-Simera HL
Frontiers in cell and developmental biology 2021;9:607121
Frontiers in cell and developmental biology 2021;9:607121
Cryopreservation of human cerebral microvascular endothelial cells and astrocytes in suspension and monolayers.
Marquez-Curtis LA, Bokenfohr R, McGann LE, Elliott JAW
PloS one 2021;16(4):e0249814
PloS one 2021;16(4):e0249814
The Role of Intestinal Dysbacteriosis Induced Arachidonic Acid Metabolism Disorder in Inflammaging in Atherosclerosis.
Sun Y, Wu D, Zeng W, Chen Y, Guo M, Lu B, Li H, Sun C, Yang L, Jiang X, Gao Q
Frontiers in cellular and infection microbiology 2021;11:618265
Frontiers in cellular and infection microbiology 2021;11:618265
Start codon disruption with CRISPR/Cas9 prevents murine Fuchs' endothelial corneal dystrophy.
Uehara H, Zhang X, Pereira F, Narendran S, Choi S, Bhuvanagiri S, Liu J, Ravi Kumar S, Bohner A, Carroll L, Archer B, Zhang Y, Liu W, Gao G, Ambati J, Jun AS, Ambati BK
eLife 2021 Jun 8;10
eLife 2021 Jun 8;10
New Stable Cell Lines Derived from the Proximal and Distal Intestine of Rainbow Trout (Oncorhynchus mykiss) Retain Several Properties Observed In Vivo.
Pasquariello R, Verdile N, Pavlovic R, Panseri S, Schirmer K, Brevini TAL, Gandolfi F
Cells 2021 Jun 19;10(6)
Cells 2021 Jun 19;10(6)
Distinctive probiotic features share common TLR2-dependent signalling in intestinal epithelial cells.
Paveljšek D, Ivičak-Kocjan K, Treven P, Benčina M, Jerala R, Rogelj I
Cellular microbiology 2021 Jan;23(1):e13264
Cellular microbiology 2021 Jan;23(1):e13264
The molecular dynamics of subdistal appendages in multi-ciliated cells.
Ryu H, Lee H, Lee J, Noh H, Shin M, Kumar V, Hong S, Kim J, Park S
Nature communications 2021 Jan 27;12(1):612
Nature communications 2021 Jan 27;12(1):612
Rapid Manufacturing of Multilayered Microfluidic Devices for Organ on a Chip Applications.
Paoli R, Di Giuseppe D, Badiola-Mateos M, Martinelli E, Lopez-Martinez MJ, Samitier J
Sensors (Basel, Switzerland) 2021 Feb 16;21(4)
Sensors (Basel, Switzerland) 2021 Feb 16;21(4)
AMPK modulation ameliorates dominant disease phenotypes of CTRP5 variant in retinal degeneration.
Miyagishima KJ, Sharma R, Nimmagadda M, Clore-Gronenborn K, Qureshy Z, Ortolan D, Bose D, Farnoodian M, Zhang C, Fausey A, Sergeev YV, Abu-Asab M, Jun B, Do KV, Kautzman Guerin MA, Calandria J, George A, Guan B, Wan Q, Sharp RC, Cukras C, Sieving PA, Hufnagel RB, Bazan NG, Boesze-Battaglia K, Miller S, Bharti K
Communications biology 2021 Dec 9;4(1):1360
Communications biology 2021 Dec 9;4(1):1360
WNT11/ROR2 signaling is associated with tumor invasion and poor survival in breast cancer.
Menck K, Heinrichs S, Wlochowitz D, Sitte M, Noeding H, Janshoff A, Treiber H, Ruhwedel T, Schatlo B, von der Brelie C, Wiemann S, Pukrop T, Beißbarth T, Binder C, Bleckmann A
Journal of experimental & clinical cancer research : CR 2021 Dec 15;40(1):395
Journal of experimental & clinical cancer research : CR 2021 Dec 15;40(1):395
Three-Dimensional Aggregated Spheroid Model of Hepatocellular Carcinoma Using a 96-Pillar/Well Plate.
Lee SY, Teng Y, Son M, Ku B, Hwang HJ, Tergaonkar V, Chow PK, Lee DW, Nam DH
Molecules (Basel, Switzerland) 2021 Aug 16;26(16)
Molecules (Basel, Switzerland) 2021 Aug 16;26(16)
Tbx20 Induction Promotes Zebrafish Heart Regeneration by Inducing Cardiomyocyte Dedifferentiation and Endocardial Expansion.
Fang Y, Lai KS, She P, Sun J, Tao W, Zhong TP
Frontiers in cell and developmental biology 2020;8:738
Frontiers in cell and developmental biology 2020;8:738
Maternal administration of probiotics promotes gut development in mouse offsprings.
Yu Y, Lu J, Oliphant K, Gupta N, Claud K, Lu L
PloS one 2020;15(8):e0237182
PloS one 2020;15(8):e0237182
The impact of synthetic amorphous silica (E 551) on differentiated Caco-2 cells, a model for the human intestinal epithelium.
Hempt C, Kaiser JP, Scholder O, Buerki-Thurnherr T, Hofmann H, Rippl A, Schuster TB, Wick P, Hirsch C
Toxicology in vitro : an international journal published in association with BIBRA 2020 Sep;67:104903
Toxicology in vitro : an international journal published in association with BIBRA 2020 Sep;67:104903
Nanotopography Enhances Dynamic Remodeling of Tight Junction Proteins through Cytosolic Liquid Complexes.
Huang X, Shi X, Hansen ME, Setiady I, Nemeth CL, Celli A, Huang B, Mauro T, Koval M, Desai TA
ACS nano 2020 Oct 27;14(10):13192-13202
ACS nano 2020 Oct 27;14(10):13192-13202
Adhesion of Epithelial Cells to PNIPAm Treated Surfaces for Temperature-Controlled Cell-Sheet Harvesting.
Kim H, Witt H, Oswald TA, Tarantola M
ACS applied materials & interfaces 2020 Jul 29;12(30):33516-33529
ACS applied materials & interfaces 2020 Jul 29;12(30):33516-33529
Magnesium and vitamin C supplementation attenuates steroid-associated osteonecrosis in a rat model.
Zheng LZ, Wang JL, Xu JK, Zhang XT, Liu BY, Huang L, Zhang R, Zu HY, He X, Mi J, Pang QQ, Wang XL, Ruan YC, Zhao DW, Qin L
Biomaterials 2020 Apr;238:119828
Biomaterials 2020 Apr;238:119828
A Novel Three-Dimensional Glioma Blood-Brain Barrier Model for High-Throughput Testing of Tumoricidal Capability.
Sherman H, Rossi AE
Frontiers in oncology 2019;9:351
Frontiers in oncology 2019;9:351
Human gut derived-organoids provide model to study gluten response and effects of microbiota-derived molecules in celiac disease.
Freire R, Ingano L, Serena G, Cetinbas M, Anselmo A, Sapone A, Sadreyev RI, Fasano A, Senger S
Scientific reports 2019 May 7;9(1):7029
Scientific reports 2019 May 7;9(1):7029
PI3K-Yap activity drives cortical gyrification and hydrocephalus in mice.
Roy A, Murphy RM, Deng M, MacDonald JW, Bammler TK, Aldinger KA, Glass IA, Millen KJ
eLife 2019 May 16;8
eLife 2019 May 16;8
Human intestinal spheroids cultured using Sacrificial Micromolding as a model system for studying drug transport.
Samy KE, Levy ES, Phong K, Demaree B, Abate AR, Desai TA
Scientific reports 2019 Jul 9;9(1):9936
Scientific reports 2019 Jul 9;9(1):9936
Regional Differences in Tight Junction Protein Expression in the Blood-DRG Barrier and Their Alterations after Nerve Traumatic Injury in Rats.
Lux TJ, Hu X, Ben-Kraiem A, Blum R, Chen JT, Rittner HL
International journal of molecular sciences 2019 Dec 31;21(1)
International journal of molecular sciences 2019 Dec 31;21(1)
Generation of an inducible RPE-specific Cre transgenic-mouse line.
Schneider S, Hotaling N, Campos M, Patnaik SR, Bharti K, May-Simera HL
PloS one 2018;13(11):e0207222
PloS one 2018;13(11):e0207222
Long-Term In Vitro Expansion of Epithelial Stem Cells Enabled by Pharmacological Inhibition of PAK1-ROCK-Myosin II and TGF-β Signaling.
Zhang C, Lee HJ, Shrivastava A, Wang R, McQuiston TJ, Challberg SS, Pollok BA, Wang T
Cell reports 2018 Oct 16;25(3):598-610.e5
Cell reports 2018 Oct 16;25(3):598-610.e5
EPHB6 augments both development and drug sensitivity of triple-negative breast cancer tumours.
Toosi BM, El Zawily A, Truitt L, Shannon M, Allonby O, Babu M, DeCoteau J, Mousseau D, Ali M, Freywald T, Gall A, Vizeacoumar FS, Kirzinger MW, Geyer CR, Anderson DH, Kim T, Welm AL, Siegel P, Vizeacoumar FJ, Kusalik A, Freywald A
Oncogene 2018 Jul;37(30):4073-4093
Oncogene 2018 Jul;37(30):4073-4093
SNX16 Regulates the Recycling of E-Cadherin through a Unique Mechanism of Coordinated Membrane and Cargo Binding.
Xu J, Zhang L, Ye Y, Shan Y, Wan C, Wang J, Pei D, Shu X, Liu J
Structure (London, England : 1993) 2017 Aug 1;25(8):1251-1263.e5
Structure (London, England : 1993) 2017 Aug 1;25(8):1251-1263.e5
A multi-stage process including transient polyploidization and EMT precedes the emergence of chemoresistent ovarian carcinoma cells with a dedifferentiated and pro-inflammatory secretory phenotype.
Rohnalter V, Roth K, Finkernagel F, Adhikary T, Obert J, Dorzweiler K, Bensberg M, Müller-Brüsselbach S, Müller R
Oncotarget 2015 Nov 24;6(37):40005-25
Oncotarget 2015 Nov 24;6(37):40005-25
Cytoskeleton remodelling of confluent epithelial cells cultured on porous substrates.
Rother J, Büchsenschütz-Göbeler M, Nöding H, Steltenkamp S, Samwer K, Janshoff A
Journal of the Royal Society, Interface 2015 Feb 6;12(103)
Journal of the Royal Society, Interface 2015 Feb 6;12(103)
rpS6 regulates blood-testis barrier dynamics through Akt-mediated effects on MMP-9.
Mok KW, Mruk DD, Cheng CY
Journal of cell science 2014 Nov 15;127(Pt 22):4870-82
Journal of cell science 2014 Nov 15;127(Pt 22):4870-82
NLRP3 inflammasome blockade inhibits VEGF-A-induced age-related macular degeneration.
Marneros AG
Cell reports 2013 Sep 12;4(5):945-58
Cell reports 2013 Sep 12;4(5):945-58
Renal intercalated cells are rather energized by a proton than a sodium pump.
Chambrey R, Kurth I, Peti-Peterdi J, Houillier P, Purkerson JM, Leviel F, Hentschke M, Zdebik AA, Schwartz GJ, Hübner CA, Eladari D
Proceedings of the National Academy of Sciences of the United States of America 2013 May 7;110(19):7928-33
Proceedings of the National Academy of Sciences of the United States of America 2013 May 7;110(19):7928-33
Primordium of an artificial Bruch's membrane made of nanofibers for engineering of retinal pigment epithelium cell monolayers.
Warnke PH, Alamein M, Skabo S, Stephens S, Bourke R, Heiner P, Liu Q
Acta biomaterialia 2013 Dec;9(12):9414-22
Acta biomaterialia 2013 Dec;9(12):9414-22
Thrombin induces epithelial-mesenchymal transition and collagen production by retinal pigment epithelial cells via autocrine PDGF-receptor signaling.
Bastiaans J, van Meurs JC, van Holten-Neelen C, Nagtzaam NM, van Hagen PM, Chambers RC, Hooijkaas H, Dik WA
Investigative ophthalmology & visual science 2013 Dec 19;54(13):8306-14
Investigative ophthalmology & visual science 2013 Dec 19;54(13):8306-14
rpS6 Regulates blood-testis barrier dynamics by affecting F-actin organization and protein recruitment.
Mok KW, Mruk DD, Silvestrini B, Cheng CY
Endocrinology 2012 Oct;153(10):5036-48
Endocrinology 2012 Oct;153(10):5036-48
Microtubule affinity-regulating kinase 4 (MARK4) is a component of the ectoplasmic specialization in the rat testis.
Tang EI, Xiao X, Mruk DD, Qian XJ, Mok KW, Jenardhanan P, Lee WM, Mathur PP, Cheng CY
Spermatogenesis 2012 Apr 1;2(2):117-126
Spermatogenesis 2012 Apr 1;2(2):117-126
No comments: Submit comment
Supportive validation
- Submitted by
- Invitrogen Antibodies (provider)
- Main image

- Experimental details
- Immunofluorescence of Human Caco-2 cells stained with Mouse anti ZO-1 Monoclonal Antibody - Alexa Fluor® 488 (Product # 339188). DNA is counter stained with blue Hoechst 33258 (Product # H3569).
- Conjugate
- Green dye

- Submitted by
- Invitrogen Antibodies (provider)
- Main image

- Experimental details
- Immunofluorescence analysis of ZO-1 was performed using 90% confluent log phase Caco-2 cells. The cells were fixed with 4% paraformaldehyde for 10 minutes, permeabilized with 0.1% Triton™ X-100 for 10 minutes, and blocked with 1% BSA for 1 hour at room temperature. The cells were labeled with ZO-1 Monoclonal Antibody (ZO1-1A12), Alexa Fluor 488 at 5µg/mL in 0.1% BSA and incubated for 3 hours at room temperature (Panel a: green). Nuclei (Panel b: blue) were stained with SlowFade® Gold Antifade Mountant with DAPI (Product # S36938). F-actin (Panel c: red) was stained with Rhodamine Phalloidin (Product # R415, 1:300). Panel d represents the merged image showing junctional localization. Panel e shows the isotype control. The images were captured at 60X magnification.
- Conjugate
- Green dye

Supportive validation
- Submitted by
- Invitrogen Antibodies (provider)
- Main image

- Experimental details
- NULL
- Conjugate
- Green dye

- Submitted by
- Invitrogen Antibodies (provider)
- Main image

- Experimental details
- NULL
- Conjugate
- Green dye

- Submitted by
- Invitrogen Antibodies (provider)
- Main image

- Experimental details
- NULL
- Conjugate
- Green dye

- Submitted by
- Invitrogen Antibodies (provider)
- Main image

- Experimental details
- NULL
- Conjugate
- Green dye

- Submitted by
- Invitrogen Antibodies (provider)
- Main image
- Experimental details
- NULL
- Conjugate
- Green dye

- Submitted by
- Invitrogen Antibodies (provider)
- Main image

- Experimental details
- NULL
- Conjugate
- Green dye

- Submitted by
- Invitrogen Antibodies (provider)
- Main image

- Experimental details
- NULL
- Conjugate
- Green dye
- Submitted by
- Invitrogen Antibodies (provider)
- Main image

- Experimental details
- Figure 1. Human corneal endothelial cells cultured at [O 2 ] 2.5 demonstrate similar growth characteristics to cells grown at [O 2 ] A . (A) Phase-contrast microscopy of HCEnC cultures shows similar cell morphology under both culture conditions. (B) Immunofluorescence imaging for zonula occludens (ZO-1, green ) with DAPI-stained nuclei ( blue ) demonstrates similar integrity of tight junctions under both conditions (representative images from HCEnC cultures from n = 4 corneas). Quantification of cell characteristics for the data from four corneas. ECD, coefficient of variation (COV), and hexagonality (6A). (C) Western blot comparing CD44 expression in HCEnCs from three different donors grown at the different oxygen concentrations. CD44 expression levels were normalized to alpha-tubulin expression, showing the variability between donor corneas. (D) Senescence-associated beta-galactosidase staining ( black ) with DAPI-stained nuclei ( blue) shows similarities in percentage of senescent cells (mean +- SD: [O 2 ] A 58.3% +- 15.8%, and [O 2 ] 2.5 53.8% +- 21.4%).
- Conjugate
- Green dye

- Submitted by
- Invitrogen Antibodies (provider)
- Main image

- Experimental details
- Fig. 2 EPHB6 inhibits scattering of TNBC cells. a EPHB6-deficient TNBC cells, MDA-MB-231, were stably transfected with expression vectors encoding EPHB6 (MDA-B6), myc-tagged EPHB6 (MDA-B6-M), or mock-transfected with an empty vector (MDA-pc3). EPHB6 expression was analysed by Western blotting; tubulin and ERK2 represent loading controls. b MDA-pc3, MDA-B6 and MDA-B6-M cells were grown in individual colonies on glass coverslips in 24-well plates. Colonies were fixed and stained with phalloidin (red) and DAPI (blue). Representative colonies were imaged using an Olympus FV1000 confocal microscope with a 10x objective lens. Scale bar, 100 um, inserted using ImageJ. c Individual colonies of MDA-pc3, MDA-B6 and MDA-B6-M cells were fixed and stained with crystal violet in 6-well plates. Scattered and compact colonies were counted in six wells per cell line, using an inverted microscope. The graph represents the percentage of scattered colonies in each cell line. d TNBC cells, BT-20, were transduced with EPHB6-targeting shRNAs (shB6-1 or shB6-2, individually), as indicated. Transduction with non-silencing shRNA (BT20-NS) was used as a control. EPHB6 expression was analysed as in a , and quantitated by densitometry. EPHB6 quantifications were normalised on matching tubulin controls and presented in arbitrary units (AU). e Formation of scattered and compact colonies by BT20-NS, BT20-shB6-1 and BT20-shB6-2 cells was analysed as in c . f Representative confocal microscopy images of BT20
- Conjugate
- Green dye

- Submitted by
- Invitrogen Antibodies (provider)
- Main image

- Experimental details
- Figure 7 Induction of EMT after CPT treatment of SKOV3 cells A. RT-qPCR expression analysis of the indicated EMT marker genes after the indicated times of CPT treatment (sample size: n >= 3). B. Flow cytometry analysis of intracellular SMA after 0, 2 or 21 weeks of CPT treatment (sample size: n = 3). Values represent the fold change (FC) in the number of positive cells relative to small cells on day 0 (normalized to 1). Cells gated for small cells (forward and sideward scatter as untreated SKOV3 cells) and larger cells (forward and sideward scatter larger than for SKOV3 cells). C. Flow cytometry analysis of IL-1beta expression in SMA-expressing SKOV3-R cells gated as in panel B. D. Labeling of actin filaments with California Red-conjugated phalloidin (red) after different periods of CPT exposure. E. Additional staining of the tight junction (zonula occludens) protein constituent ZO-1 by indirect immunofluorescence (green) in untreated SKOV3 and SKOV3-R cells. Nuclei were stained with DAPI in panels D and E. F. RT-qPCR analysis of VIM expression in SKOV3-R cells (21w) and the same cells grown in the absence of CPT for 7 days. G. Pro-inflammatory and EMT marker gene expression after cyclic CPT treatment (1 day CPT, 21 days recovery, 4 cycles) compared to untreated cells (sample size: n = 3).
- Conjugate
- Green dye

- Submitted by
- Invitrogen Antibodies (provider)
- Main image

- Experimental details
- Figure 7 Quantification of ileal mucosal barrier dysfunction, n=4 in each group. HE staining and immunohistochemical staining of ZO-1, Occludin, TLR-9 and TLR-4 in ileal mucosal; The rest of the columns represent the expression levels of ZO-1, Occludin, TLR-9 and TLR-4 in ileal mucosal. Data were shown as mean +- SD. *P
- Conjugate
- Green dye

- Submitted by
- Invitrogen Antibodies (provider)
- Main image
- Experimental details
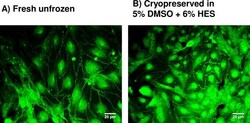
- Fig 3 Expression of ZO-1 in hCMEC/D3 cells. (A) Non-cryopreserved (fresh, unfrozen), or (B) cryopreserved in suspension by slow cooling in the presence of 5% DMSO and 6% HES, and then plunging into liquid nitrogen, and then rapidly thawed. Fresh cells and cryopreserved cells in suspension were seeded onto fibronectin-coated glass coverslips and allowed to reach confluency. The cell monolayers stained with ZO-1 antibody conjugated to Alexa Fluor 488 were imaged by fluorescent microscopy.
- Conjugate
- Green dye

- Submitted by
- Invitrogen Antibodies (provider)
- Main image
- Experimental details
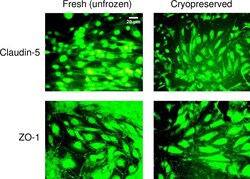
- Fig 7 Junction protein expression in fresh and cryopreserved hCMEC/D3 monolayers. The expression of claudin-5 and zonula occludens (ZO)-1 in hCMEC/D3 monolayers that were non-cryopreserved (fresh, unfrozen control), or were loaded with 5% DMSO, 6% HES, and 2% chondroitin sulfate, subjected to cooling at 1degC/min to -40degC, plunging and storage in liquid nitrogen, rapid thawing, and immediate cryoprotectant removal. Fresh and cryopreserved monolayers were stained with the corresponding antibody conjugated to Alexa Fluor 488. The scale bar for claudin-5-stained fresh, unfrozen cells applies to all images.
- Conjugate
- Green dye

- Submitted by
- Invitrogen Antibodies (provider)
- Main image

- Experimental details
- Figure 2 RTpi-MI, RTdi-MI and RTgutGC cell lines are composed of a heterogeneous population. ( A ) PCR amplicons of stem cell ( sox9 , hopx and lgr5 ), epithelial ( zo-1 , cldn3 and e-cad ) and connective tissue ( col1a1 and vim ), enterocyte ( iap ) and goblet cell ( muc1 ) genes in RTpi-MI, RTdi-MI and RTgutGC cell lines. ( B ) Representative immunofluorescence microphotographs showing zonula occludens (Zo-1, green, picture at the top) and collagen type 1 (Col1a1, green, picture at the bottom). DAPI (blue) was used to stain cell nuclei. Scale bar, 50 um. ( C ) Representative immunofluorescence microphotographs showing the in situ hybridization of ppib (red) in RTpi-MI (picture at the top), RTdi-MI (picture in the middle) and RTgutGC (picture at the bottom). DAPI (blue) was used to stain cell nuclei. Scale bar, 10 um. ( D ) Graphs reporting the percentage of ppib -expressing cells in RTpi-MI, RTdi-MI and RTgutGC cell lines. Data are reported as percentages (mean +- SD from 3 independent experiments) of ppib + cells on total cell count. Different superscript letters indicate statistical significance.
- Conjugate
- Green dye

- Submitted by
- Invitrogen Antibodies (provider)
- Main image

- Experimental details
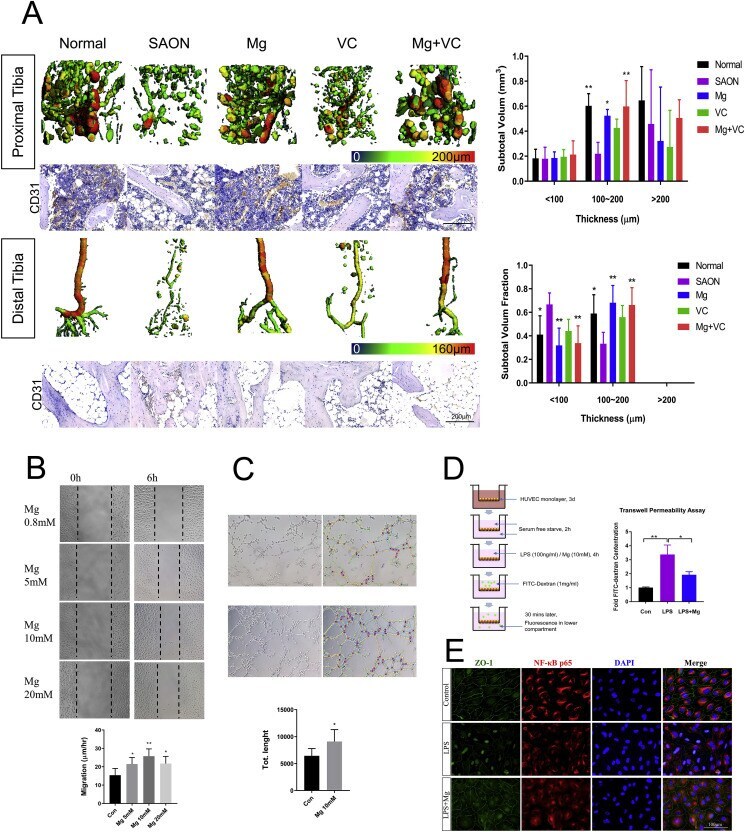
- Fig. 7 Mg promotes angiogenesis and reduces vessel leakage. (A) Representative 3D images of micro-CT based vessel architecture and CD31 IHC staining images in proximal tibia and distal tibia 2 weeks after SAON induction in each group. Histogram showed the subtotal volume of the small (200 mum) blood vessels/perfused microfil in each group in proximal (above) and distal tibia (below) (* p < 0.05, ** p < 0.01, n = 4). (B) Effect of Mg on endothelial cell migration. (C) Effect of Mg on endothelial cell tube formation. (* p < 0.05, ** p < 0.01, n = 4) (D) Transwell permeability assay showed the effect of Mg on endothelial cell leakage induced by LPS. (E) Co-IF-staining of ZO-1 and NF-kappaB p65 showed the coincidental effects of Mg on protecting the integrity of endothelial cell monolayer (showed by ZO-1 staining) and reducing the inflammation (showed by NF-kappaB p65 staining) induced by LPS. (* p < 0.05, ** p < 0.01, n = 4). Fig. 7
- Conjugate
- Green dye
- Submitted by
- Invitrogen Antibodies (provider)
- Main image

- Experimental details
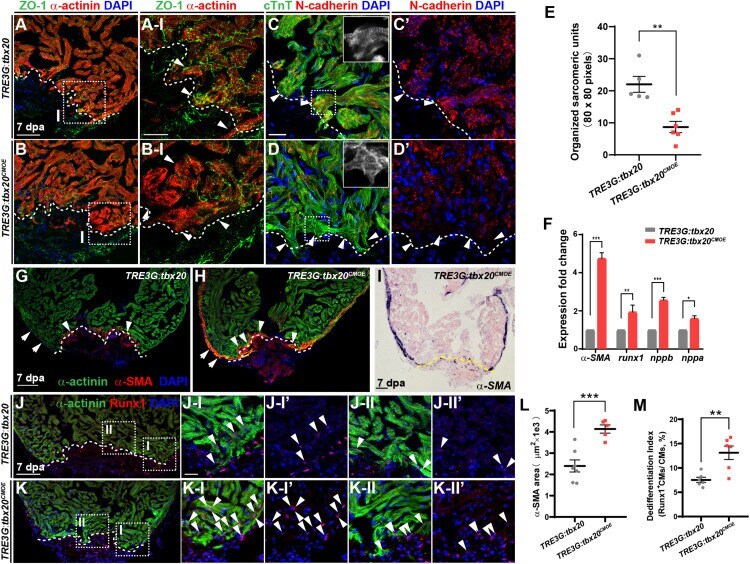
- FIGURE 3 tbx20 overexpression in the adult myocardium enhances CM dedifferentiation after injury. (A-D,G,H,J,K) Representative confocal fluorescence images of sections of injured ventricles from Tg ( TRE3G:tbx20 ) and Tg ( TRE3G:tbx20 CMOE ) zebrafish co-stained with antibodies against ZO-1 (green) and alpha-actinin (red) (A,B) , cTnT (green) and N-cadherin (red) (C,D) , alpha-SMA (red) and alpha-actinin (green) (G,H) , and Runx1 (red) and alpha-actinin (green) (J,K) . DAPI was used to stain nuclei. Boxed areas in (A,B,J,K) are magnified on the right with split channels. Insets in (C,D) show enlarged images of the dashed boxes. Arrowheads in (A-I, B-I) indicate CMs with disassembled sarcomeric structure in the border zone adjacent to the injury site. Arrowheads in (C,D) point to CMs adjacent to the injury site. Arrows and arrowheads in (G,H) indicate alpha-SMA + cells in the regenerating compact layer and trabecular layer, respectively. Arrowheads in (J,K) indicate Runx1 + alpha-actinin + CMs. (E) Quantification of organized sarcomeric units in cTnT-labeled myocardium (80 x 80 pixels) in border zone from 7 dpa ventricle sections of Tg ( TRE3G:tbx20 ) (C , n = 5) and Tg ( TRE3G:tbx20 CMOE ) ( D , n = 6) zebrafish. (F) Statistical analyses of qPCR for alpha-SMA , runx1 , nppb and nppa in the injured ventricle apices from Tg ( TRE3G:tbx20 ) and Tg ( TRE3G:tbx20 CMOE ) zebrafish at 7 dpa. (I) Representative images of ISH with alpha-SMA on 7 dpa heart sections from Tg ( TRE3G:tbx2
- Conjugate
- Green dye
- Submitted by
- Invitrogen Antibodies (provider)
- Main image

- Experimental details
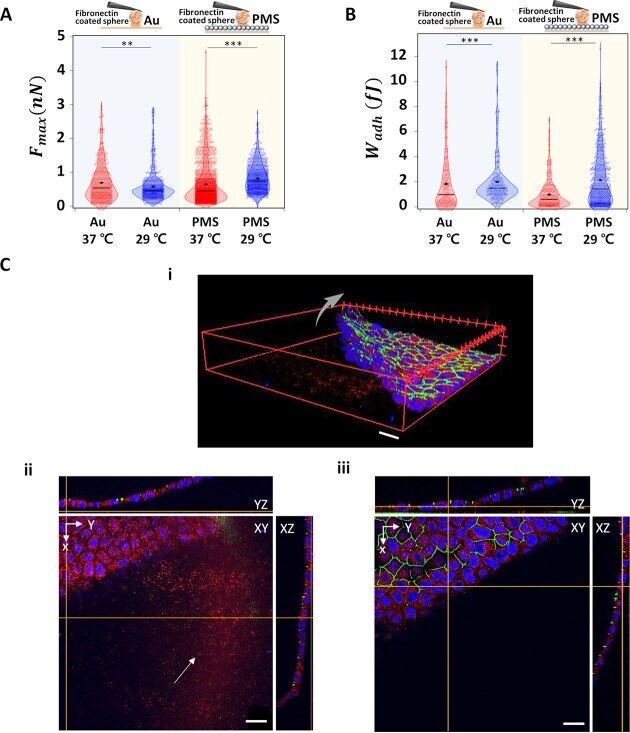
- Figure 4 Interaction between ECM component fibronectin and gold or PMS. (A) F max and (B) W adh of colloidal, fibronectin coated AFM cantilever to the gold substrate and PMS upon temperature switching (-- median value; * mean value). (C) Confocal images of 1 week cultured MDCK II cell sheet, thereupon fixated and stained for nuclear DNA (blue), ZO-1 (green), and the ECM component fibronectin (red) on the PMS. (i) 3D image of the detaching cell sheet from 7 days culture on PMS (arrow). (ii) Corresponding staining to i, with focus on substrate plane; remnant PMS-attached fibronectin highlighted (arrow). (iii) Corresponding to i, focal plane on apical cell membrane height: staining of tight junction protein ZO-1 is continuous between the cells. Scale bar: 20 mum. Significance test only shown for temperature changes; for all additional categories refer to Figure S14 and Table S5 .
- Conjugate
- Green dye
- Submitted by
- Invitrogen Antibodies (provider)
- Main image

- Experimental details
- Figure 5 Interaction between ECM components collagen I and gold or PMS. (A) F max and (B) W adh of colloidal, collagen-coated AFM cantilever to the gold substrate and PMS upon temperature switching (-- median value; * mean value). (C) Confocal images of MDCK II cultured for 1 week and cell sheet fixed and stained for nuclear DNA (blue), ZO-1 (green), and collagen 1 (magenta) after 7 days of culture on the PMS. (i) 3D image of the detaching cell sheet from the substrate (arrow). (ii) Corresponding staining to i, with focus on substrate plane: collagen I rarely remains attached to PMS. (iii) Corresponding to i, focal plane on apical cell membrane height: staining of tight junction protein ZO-1 is continuous between the cells. Scale bar: 10 mum. A significance test is only shown for temperature changes; for all additional categories refer to Figure S14 and Table S5 .
- Conjugate
- Green dye

- Submitted by
- Invitrogen Antibodies (provider)
- Main image
- Experimental details
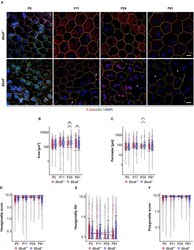
- Figure 6 Cell morphological defects are seen in Bbs8 -deficient RPE. (A) Representative images of RPE flatmounts stained for F-actin (red) and ZO-1 (green) to visualize cytoskeleton and cell membrane. DAPI was used to stain nuclear DNA. P11 Bbs8 -/- RPE shows discontinuous membrane staining (arrowheads). Starting in P29 Bbs8 -/- RPE shows larger areas of RPE cells with distorted or even completely disrupted cell membranes (asterisks). Scale bars: 10 mum. (B-F) Quantification of cell morphology parameters. Statistical analysis is described in methods. (B) Comparison of cell area of Bbs8 -/- and Bbs8 +/+ RPE cells reveals an increase of the mean ( p = 6.43 x 10 -45 ) and the variance ( p = 5.28 x 10 -52 ) of P29 Bbs8 -/- RPE cells and an increase of variance ( p = 0.0013) of P81 Bbs8 -/- RPE cells. (C) Comparison of cell perimeter of Bbs8 -/- and Bbs8 +/+ RPE cells reveals an increase of the mean ( p = 0.0342) and the variance ( p = 0.0272) of P29 Bbs8 -/- RPE cells. (D) Comparison of hexagonality score of Bbs8 -/- and Bbs8 +/+ RPE cells. The blue line depicts a trend toward cells being less hexagonal in the mutant over time. The opposite trend (red line) is observed in Bbs8 +/+ RPE. (E) The standard deviation of the hexagonality score trends upwards in the mutant (blue line). The opposite trend is observed in Bbs8 +/+ RPE (red line). (F) Comparison of polygonality score of Bbs8 -/- and Bbs8 +/+ RPE cells reveals a trend to more polygonal cells in Bbs8 -/- RPE with higher age (
- Conjugate
- Green dye

- Submitted by
- Invitrogen Antibodies (provider)
- Main image

- Experimental details
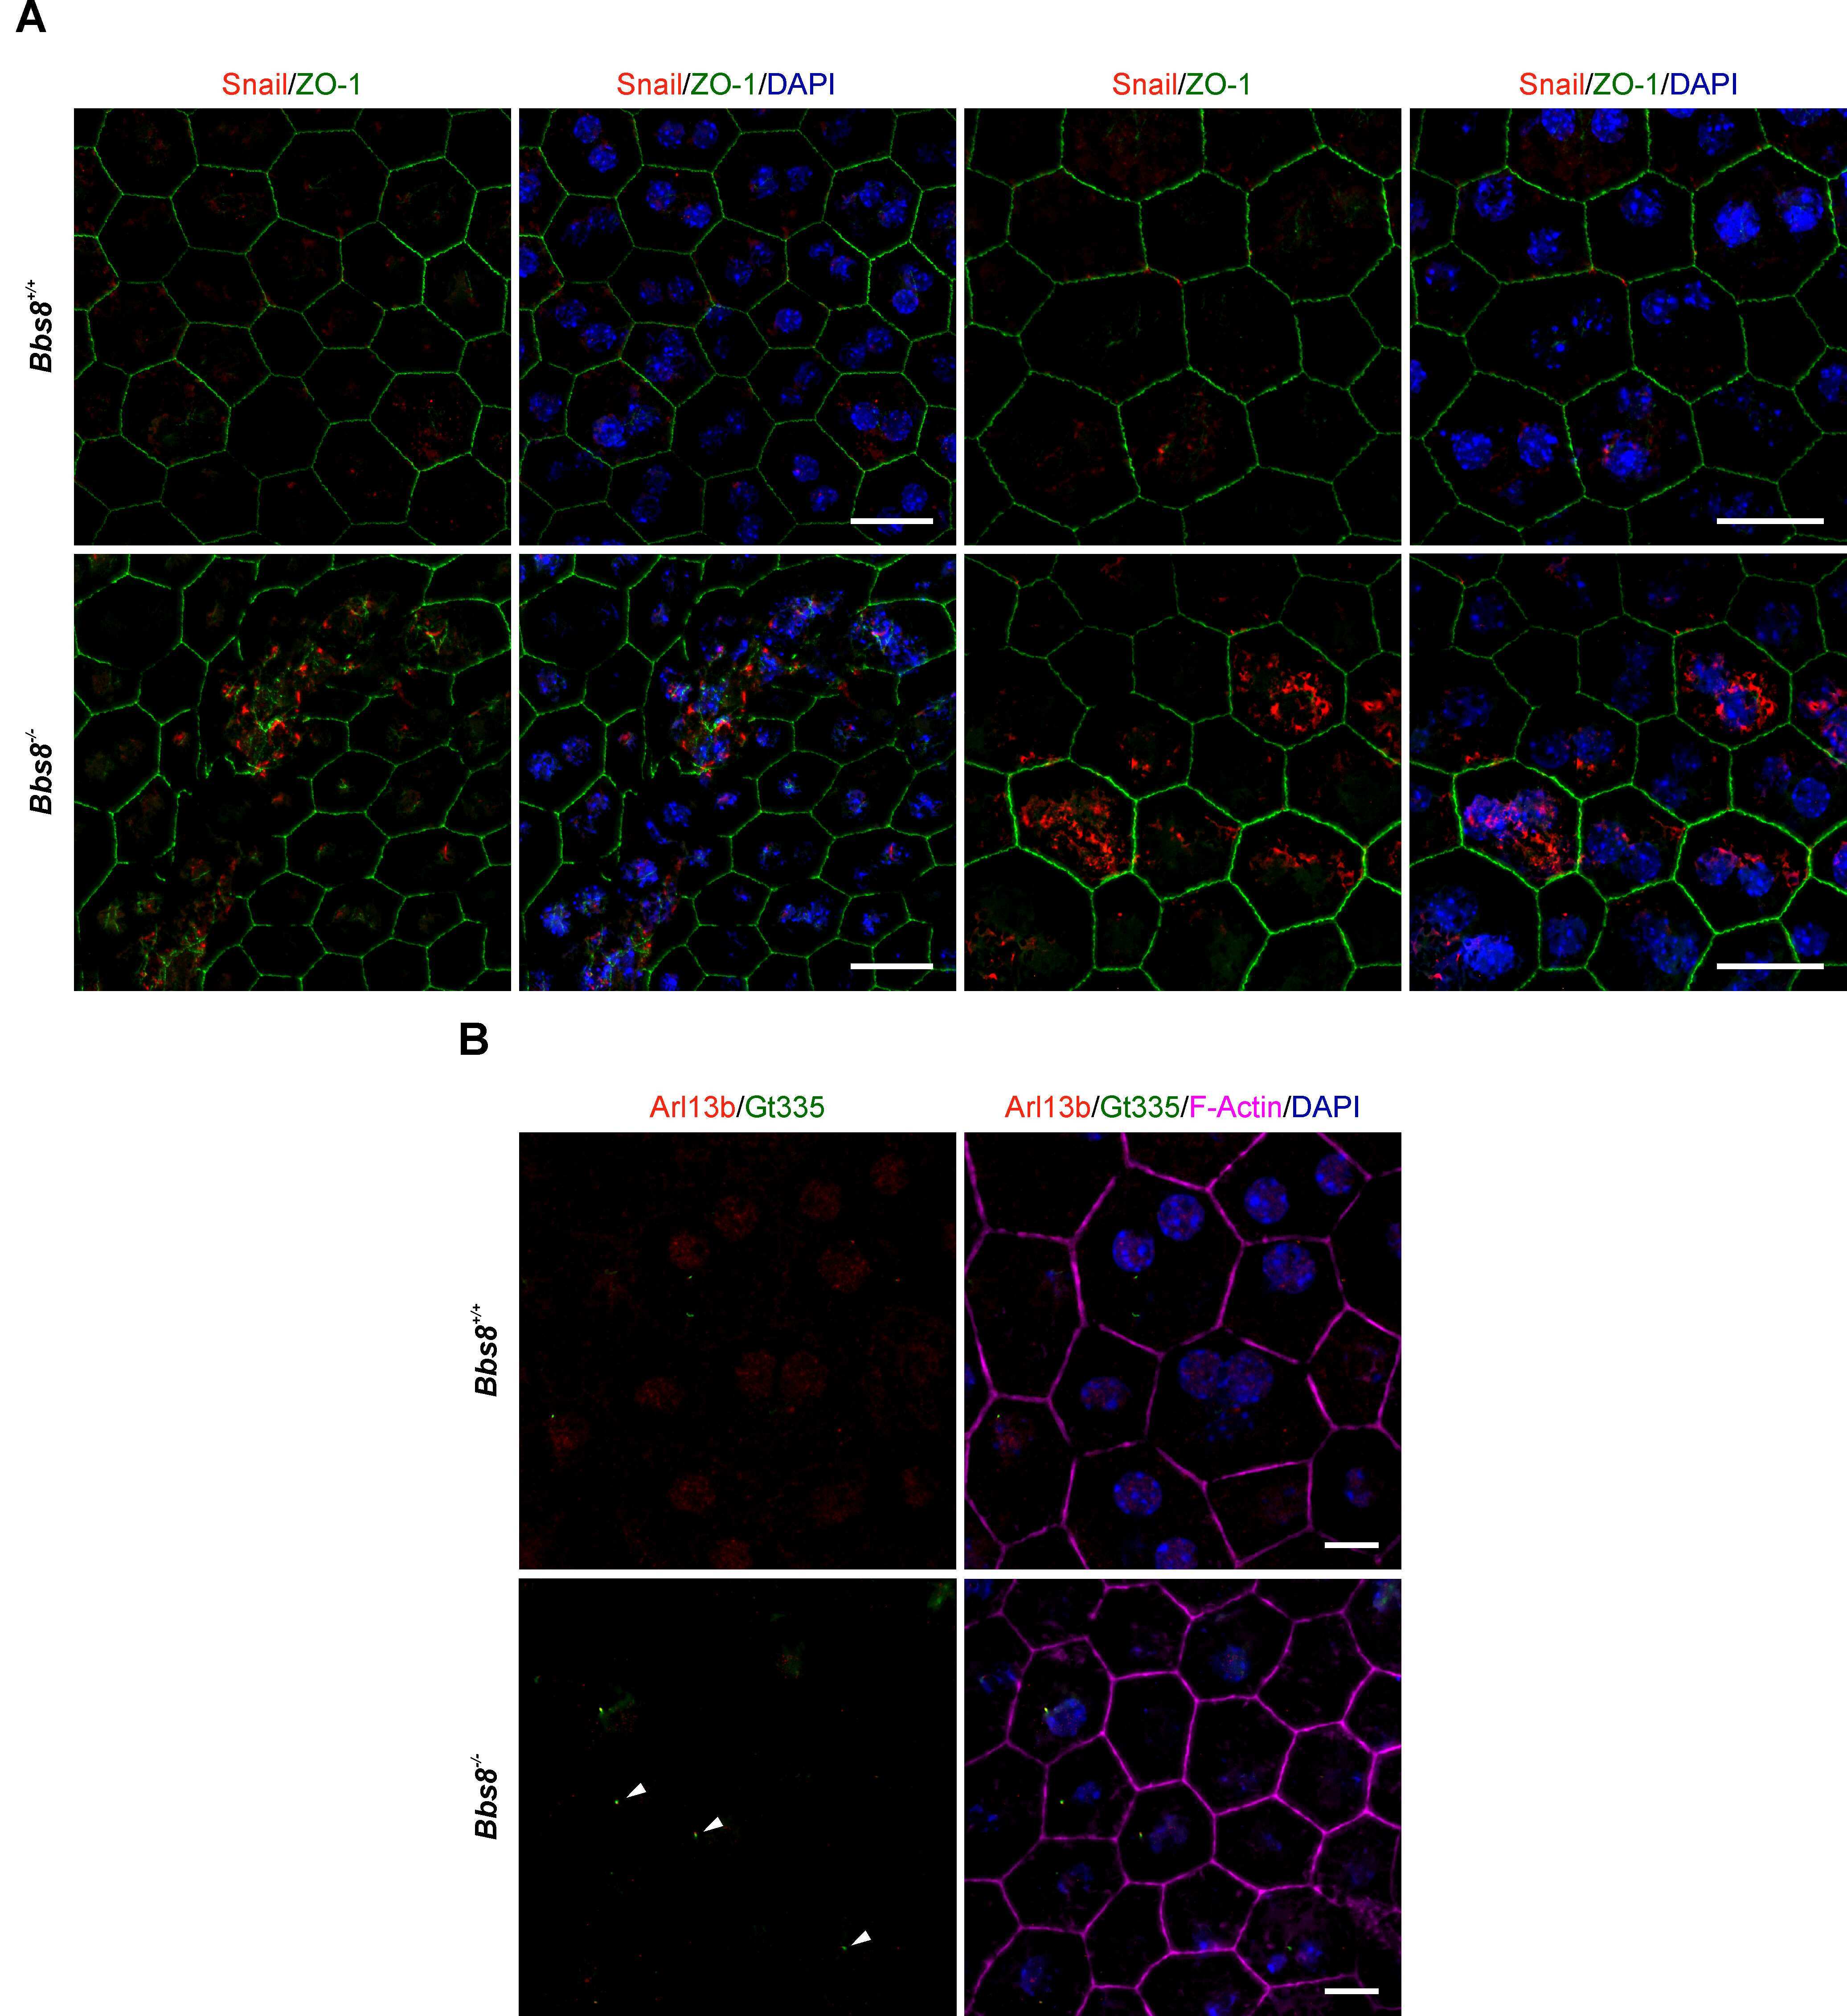
- Figure 8 Loss of Bbs8 induces EMT- like traits in the RPE. (A) GO terms associated with differentially expressed genes that were initially down-regulated at P11 and then up-regulated at P29. (B) Heatmap showing DEGs associated with epithelial-to-mesenchymal transition in the four experimental groups. shi (C) Quantitative gene expression shows a shift toward EMT-like associated gene expression profiles between P11 and P29. Snail expression shifts from down-regulation at P11 ( p = 0.0073) toward up-regulation at P29 ( p = 0.0096). Expression of Cldn19, Cdh1 , and Tjp1 shifts from an up-regulation ( Cldn19: p = 0.2681 , Cdh1: p = 0.0180 and Tjp1: p = 0.3439) at P11 toward a down-regulation at P29 ( Cldn19: p = 0.0919 , Cdh1: p = 0.0189 and Tjp1: p = 0.0028) (P11 n: Bbs8 -/- = 3-4, Bbs8 +/+ = 4; P29 n : Bbs8 -/- = 3-5, Bbs8 +/+ = 3-5). Statistical analysis was performed using one sample t -test. Cdh1: E-cadherin, Cldn19: Claudin 19, Snail: Snail, Tjp1: tight-junction protein 1 . (D) Representative images of P11 RPE flatmounts stained for Snail (red) and ZO-1 (green). DAPI was used to stain nuclear DNA. P11 Bbs8 -/- RPE shows an increase in Snail expression especially in cells with disrupted morphology. Scale bars: 10 mum. (E) Representative images of RPE flatmounts at P29, stained for primary cilia using Arl13b (red) and Gt335 (green). F-Actin (magenta) was stained to visualize the cytoskeleton and DAPI was used to stain nuclear DNA. Higher magnifications are indicated in the ima
- Conjugate
- Green dye

- Submitted by
- Invitrogen Antibodies (provider)
- Main image

- Experimental details
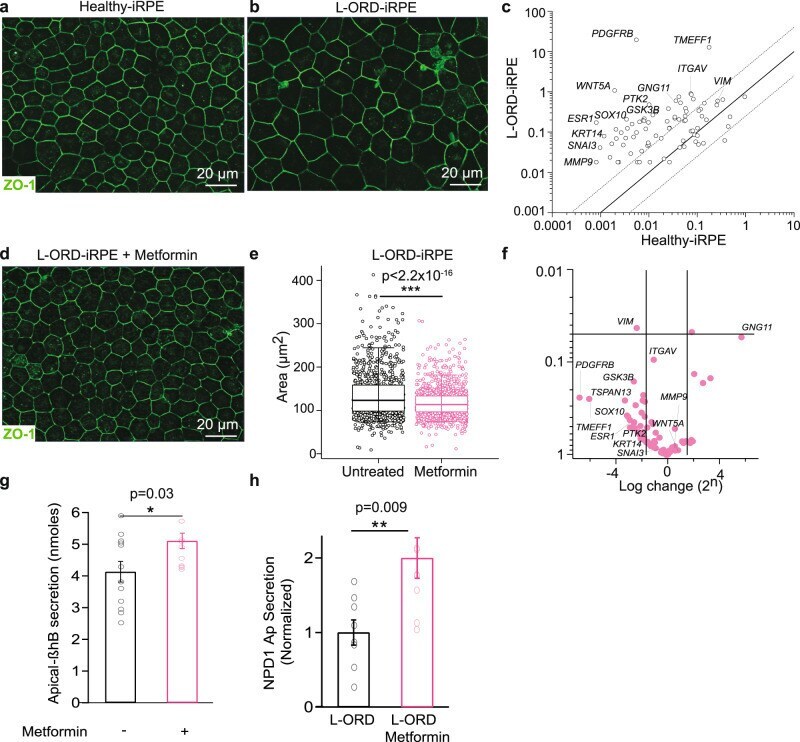
- Fig. 5 Metformin counteracts the increased susceptibility to dedifferentiation in L-ORD-iRPE. a , b Representative immunofluorescent images of the membrane marker ZO-1 (green) in healthy ( a ) and L-ORD-iRPE ( b ) following 7 consecutive days of POS uptake. Scale bar 20 um. c The effect of POS uptake on the expression of dedifferentiation-related genes in L-ORD-iRPE compared to healthy-iRPE. A dashed line indicates a fourfold difference. Housekeeping genes: ACTB and GAPDH . d Concurrent treatment of L-ORD-iRPE with metformin (3 mM) on POS-induced increase in cell size (ZO-1, green) after 7 days of POS uptake. Scale bar 20 um. e Quantification of cell area after 7 days of POS uptake and metformin (3 mM) treatment in L-ORD-iRPE. Cells were labeled with anti-ZO-1 antibody and area was quantified using an AI-based algorithm , low whisker: 5% of data, low hinge: 25% of data, midline: median, high hinge: 75% of data, high whisker: 95% of data. ( n = 6 images). f Expression of 31 dedifferentiation-related genes in metformin-treated (magenta) L-ORD-iRPE (fed POS for 7 days) compared to untreated cells. A dashed line indicates a fourfold difference. Housekeeping genes: ACTB and GAPDH . g Apically secreted beta-hydroxybutyrate (beta-HB) in L-ORD-iRPE after 1 week of metformin treatment. Cells were supplied with a beta-HB metabolic substrate, BSA-palmitate conjugate, for 3 h before measuring beta-HB levels ( n = 12). h Secreted NPD1 in untreated ( n = 8) and metformin-treated L-ORD-iRPE
- Conjugate
- Green dye
- Submitted by
- Invitrogen Antibodies (provider)
- Main image

- Experimental details
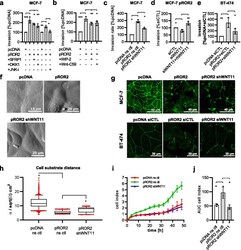
- Fig. 1 Expression of ROR2 induces a highly aggressive phenotype in breast cancer cells. a RNA-Seq: Gene expression of the four non-canonical WNT co-receptors ROR1, ROR2, PTK7 and RYK in normal breast (green) and matched breast cancer tissue (red) from the TNMplot database. Significance was calculated with a paired Wilcoxon statistical test. b Microarray gene expression data from 2075 breast cancer primary tumors were correlated with either poor ( 5 years) metastasis-free survival (MFS). Significance was calculated with a t-test. Boxes represent the 25-75th percentiles with the line at the median. Outliers are marked as small dots. c Progression-free survival (PFS) of 1067 breast cancer patients from TCGA stratified by ROR2 mRNA expression. d MCF-7, BT-474 and SK-BR-3 human breast cancer cells were transfected either with an empty vector (pcDNA) or with a hROR2 overexpression plasmid (pROR2). Transfection efficiency was confirmed by western blot. e Determination of the molecular breast cancer subtype based on RNA-Seq data from the indicated cell lines using the PAM50 gene signature. f RNA-Seq of MCF-7 cells: GSVA analysis for three independently published BRCAness gene expression signatures. g MTT assay: Cells were treated for 96 h with the indicated concentrations of olaparib (mean +- SD, n = 3, * p < 0.05). h Atomic force microscopy (AFM) of MCF-7 pcDNA and pROR2 cells. i Immunofluorescence staining of the tight junction marker ZO-1. j Electron micros
- Conjugate
- Green dye

- Submitted by
- Invitrogen Antibodies (provider)
- Main image
- Experimental details
- Fig. 4 WNT11 mediates the pro-tumoral effects of ROR2. a + b Invasion assay: MCF-7 pcDNA or pROR2 cells were treated with WNT inhibitors ( a ) or Porcupine inhibitors ( b ) (mean +- SD, n = 3, * p < 0.05, ** p < 0.01, *** p < 0.0001). Significance was calculated with a one-way ANOVA with Dunnett's multiple comparison test. c Invasion assay of MCF-7 pROR2 cells stably expressing a non-sense control (ns ctl) or WNT11 (shWNT11) shRNA (mean +- SD, n = 3, * p < 0.001). Significance was calculated with a one-way ANOVA with Dunnett's multiple comparison test. d Invasion of MCF-7 pROR2 cells transfected with control (siCTL) or WNT11 siRNA (siWNT11) +/- rhWNT11 (100 ng/ml) was assessed in Boyden chambers (mean +- SD, n = 3, * p < 0.05, ** p < 0.001). Significance was calculated with a one-way ANOVA with Dunnett's multiple comparison test. e Invasion assay of BT-474 pcDNA and pROR2 cells transfected with either siCTL or siWNT11 (mean +- SD, n = 3, * p < 0.05, ** p < 0.001). Significance was calculated with a one-way ANOVA with Dunnett's multiple comparison test. f AFM of cell-cell-junctions in the indicated cell lines. g Immunofluorescence for the tight junction protein ZO-1. h ECIS measurements of MCF-7 cells (box: 25-75th percentile, line at median, * p < 0.0001). Significance was calculated with a one-way ANOVA with Dunnett's multiple comparison test. i + j xCELLigence measurements of MCF-7 cells (mean +- SD). Shown is one representative example ( i ) and a corresponding Area Under
- Conjugate
- Green dye

- Submitted by
- Invitrogen Antibodies (provider)
- Main image

- Experimental details
- Figure 1. Human corneal endothelial cells cultured at [O 2 ] 2.5 demonstrate similar growth characteristics to cells grown at [O 2 ] A . (A) Phase-contrast microscopy of HCEnC cultures shows similar cell morphology under both culture conditions. (B) Immunofluorescence imaging for zonula occludens (ZO-1, green ) with DAPI-stained nuclei ( blue ) demonstrates similar integrity of tight junctions under both conditions (representative images from HCEnC cultures from n = 4 corneas). Quantification of cell characteristics for the data from four corneas. ECD, coefficient of variation (COV), and hexagonality (6A). (C) Western blot comparing CD44 expression in HCEnCs from three different donors grown at the different oxygen concentrations. CD44 expression levels were normalized to alpha-tubulin expression, showing the variability between donor corneas. (D) Senescence-associated beta-galactosidase staining ( black ) with DAPI-stained nuclei ( blue) shows similarities in percentage of senescent cells (mean +- SD: [O 2 ] A 58.3% +- 15.8%, and [O 2 ] 2.5 53.8% +- 21.4%).
- Conjugate
- Green dye

- Submitted by
- Invitrogen Antibodies (provider)
- Main image

- Experimental details
- Immunostained confluent MDCK II cells showing the F-actin (Phalloidin 546) in magenta, the cell junction protein ZO1 in green (anti-ZO1 Alexa Fluor 488 monoclonal antibody), and the nucleus in cyan (DAPI). The apical and basal parts, as well as the cell junctions of the layer in a strained and unstrained state, are shown, respectively. The arrows point to locations in the unstrained and strained state where the microvilli's number and structure can be compared. Scale bar is 20 mum.
- Conjugate
- Green dye

- Submitted by
- Invitrogen Antibodies (provider)
- Main image

- Experimental details
- Figure 1 Claudin-1 immunoreactivity (IR) and ZO-1 IR are preferentially found in epi-/perineurium in rats' dorsal root ganglia (DRGs), while claudin-19 IR is most abundant in the fiber-rich region. Classification into neuron rich region (NRR, green), NRR epi-/perineurium (EPN, black), fiber rich region (FRR, red), and FRR-EPN (blue) is shown in ( a ). Control DRG sections (CL) from Wistar rats were immunostained. IRs of claudin-1, claudin-5, and ZO-1 were quantified and compared between NRR and FRR, together with their putative EPN. Representative stainings for claudin-1 (red), claudin-5 (green) ( b ), claudin-12 ( c ), claudin-19 ( d ), and ZO-1 ( e ) are shown. Arrows point to structures identified as vessels ( b ), Schwann cells ( c ), and paranodes of Schwann cells ( d ). Quantification of the signal intensity in the specified areas ( f ). (Scale bars = 100 um; n = 5 or 6; claudin-1: NRR versus NRR-EPN, NRR versus FRR-EPN, FRR versus NRR-EPN, and FRR versus FRR-EPN: p < 0.0001; ZO-1: FRR-EPN versus NRR: p = 0.0003; FRR-EPN versus NRR-EPN: p = 0.0138; FRR-EPN versus NRR: p = 0.00018. No normal distribution: ZO-1 FRR. No variance homogeneity: claudin-1. Two-way ANOVA, Tukey HSD. * p < 0.05, *** p < 0.001).
- Conjugate
- Green dye

- Submitted by
- Invitrogen Antibodies (provider)
- Main image

- Experimental details
- Figure 4 Claudin-1 and ZO-1 IR are unchanged after CCI. DRG sections from Wistar rats with 7 d CCI and naive controls were immunostained. IRs of claudin-1, claudin-5, and ZO-1 were quantified and compared between IL and CL DRGs after CCI in the neuron rich region (NRR) and fiber rich region (FRR), and their putative EPN are presented as light intensity per um 2 . Representative sections of claudin-1 (red) and claudin-5 (green) ( a ), and ZO-1 (green) ( b ) are shown. Quantification of the signal intensity in the specified areas: significant differences between regions were not indicated, as they are already analyzed in Figure 1 ( c ). (Scale bars = 100 um. n = 5 or 6; claudin-1: NRR versus NRR-EPN, NRR versus FRR-EPN, FRR versus NRR-EPN, and FRR versus FRR-EPN: p < 0.0001; ZO-1: FRR-EPN versus NRR: p = 0.0003; FRR-EPN versus NRR-EPN: p = 0.0138; FRR-EPN versus NRR: p = 0.00018. No normal distribution: ZO-1 CL FRR. No variance homogeneity: claudin-1 CL. Two-way ANOVA, Tukey HSD).
- Conjugate
- Green dye

- Submitted by
- Invitrogen Antibodies (provider)
- Main image

- Experimental details
- Figure 7. Reduction of nYap by verteporfin re-establishes developing apical junctions and suppresses focal proliferation in Pik3ca H1047R mutant. ( a ) Schematics of P0 control and mutant (+-verteporfin) forebrain hemi-sections; boxes depict respective areas of interest. ( b-g ) P0 control untreated brain expressed cYap, adherens junction protein ZO-1 and radial glial markers Vimentin and Nestin, uniformly along the juxtaposed apical membranes. Ctip2 and Tbr2 were expressed in pyramidal neurons and IPs respectively. ( h-s' ) Verteporfin treatment significantly normalized Yap localization, from nucleus to cytoplasm, restored apical junctions and streamlined disrupted radial glial scaffold, as compared to the untreated P0 (dox E13.5 > E15.5) mutant gyri and sulci. ( t,u ) The treatment significantly reduced the total nYap + cell number in the mutant hippocampal gyri and sulci (F = 70.47, df = 32) as well as normalized the nYap + cell distribution to the control levels (F = 134.4, df = 96). This also significantly decreased the Tbr2 + progenitor population (F = 31.45, df = 35), especially in the mutant gyral zones, as quantitated in ( v ). This resulted in attenuation of the extent of gyrification and re-zippering of the apical membranes to halt the progressive ventriculomegaly. Data are represented as mean +- SEM in scatter plots ( t ); two-way ANOVA was followed by Tukey's post-tests. ns, not significant. Open arrowheads, disrupted/ectopic junctional and ependymal protein
- Conjugate
- Green dye
