Explore
 Validate
 Learn
Learn Immunohistochemistry
 Flow cytometry
Antibody data
- Antibody Data
- Antigen structure
- References [42]
- Comments [0]
- Validations
- Flow cytometry [2]
- Other assay [32]
Submit
Validation data
Reference
Comment
Report error
- Product number
- 14-0118-37 - Provider product page

- Provider
- Invitrogen Antibodies
- Product name
- CD11b Monoclonal Antibody (ICRF44), eBioscience™
- Antibody type
- Monoclonal
- Antigen
- Other
- Description
- Description: The ICRF44 monoclonal antibody reacts with human CD11b, a 165 kDa adhesion molecule. CD11b associated with integrin beta2 (CD18) is expressed on the surface of monocytes, granulocytes, activated lymphocytes and a subset of NK cells. CD11b is a receptor for intercellular adhesion molecule family members CD54, CD102 and CD50 as well as for iC3b. These adhesions are crucial in cell-cell and cell-matrix interactions. Applications Reported: The ICRF44 antibody has been reported for use in flow cytometric analysis, and immunohistochemical staining on formaldehyde fixed tissue. ICRF44 has also been reported in inhibition of aggregation of PMNs. Applications Tested: The ICRF44 antibody has been tested by flow cytometric analysis of normal human peripheral blood cells. This can be used at less than or equal to 1 µg per test. A test is defined as the amount (µg) of antibody that will stain a cell sample in a final volume of 100 µL. Cell number should be determined empirically but can range from 10^5 to 10^8 cells/test. It is recommended that the antibody be carefully titrated for optimal performance in the assay of interest. Purity: Greater than 90%, as determined by SDS-PAGE. Aggregation: Less than 10%, as determined by HPLC. Filtration: 0.2 µm post-manufacturing filtered.
- Reactivity
- Human
- Host
- Mouse
- Isotype
- IgG
- Antibody clone number
- ICRF44
- Vial size
- 2 mg
- Concentration
- 0.5 mg/mL
- Storage
- 4°C
Submitted references Prognostic Lnc-S100B-2 Affects Cell Apoptosis and Microenvironment of Colorectal Cancer through MLLT10 Signaling.
The Transcription of ZIP9 Is Associated With the Macrophage Polarization and the Pathogenesis of Hepatocellular Carcinoma.
Methylation of SPRED1: A New Target in Acute Myeloid Leukemia.
Post-amputation reactive oxygen species production is necessary for axolotls limb regeneration.
miR-204-containing exosomes ameliorate GVHD-associated dry eye disease.
Different Induction of PD-L1 (CD274) and PD-1 (CD279) Expression in THP-1-Differentiated Types 1 and 2 Macrophages.
G-MDSCs promote aging-related cardiac fibrosis by activating myofibroblasts and preventing senescence.
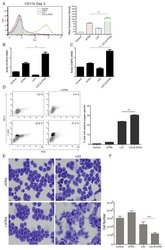
The long non-coding RNA Cancer Susceptibility 15 (CASC15) is induced by isocitrate dehydrogenase (IDH) mutations and maintains an immature phenotype in adult acute myeloid leukemia.
Connecting METTL3 and intratumoural CD33(+) MDSCs in predicting clinical outcome in cervical cancer.
Phase I Study of Ficlatuzumab and Cetuximab in Cetuximab-Resistant, Recurrent/Metastatic Head and Neck Cancer.
Galectin-9 promotes a suppressive microenvironment in human cancer by enhancing STING degradation.
Ubiquitin-specific peptidase 3 induces TPA-mediated leukemia cell differentiation via regulating H2AK119ub.
Gene-centric functional dissection of human genetic variation uncovers regulators of hematopoiesis.
TLR1/2 ligand enhances antitumor efficacy of CTLA-4 blockade by increasing intratumoral Treg depletion.
A rapid in vitro methodology for simultaneous target discovery and antibody generation against functional cell subpopulations.
Deacetylase activity-independent transcriptional activation by HDAC2 during TPA-induced HL-60 cell differentiation.
Microglia innately develop within cerebral organoids.
AURKA Suppresses Leukemic THP-1 Cell Differentiation through Inhibition of the KDM6B Pathway.
Accumulation of T-helper 22 cells, interleukin-22 and myeloid-derived suppressor cells promotes gastric cancer progression in elderly patients.
Macrophages are exploited from an innate wound healing response to facilitate cancer metastasis.
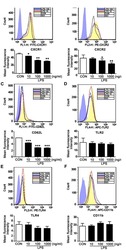
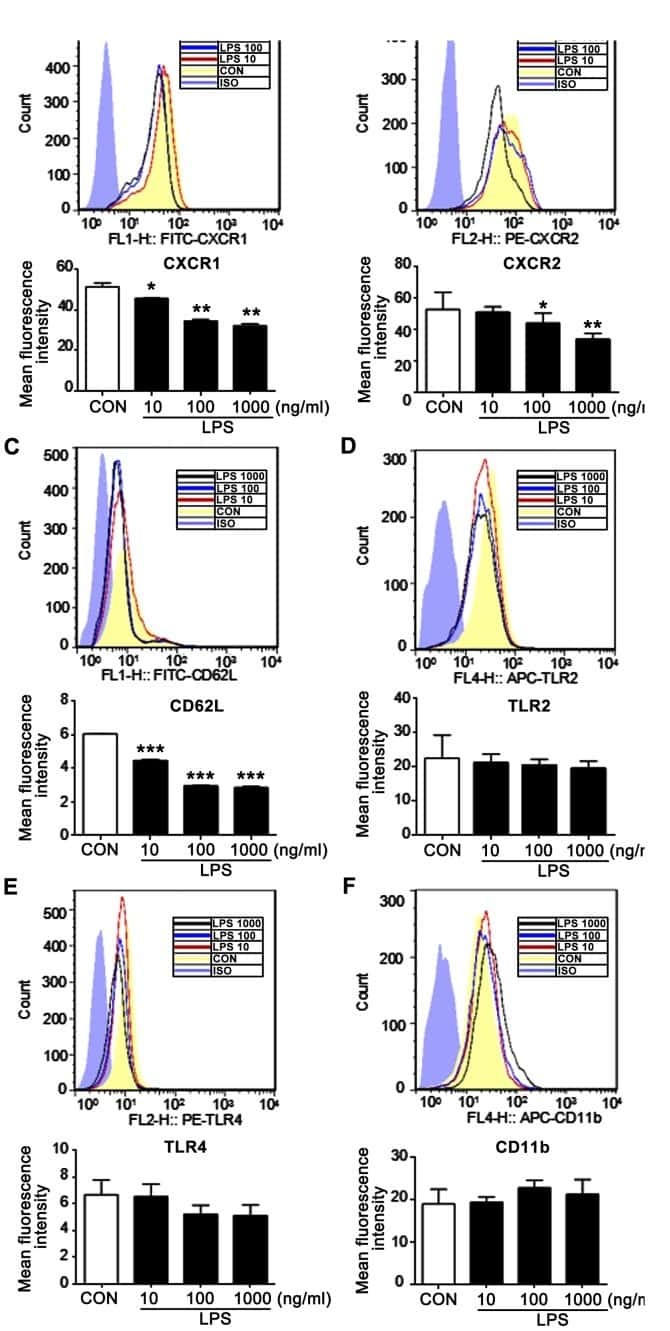
n-butanol extract from Folium isatidis inhibits the lipopolysaccharide-induced downregulation of CXCR1 and CXCR2 on human neutrophils.
Microbiome Influences Prenatal and Adult Microglia in a Sex-Specific Manner.
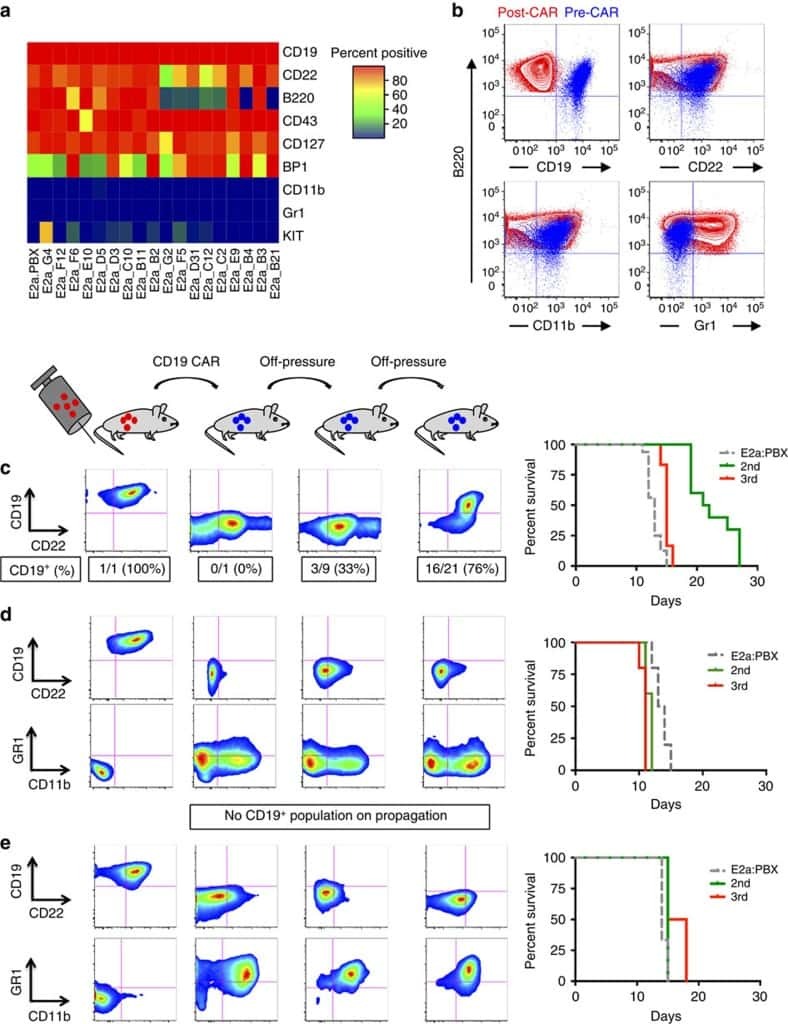
The prognostic significance of CD11b(+)CX3CR1(+) monocytes in patients with newly diagnosed diffuse large B-cell lymphoma.
CD19 CAR immune pressure induces B-precursor acute lymphoblastic leukaemia lineage switch exposing inherent leukaemic plasticity.
The prognostic effects of tumor infiltrating regulatory T cells and myeloid derived suppressor cells assessed by multicolor flow cytometry in gastric cancer patients.
Identification of Reprogrammed Myeloid Cell Transcriptomes in NSCLC.
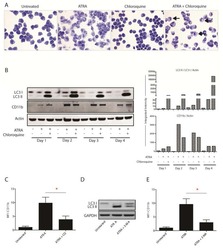
Induction of autophagy is a key component of all-trans-retinoic acid-induced differentiation in leukemia cells and a potential target for pharmacologic modulation.
dNP2 is a blood-brain barrier-permeable peptide enabling ctCTLA-4 protein delivery to ameliorate experimental autoimmune encephalomyelitis.
STK4 regulates TLR pathways and protects against chronic inflammation-related hepatocellular carcinoma.
Metabolic regulation of hepatitis B immunopathology by myeloid-derived suppressor cells.
Activation status of human microglia is dependent on lesion formation stage and remyelination in multiple sclerosis.
Microbe-specific unconventional T cells induce human neutrophil differentiation into antigen cross-presenting cells.
DNGR-1 is a specific and universal marker of mouse and human Batf3-dependent dendritic cells in lymphoid and nonlymphoid tissues.
Resolvin D1 limits polymorphonuclear leukocyte recruitment to inflammatory loci: receptor-dependent actions.
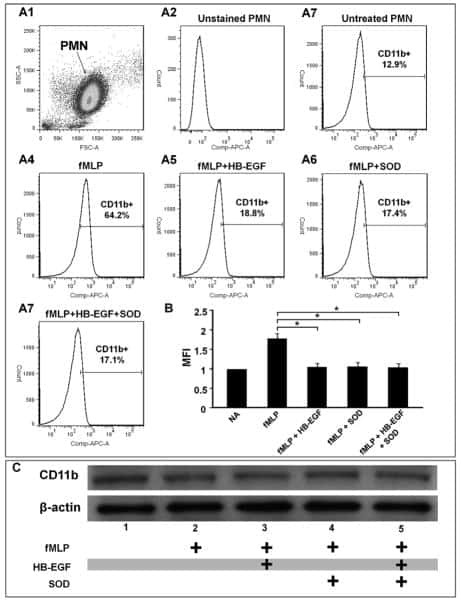
Heparin-binding epidermal growth factor-like growth factor (HB-EGF) preserves gut barrier function by blocking neutrophil-endothelial cell adhesion after hemorrhagic shock and resuscitation in mice.
Human neutrophil clearance of bacterial pathogens triggers anti-microbial γδ T cell responses in early infection.
Generation of bivalent chromatin domains during cell fate decisions.
Endogenous PMN sialidase activity exposes activation epitope on CD11b/CD18 which enhances its binding interaction with ICAM-1.
Characterization of human DNGR-1+ BDCA3+ leukocytes as putative equivalents of mouse CD8alpha+ dendritic cells.
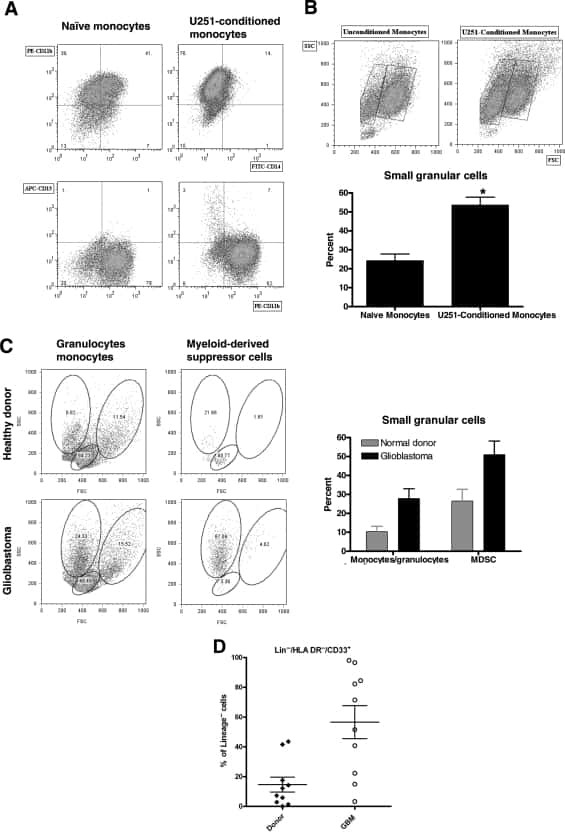
Normal human monocytes exposed to glioma cells acquire myeloid-derived suppressor cell-like properties.
IL-15 trans-presentation promotes human NK cell development and differentiation in vivo.
Membrane mobility of beta2 integrins and rolling associated adhesion molecules in resting neutrophils.
Yi J, Peng F, Zhao J, Gong X
Journal of oncology 2022;2022:3565118
Journal of oncology 2022;2022:3565118
The Transcription of ZIP9 Is Associated With the Macrophage Polarization and the Pathogenesis of Hepatocellular Carcinoma.
Gou Y, Yang D, Tian T, Zhu X, Zhang R, Ren J, Tu D, Luo Y, Miao Y, Zhao H, Wang Y, Wei B
Frontiers in immunology 2022;13:725595
Frontiers in immunology 2022;13:725595
Methylation of SPRED1: A New Target in Acute Myeloid Leukemia.
Su N, Wang Y, Lu X, Xu W, Wang H, Mo W, Pang H, Tang R, Li S, Yan X, Li Y, Zhang R
Frontiers in oncology 2022;12:854192
Frontiers in oncology 2022;12:854192
Post-amputation reactive oxygen species production is necessary for axolotls limb regeneration.
Carbonell-M B, Zapata Cardona J, Delgado JP
Frontiers in cell and developmental biology 2022;10:921520
Frontiers in cell and developmental biology 2022;10:921520
miR-204-containing exosomes ameliorate GVHD-associated dry eye disease.
Zhou T, He C, Lai P, Yang Z, Liu Y, Xu H, Lin X, Ni B, Ju R, Yi W, Liang L, Pei D, Egwuagu CE, Liu X
Science advances 2022 Jan 14;8(2):eabj9617
Science advances 2022 Jan 14;8(2):eabj9617
Different Induction of PD-L1 (CD274) and PD-1 (CD279) Expression in THP-1-Differentiated Types 1 and 2 Macrophages.
Lai CY, Tseng PC, Chen CL, Satria RD, Wang YT, Lin CF
Journal of inflammation research 2021;14:5241-5249
Journal of inflammation research 2021;14:5241-5249
G-MDSCs promote aging-related cardiac fibrosis by activating myofibroblasts and preventing senescence.
Sun SN, Ni SH, Li Y, Liu X, Deng JP, Chen ZX, Li H, Feng WJ, Huang YS, Li DN, Xian SX, Yang ZQ, Wang LJ, Lu L
Cell death & disease 2021 Jun 8;12(6):594
Cell death & disease 2021 Jun 8;12(6):594
The long non-coding RNA Cancer Susceptibility 15 (CASC15) is induced by isocitrate dehydrogenase (IDH) mutations and maintains an immature phenotype in adult acute myeloid leukemia.
Grasedieck S, Ruess C, Krowiorz K, Lux S, Pochert N, Schwarzer A, Klusmann JH, Jongen-Lavrencic M, Herold T, Bullinger L, Pollack JR, Rouhi A, Kuchenbauer F
Haematologica 2020 Sep 1;105(9):e448-453
Haematologica 2020 Sep 1;105(9):e448-453
Connecting METTL3 and intratumoural CD33(+) MDSCs in predicting clinical outcome in cervical cancer.
Ni HH, Zhang L, Huang H, Dai SQ, Li J
Journal of translational medicine 2020 Oct 15;18(1):393
Journal of translational medicine 2020 Oct 15;18(1):393
Phase I Study of Ficlatuzumab and Cetuximab in Cetuximab-Resistant, Recurrent/Metastatic Head and Neck Cancer.
Bauman JE, Ohr J, Gooding WE, Ferris RL, Duvvuri U, Kim S, Johnson JT, Soloff AC, Wallweber G, Winslow J, Gaither-Davis A, Grandis JR, Stabile LP
Cancers 2020 Jun 11;12(6)
Cancers 2020 Jun 11;12(6)
Galectin-9 promotes a suppressive microenvironment in human cancer by enhancing STING degradation.
Zhang CX, Huang DJ, Baloche V, Zhang L, Xu JX, Li BW, Zhao XR, He J, Mai HQ, Chen QY, Zhang XS, Busson P, Cui J, Li J
Oncogenesis 2020 Jul 6;9(7):65
Oncogenesis 2020 Jul 6;9(7):65
Ubiquitin-specific peptidase 3 induces TPA-mediated leukemia cell differentiation via regulating H2AK119ub.
Chae YC, Jung H, Kim JY, Lee DH, Seo SB
Animal cells and systems 2019;23(5):311-317
Animal cells and systems 2019;23(5):311-317
Gene-centric functional dissection of human genetic variation uncovers regulators of hematopoiesis.
Nandakumar SK, McFarland SK, Mateyka LM, Lareau CA, Ulirsch JC, Ludwig LS, Agarwal G, Engreitz JM, Przychodzen B, McConkey M, Cowley GS, Doench JG, Maciejewski JP, Ebert BL, Root DE, Sankaran VG
eLife 2019 May 9;8
eLife 2019 May 9;8
TLR1/2 ligand enhances antitumor efficacy of CTLA-4 blockade by increasing intratumoral Treg depletion.
Sharma N, Vacher J, Allison JP
Proceedings of the National Academy of Sciences of the United States of America 2019 May 21;116(21):10453-10462
Proceedings of the National Academy of Sciences of the United States of America 2019 May 21;116(21):10453-10462
A rapid in vitro methodology for simultaneous target discovery and antibody generation against functional cell subpopulations.
Nixon AML, Duque A, Yelle N, McLaughlin M, Davoudi S, Pedley NM, Haynes J, Brown KR, Pan J, Hart T, Gilbert PM, Singh SK, O'Brien CA, Sidhu SS, Moffat J
Scientific reports 2019 Jan 29;9(1):842
Scientific reports 2019 Jan 29;9(1):842
Deacetylase activity-independent transcriptional activation by HDAC2 during TPA-induced HL-60 cell differentiation.
Jung H, Kim JY, Kim KB, Chae YC, Hahn Y, Kim JW, Seo SB
PloS one 2018;13(8):e0202935
PloS one 2018;13(8):e0202935
Microglia innately develop within cerebral organoids.
Ormel PR, Vieira de Sá R, van Bodegraven EJ, Karst H, Harschnitz O, Sneeboer MAM, Johansen LE, van Dijk RE, Scheefhals N, Berdenis van Berlekom A, Ribes Martínez E, Kling S, MacGillavry HD, van den Berg LH, Kahn RS, Hol EM, de Witte LD, Pasterkamp RJ
Nature communications 2018 Oct 9;9(1):4167
Nature communications 2018 Oct 9;9(1):4167
AURKA Suppresses Leukemic THP-1 Cell Differentiation through Inhibition of the KDM6B Pathway.
Park JW, Cho H, Oh H, Kim JY, Seo SB
Molecules and cells 2018 May 31;41(5):444-453
Molecules and cells 2018 May 31;41(5):444-453
Accumulation of T-helper 22 cells, interleukin-22 and myeloid-derived suppressor cells promotes gastric cancer progression in elderly patients.
Chen X, Wang Y, Wang J, Wen J, Jia X, Wang X, Zhang H
Oncology letters 2018 Jul;16(1):253-261
Oncology letters 2018 Jul;16(1):253-261
Macrophages are exploited from an innate wound healing response to facilitate cancer metastasis.
Muliaditan T, Caron J, Okesola M, Opzoomer JW, Kosti P, Georgouli M, Gordon P, Lall S, Kuzeva DM, Pedro L, Shields JD, Gillett CE, Diebold SS, Sanz-Moreno V, Ng T, Hoste E, Arnold JN
Nature communications 2018 Jul 27;9(1):2951
Nature communications 2018 Jul 27;9(1):2951
n-butanol extract from Folium isatidis inhibits the lipopolysaccharide-induced downregulation of CXCR1 and CXCR2 on human neutrophils.
Wu B, Wang L, Jiang L, Dong L, Xu F, Lu Y, Jin J, Wang Z, Liang G, Shan X
Molecular medicine reports 2018 Jan;17(1):179-185
Molecular medicine reports 2018 Jan;17(1):179-185
Microbiome Influences Prenatal and Adult Microglia in a Sex-Specific Manner.
Thion MS, Low D, Silvin A, Chen J, Grisel P, Schulte-Schrepping J, Blecher R, Ulas T, Squarzoni P, Hoeffel G, Coulpier F, Siopi E, David FS, Scholz C, Shihui F, Lum J, Amoyo AA, Larbi A, Poidinger M, Buttgereit A, Lledo PM, Greter M, Chan JKY, Amit I, Beyer M, Schultze JL, Schlitzer A, Pettersson S, Ginhoux F, Garel S
Cell 2018 Jan 25;172(3):500-516.e16
Cell 2018 Jan 25;172(3):500-516.e16
The prognostic significance of CD11b(+)CX3CR1(+) monocytes in patients with newly diagnosed diffuse large B-cell lymphoma.
Yhim HY, Kim JA, Ko SH, Park Y, Yim E, Kim HS, Kwak JY
Oncotarget 2017 Nov 3;8(54):92289-92299
Oncotarget 2017 Nov 3;8(54):92289-92299
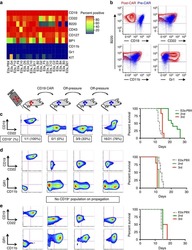
CD19 CAR immune pressure induces B-precursor acute lymphoblastic leukaemia lineage switch exposing inherent leukaemic plasticity.
Jacoby E, Nguyen SM, Fountaine TJ, Welp K, Gryder B, Qin H, Yang Y, Chien CD, Seif AE, Lei H, Song YK, Khan J, Lee DW, Mackall CL, Gardner RA, Jensen MC, Shern JF, Fry TJ
Nature communications 2016 Jul 27;7:12320
Nature communications 2016 Jul 27;7:12320
The prognostic effects of tumor infiltrating regulatory T cells and myeloid derived suppressor cells assessed by multicolor flow cytometry in gastric cancer patients.
Choi HS, Ha SY, Kim HM, Ahn SM, Kang MS, Kim KM, Choi MG, Lee JH, Sohn TS, Bae JM, Kim S, Kang ES
Oncotarget 2016 Feb 16;7(7):7940-51
Oncotarget 2016 Feb 16;7(7):7940-51
Identification of Reprogrammed Myeloid Cell Transcriptomes in NSCLC.
Durrans A, Gao D, Gupta R, Fischer KR, Choi H, El Rayes T, Ryu S, Nasar A, Spinelli CF, Andrews W, Elemento O, Nolan D, Stiles B, Rafii S, Narula N, Davuluri R, Altorki NK, Mittal V
PloS one 2015;10(6):e0129123
PloS one 2015;10(6):e0129123
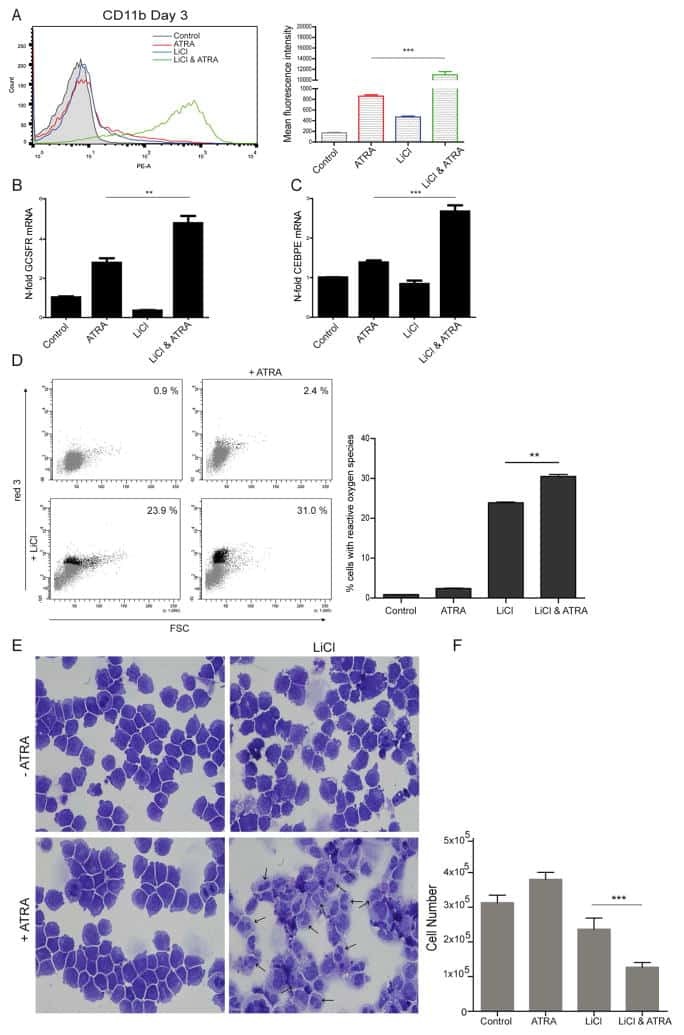
Induction of autophagy is a key component of all-trans-retinoic acid-induced differentiation in leukemia cells and a potential target for pharmacologic modulation.
Orfali N, O'Donovan TR, Nyhan MJ, Britschgi A, Tschan MP, Cahill MR, Mongan NP, Gudas LJ, McKenna SL
Experimental hematology 2015 Sep;43(9):781-93.e2
Experimental hematology 2015 Sep;43(9):781-93.e2
dNP2 is a blood-brain barrier-permeable peptide enabling ctCTLA-4 protein delivery to ameliorate experimental autoimmune encephalomyelitis.
Lim S, Kim WJ, Kim YH, Lee S, Koo JH, Lee JA, Yoon H, Kim DH, Park HJ, Kim HM, Lee HG, Yun Kim J, Lee JU, Hun Shin J, Kyun Kim L, Doh J, Kim H, Lee SK, Bothwell ALM, Suh M, Choi JM
Nature communications 2015 Sep 15;6:8244
Nature communications 2015 Sep 15;6:8244
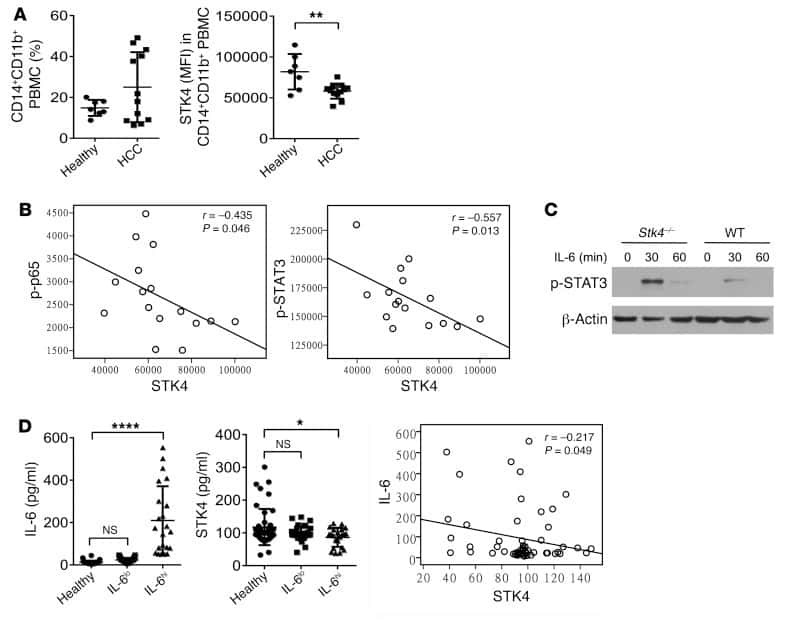
STK4 regulates TLR pathways and protects against chronic inflammation-related hepatocellular carcinoma.
Li W, Xiao J, Zhou X, Xu M, Hu C, Xu X, Lu Y, Liu C, Xue S, Nie L, Zhang H, Li Z, Zhang Y, Ji F, Hui L, Tao W, Wei B, Wang H
The Journal of clinical investigation 2015 Nov 2;125(11):4239-54
The Journal of clinical investigation 2015 Nov 2;125(11):4239-54
Metabolic regulation of hepatitis B immunopathology by myeloid-derived suppressor cells.
Pallett LJ, Gill US, Quaglia A, Sinclair LV, Jover-Cobos M, Schurich A, Singh KP, Thomas N, Das A, Chen A, Fusai G, Bertoletti A, Cantrell DA, Kennedy PT, Davies NA, Haniffa M, Maini MK
Nature medicine 2015 Jun;21(6):591-600
Nature medicine 2015 Jun;21(6):591-600
Activation status of human microglia is dependent on lesion formation stage and remyelination in multiple sclerosis.
Peferoen LA, Vogel DY, Ummenthum K, Breur M, Heijnen PD, Gerritsen WH, Peferoen-Baert RM, van der Valk P, Dijkstra CD, Amor S
Journal of neuropathology and experimental neurology 2015 Jan;74(1):48-63
Journal of neuropathology and experimental neurology 2015 Jan;74(1):48-63
Microbe-specific unconventional T cells induce human neutrophil differentiation into antigen cross-presenting cells.
Davey MS, Morgan MP, Liuzzi AR, Tyler CJ, Khan MWA, Szakmany T, Hall JE, Moser B, Eberl M
Journal of immunology (Baltimore, Md. : 1950) 2014 Oct 1;193(7):3704-3716
Journal of immunology (Baltimore, Md. : 1950) 2014 Oct 1;193(7):3704-3716
DNGR-1 is a specific and universal marker of mouse and human Batf3-dependent dendritic cells in lymphoid and nonlymphoid tissues.
Poulin LF, Reyal Y, Uronen-Hansson H, Schraml BU, Sancho D, Murphy KM, Håkansson UK, Moita LF, Agace WW, Bonnet D, Reis e Sousa C
Blood 2012 Jun 21;119(25):6052-62
Blood 2012 Jun 21;119(25):6052-62
Resolvin D1 limits polymorphonuclear leukocyte recruitment to inflammatory loci: receptor-dependent actions.
Norling LV, Dalli J, Flower RJ, Serhan CN, Perretti M
Arteriosclerosis, thrombosis, and vascular biology 2012 Aug;32(8):1970-8
Arteriosclerosis, thrombosis, and vascular biology 2012 Aug;32(8):1970-8
Heparin-binding epidermal growth factor-like growth factor (HB-EGF) preserves gut barrier function by blocking neutrophil-endothelial cell adhesion after hemorrhagic shock and resuscitation in mice.
Zhang HY, James I, Chen CL, Besner GE
Surgery 2012 Apr;151(4):594-605
Surgery 2012 Apr;151(4):594-605
Human neutrophil clearance of bacterial pathogens triggers anti-microbial γδ T cell responses in early infection.
Davey MS, Lin CY, Roberts GW, Heuston S, Brown AC, Chess JA, Toleman MA, Gahan CG, Hill C, Parish T, Williams JD, Davies SJ, Johnson DW, Topley N, Moser B, Eberl M
PLoS pathogens 2011 May;7(5):e1002040
PLoS pathogens 2011 May;7(5):e1002040
Generation of bivalent chromatin domains during cell fate decisions.
De Gobbi M, Garrick D, Lynch M, Vernimmen D, Hughes JR, Goardon N, Luc S, Lower KM, Sloane-Stanley JA, Pina C, Soneji S, Renella R, Enver T, Taylor S, Jacobsen SE, Vyas P, Gibbons RJ, Higgs DR
Epigenetics & chromatin 2011 Jun 6;4(1):9
Epigenetics & chromatin 2011 Jun 6;4(1):9
Endogenous PMN sialidase activity exposes activation epitope on CD11b/CD18 which enhances its binding interaction with ICAM-1.
Feng C, Zhang L, Almulki L, Faez S, Whitford M, Hafezi-Moghadam A, Cross AS
Journal of leukocyte biology 2011 Aug;90(2):313-21
Journal of leukocyte biology 2011 Aug;90(2):313-21
Characterization of human DNGR-1+ BDCA3+ leukocytes as putative equivalents of mouse CD8alpha+ dendritic cells.
Poulin LF, Salio M, Griessinger E, Anjos-Afonso F, Craciun L, Chen JL, Keller AM, Joffre O, Zelenay S, Nye E, Le Moine A, Faure F, Donckier V, Sancho D, Cerundolo V, Bonnet D, Reis e Sousa C
The Journal of experimental medicine 2010 Jun 7;207(6):1261-71
The Journal of experimental medicine 2010 Jun 7;207(6):1261-71
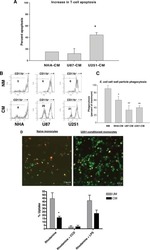
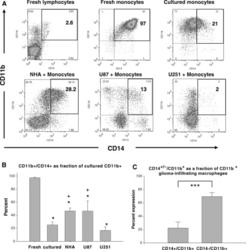
Normal human monocytes exposed to glioma cells acquire myeloid-derived suppressor cell-like properties.
Rodrigues JC, Gonzalez GC, Zhang L, Ibrahim G, Kelly JJ, Gustafson MP, Lin Y, Dietz AB, Forsyth PA, Yong VW, Parney IF
Neuro-oncology 2010 Apr;12(4):351-65
Neuro-oncology 2010 Apr;12(4):351-65
IL-15 trans-presentation promotes human NK cell development and differentiation in vivo.
Huntington ND, Legrand N, Alves NL, Jaron B, Weijer K, Plet A, Corcuff E, Mortier E, Jacques Y, Spits H, Di Santo JP
The Journal of experimental medicine 2009 Jan 16;206(1):25-34
The Journal of experimental medicine 2009 Jan 16;206(1):25-34
Membrane mobility of beta2 integrins and rolling associated adhesion molecules in resting neutrophils.
Gaborski TR, Clark A Jr, Waugh RE, McGrath JL
Biophysical journal 2008 Nov 15;95(10):4934-47
Biophysical journal 2008 Nov 15;95(10):4934-47
No comments: Submit comment
Supportive validation
- Submitted by
- Invitrogen Antibodies (provider)
- Main image
- Experimental details
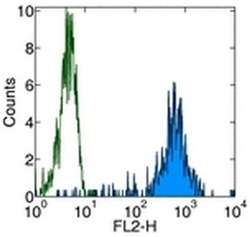
- Staining of normal human peripheral blood cells with Anti-Human CD11b PE. Autofluorescence is indicated by open histogram. Cells in the monocyte population were used for analysis.

- Submitted by
- Invitrogen Antibodies (provider)
- Main image

- Experimental details
- Staining of normal human peripheral blood cells with Anti-Human CD11b PE. Autofluorescence is indicated by open histogram. Cells in the monocyte population were used for analysis.

Supportive validation
- Submitted by
- Invitrogen Antibodies (provider)
- Main image
- Experimental details
- NULL

- Submitted by
- Invitrogen Antibodies (provider)
- Main image
- Experimental details
- NULL

- Submitted by
- Invitrogen Antibodies (provider)
- Main image

- Experimental details
- NULL
- Submitted by
- Invitrogen Antibodies (provider)
- Main image

- Experimental details
- NULL
- Submitted by
- Invitrogen Antibodies (provider)
- Main image
- Experimental details
- NULL

- Submitted by
- Invitrogen Antibodies (provider)
- Main image
- Experimental details
- NULL
- Submitted by
- Invitrogen Antibodies (provider)
- Main image
- Experimental details
- NULL
- Submitted by
- Invitrogen Antibodies (provider)
- Main image

- Experimental details
- NULL
- Submitted by
- Invitrogen Antibodies (provider)
- Main image
- Experimental details
- NULL
- Submitted by
- Invitrogen Antibodies (provider)
- Main image
- Experimental details
- NULL
- Submitted by
- Invitrogen Antibodies (provider)
- Main image

- Experimental details
- NULL
- Submitted by
- Invitrogen Antibodies (provider)
- Main image
- Experimental details
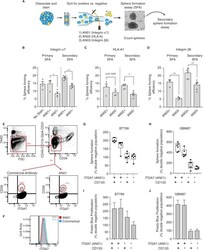
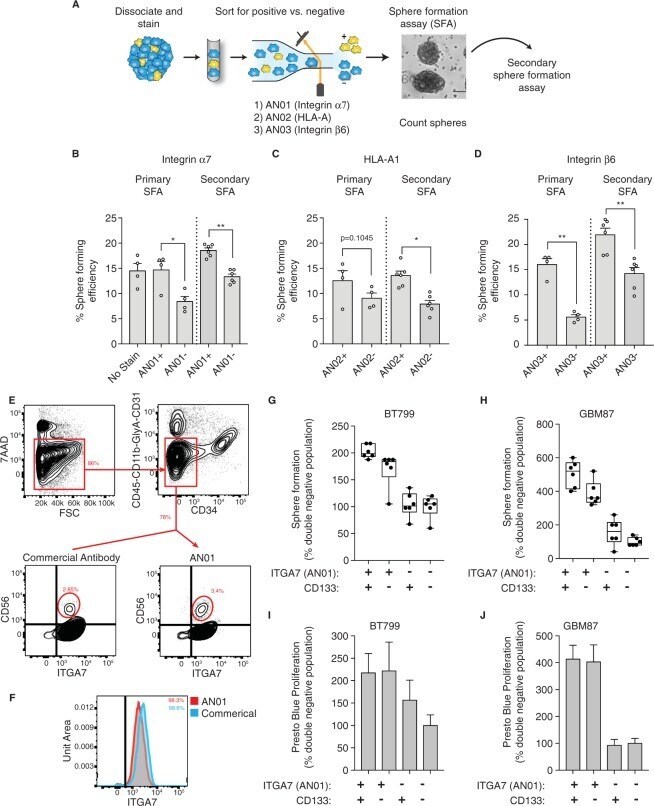
- Figure 2 AN01 and AN03 enrich for self-renewing CRC CICs, AN01 is a GBM and muscle stem cell marker. ( A ) Schematic of FACS approach. POP92 spheres were dissociated, stained with indicated antibody and viability dye, and top and bottom 10% of expressing cells were sorted into sphere formation assays (SFAs). Primary sphere formation was assessed by sphere counting. Primary spheres were dissociated, cells were counted and equal numbers were seeded into secondary SFAs. ( B ) Bar charts showing the mean sphere forming efficiency (SFE) as % of cells giving rise to a sphere, for FACS sorted high and low staining AN01 (integrin alpha7) and ( C ) AN02 (HLA-A1) and (D) AN03 (integrin beta6), with individual biological replicates indicated as unfilled circles. The primary SFA is shown to the left of the dotted vertical line, and the secondary SFA is shown to the right. Error bars represent SEM, and significance was calculated by paired, two tailed t-test. ( E ) Human muscle stem cells are readily detected by FACS. Biopsy sample is initially gated for live (7-AAD negative left), CD45, CD31, Cd11b, Glycophorin A, CD31, and CD34 all negative (top). True human muscle stem cells are detected by selecting CD56 and integrin alpha7 double positive cells with both AN01 (right) and the commercial antibody (left). ( F ) Histograms of cells stained with AN01 and commercial antibody reveal the same percentage of integrin alpha7 positive cells after gating for live and lineage negative cells. ( G ,
- Submitted by
- Invitrogen Antibodies (provider)
- Main image
- Experimental details
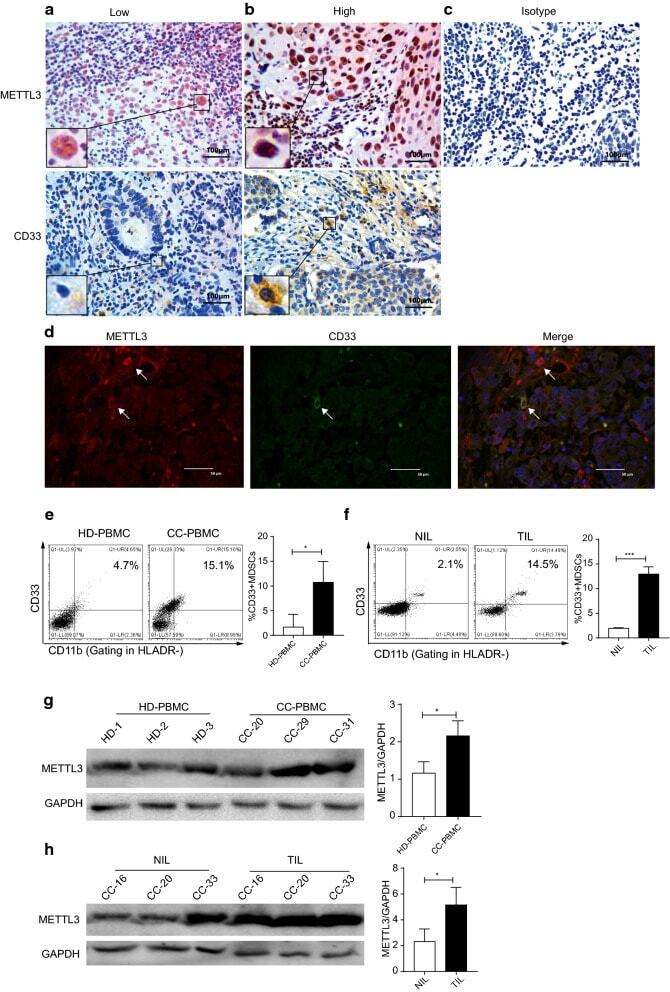
- Fig. 1 METTL3 expression and CD33 + MDSC distribution in patients with CC. a , b The immunohistochemical staining for METL3 and CD33 CC specimens (x 400). c The isotype antibody IgG was included (x 400). d Immunofluorescence staining for METTL3 (red) and CD33 + (green) in CC specimens; the white arrows point to the METTL3 + and CD33 + cells. The images were taken by fluorescence microscope. HLA-DR - CD33 + CD11b + cells were gated by a FACS gating strategy and were defined as MDSCs in this study. e , f Representative density plots showed the MDSC population in the peripheral blood of healthy donors (HD) or CC patients, as well as in the immune cells from tumour tissues (TIL) or tumour-adjacent tissues (NIL). A statistical graph is included for the comparison between the indicated groups. (G-H) Representative immunoblotting shows the expression of METTL3 in the peripheral blood, TILs and NILs. A statistical graph is included for the comparison between the indicated groups. The experiments in e , f were performed at least three times, and the data were plotted as the mean +- SEM. Statistics were conducted with an unpaired Student''s t test, * P < 0.05, and *** P < 0.001 vs. the corresponding control
- Submitted by
- Invitrogen Antibodies (provider)
- Main image
- Experimental details
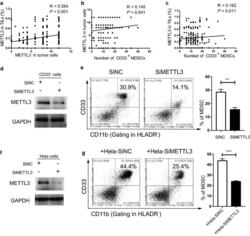
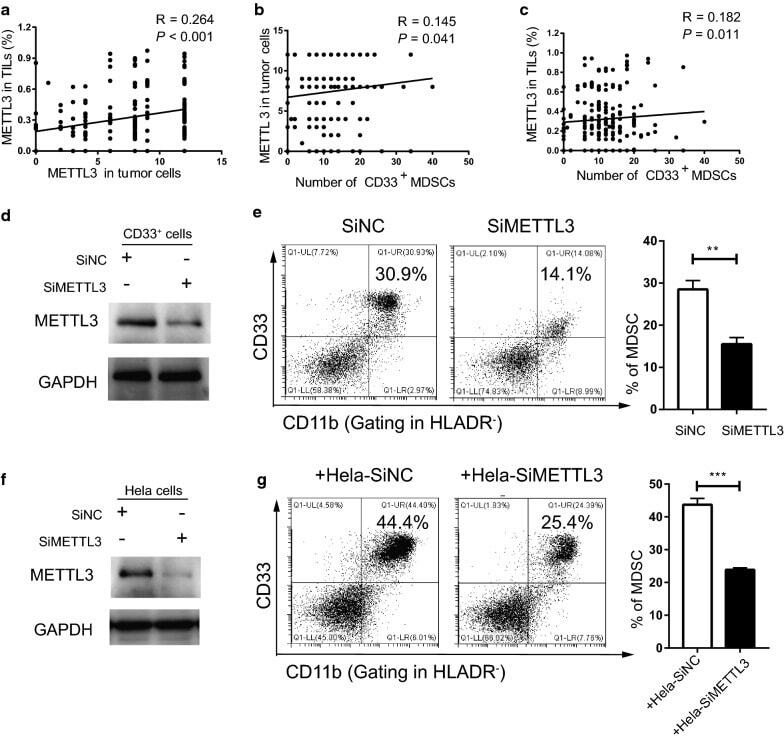
- Fig. 2 Tumour METTL3 level was positively related to intratumoural CD33 + MDSCs in vivo and CC-derived MDSCs in vitro. a The association between METTL3 expression in tumour cells and the expression of METTL3 in TILs (R = 0.264, P < 0.001). b The association between METTL3 expression in tumour cells and intratumoural CD33 + MDSC number (R = 0.145, P = 0.041). c The association between METTL3 expression in TILs and intratumoural CD33 + MDSC number (R = 0.182, P = 0.011). CD33 + cells were isolated from PBMCs of healthy donors with human anti-CD33 beads, and the METTL3 levels in CD33 + cells or HeLa cells were knocked down by siMETTL3. d Immunoblotting showed the METTL3 expression in CD33 + cells with or without METTL3 knockdown. e HLA-DR - CD33 + CD11b + MDSC induction from CD33 + cells in the presence of siMETTL3 or siControl (SiNC). A statistical graph is included for the comparison between the indicated groups. f Immunoblotting showed METTL3 expression in HeLa cells with or without METTL3 knockdown. g Tumour-associated HLA-DR - CD33 + CD11b + MDSC induction from CD33 + cells in coculture with Hela-siMETTL3 or Hela-siControl cells in a Transwell System for 48 h. A statistical graphs is included for the comparison between the indicated groups. Representative flow cytometry density plots (left) and statistical bar chart (right). The statistical analysis was performed using Spearman''s correlation and linear regression. R, Spearman''s correlation, is the correlation coefficient.
- Submitted by
- Invitrogen Antibodies (provider)
- Main image
- Experimental details
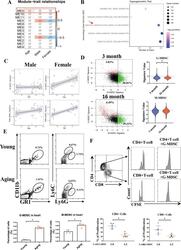
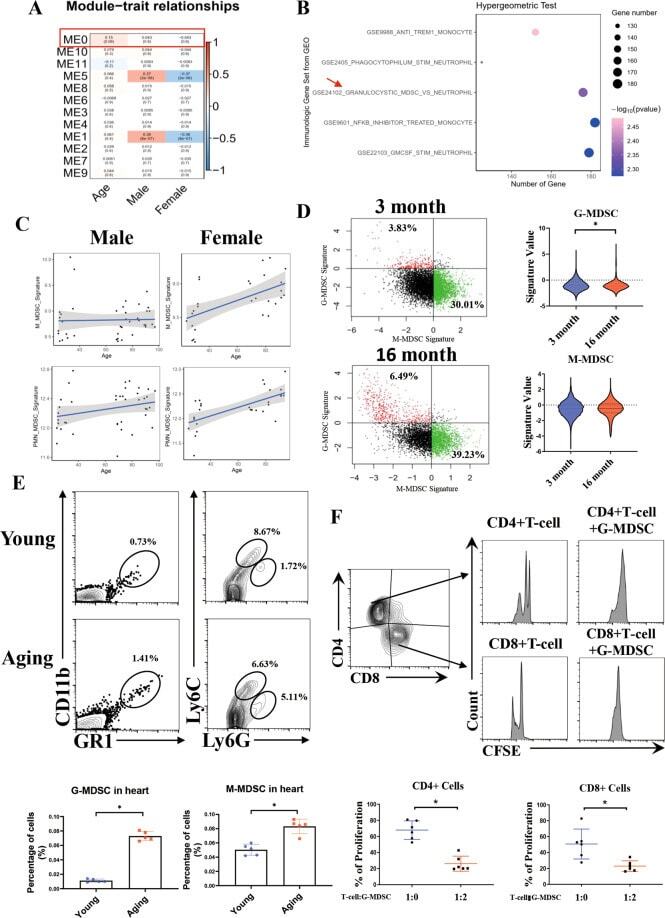
- Fig. 1 Levels of MDSCs in the heart are positively associated with age. A WGCNA of the coexpressed genes from 135 human whole blood transcriptomes from the GEO database (GSE123698). ME0 was related to age (correlation coefficient = 0.15) but not to sex (correlation coefficient = 0.043). Red indicates a positive correlation, and blue indicates a negative correlation. B Hypergeometric test of the genes in ME0 based on the immunologic gene set from GSE123698. The size of the dot represents the number of genes. A darker color indicates a lower correlation. C The bubble plots show the correlation between the G-MDSC/M-MDSC signature and age in males and females based on GSE123698. D The ratio (left) and signature value (right) of the G-MDSCs and M-MDSCs in 3-month-old and 16-month-old mice determined by scRNA-Seq analysis (GSE145477). E Representative flow cytometric profile showing the quantitative analysis of Cd11b + Gr1 + Ly6G+ cells and Cd11b + Gr1 + Ly6C+ cells in the hearts of young and aging mice; n = 5 per group. F CFSE-labeled CD4 + and CD8 + T cells and G-MDSCs separated from hearts were cocultured at a ratio of 2:1 for 24 h. Representative images and quantitative analysis of the proliferation of CD4 + or CD8 + T cells analyzed by flow cytometry; n = 6 per group. The data are presented as the means +- SDs. Differences were determined by Student's t test. * P < 0.05.
- Submitted by
- Invitrogen Antibodies (provider)
- Main image

- Experimental details
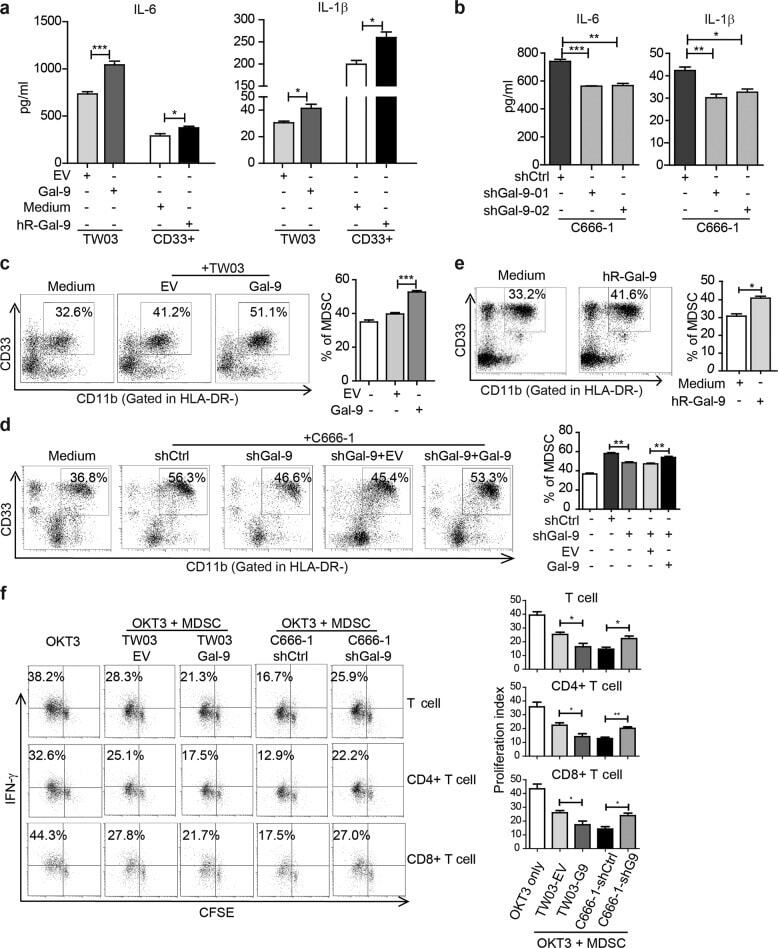
- Fig. 2 The effect of intra- and extra-cellular Gal-9 on MDSC differentiation and expansion in vitro. ELISA assay of IL-6 and IL-1beta concentrations in the conditioned media of TW03-EV and TW03-Gal-9 cells or CD33 + cells ( a ) or Gal-9 knockdown (shGal9-01 and shGal9-02) and control C666-1 cells ( b ) with or without addition of human recombinant Gal-9 (hR-Gal-9). c Differentiation of CD33 + cells isolated from healthy PBMCs investigated after treatment with control medium, co-cultivation with TW03-EV or TW03-Gal-9. Representative flow cytometry plots ( left ) and histogram ( right ) of MDSC differentiation assays showing the percentage of CD33 + CD11b + cells in the HLA-DR - gate arising from CD33 + cells. d Similar experiment based on co-cultivation with C666-1 cells using four experimental conditions: C666-1-shCtrl cells (shCtrl), unmodified C666-1-shGal9-01 (shGal-9), C666-1-shGal9-01 co-transfected with a control lentiviral vector (shGal9 + EV) or a Gal-9 lentiviral vector (ShGal-9+Gal-9). e Representative flow cytometry plots ( left ) and histogram ( right ) of MDSC differentiation assays showing the percentage of CD33 + CD11b + cells in the HLA-DR - gate arising from CD33 + cells with or without addition of human recombinant Gal-9 (hR-Gal-9). f Representative flow cytometry plots ( left ) and histogram ( right ) of the IFN-gamma-positive, proliferating T cells (CSFE assay) to test the immune-suppressive activity of MDSC cells induced by TW03-EV and TW03-Gal-9 or C666-
- Submitted by
- Invitrogen Antibodies (provider)
- Main image
- Experimental details
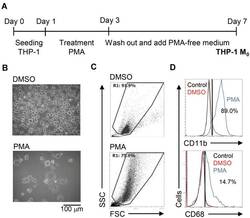
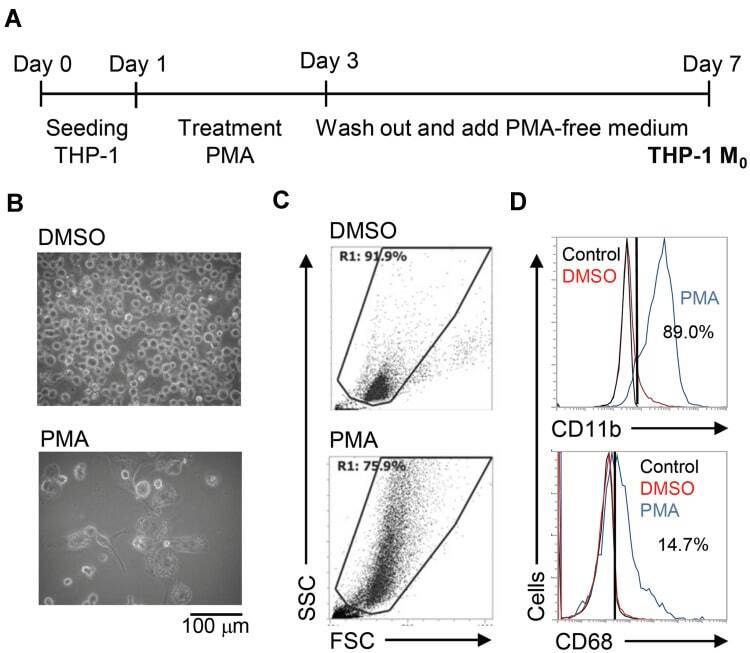
- Figure 1 Phorbol 12-myristate 13-acetate (PMA) treatment triggers macrophage differentiation in human monocytic THP-1 cells. ( A ) Experimental flowchart of the PMA stimulation performed in this study. ( B ) Cell morphology evaluation showed cell growth in PMA-treated THP-1 cells. ( C ) Flow cytometric dot-plot, plotting forward-scattered (FSC) versus side-scattered (SSC) from a population of THP-1 cells, showing the cell size and complexity. ( D ) Immunostaining followed by flow cytometric histogram analysis showed the expression of CD11b and CD68. Treatment of DMSO was used as control. For all images and flow cytometric analysis, representative staining data of isotype control, DMSO, and PMA were selectively obtained from three individual experiments. For the flow cytometric analysis, the percentage of positive cells in PMA treatment is shown.
- Submitted by
- Invitrogen Antibodies (provider)
- Main image
- Experimental details
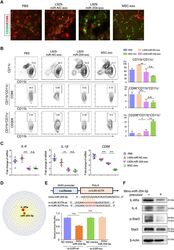
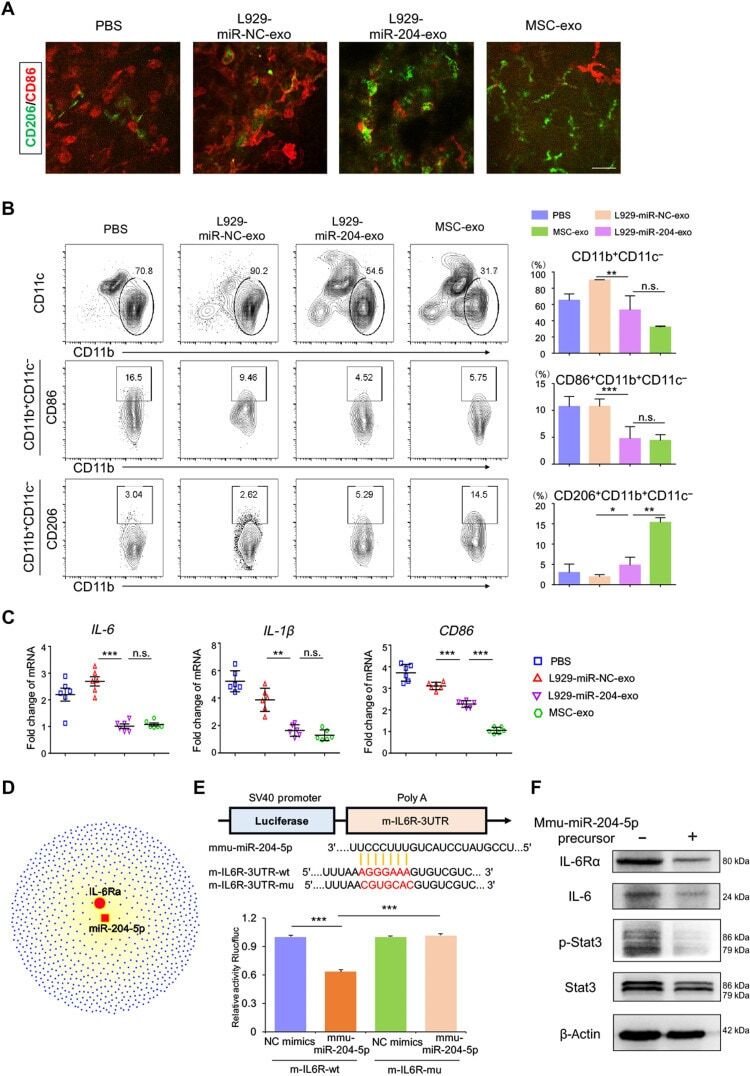
- Fig. 7. miR-204 was the candidate mediator of MSC-exo for macrophage reprogramming from M1 to M2 by targeting IL-6R signaling. ( A ) L929-miR-204-exo and MSC-exo treatments suppressed the CD86 + M1 macrophages and promoted CD206 + M2 ones in the BAC-induced corneal whole-mount staining. Scale bar, 50 mum. ( B ) Flow cytometry showed that, in the BAC-induced dry eye corneas, the percentage of CD11b + CD11c - macrophages decreased after L929-miR-204-exo or MSC-exo treatment compared with L929-miR-NC-exo controls, with more prominent reduction in the MSC-exo group. In addition, both treatments inhibited the percentage of CD11b + CD11c - CD86 + M1 macrophages to a similar extent. n = 12 eyes (four corneas mixed in one sample), one-way ANOVA and Tukey's post hoc test. ( C ) mRNA expressions of IL-6, IL-1beta, and CD86 were decreased after L929-miR-204-exo and MSC-exo treatments in comparison to the L929-miR-NC-exo group. n = 6 eyes, one-way ANOVA and Tukey's post hoc test. ( D ) Predicted regulatory networks of genes targeted by miR-204. ( E ) Luciferase reporter assay demonstrating direct interaction of miR-204-5p with 3'UTR of the Il-6r gene. One-way ANOVA and Tukey's post hoc test. n = 3. * P < 0.05, ** P < 0.01, and *** P < 0.001. ( F ) Western blot analysis showing the suppression of IL-6Ralpha, IL-6, and p-Stat3 by mmu-miR-204-5p precursor.
- Submitted by
- Invitrogen Antibodies (provider)
- Main image
- Experimental details
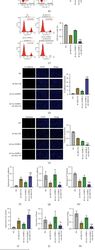
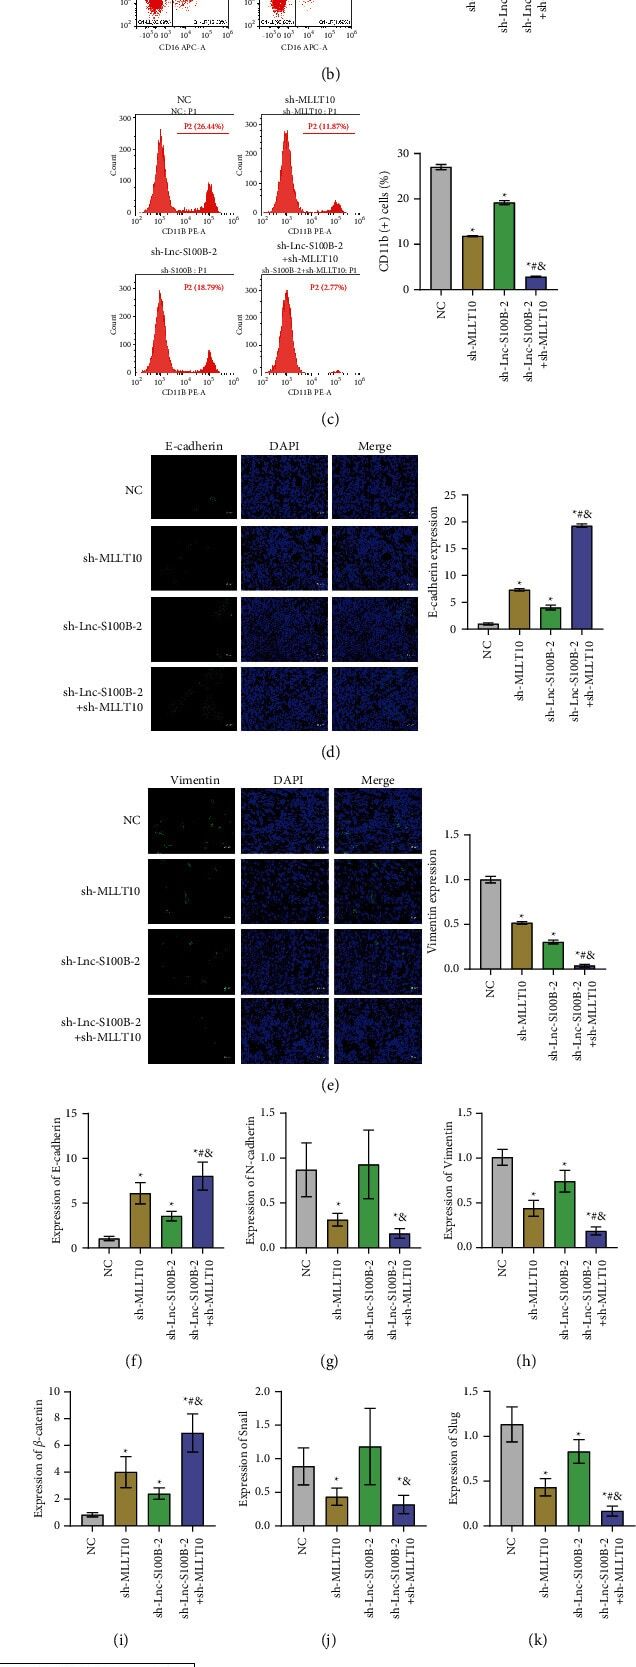
- Figure 6 Effects of Lnc-S100B-2 and MLLT10 on the tumor microenvironment. (a) The expressions of CD3 were detected by IF assay. (b) The percent of CD3 (-) CD16 (+) cells was detected by flow cytometry. (c) The percent of CD11b (+) cells was analyzed by flow cytometry. (d, e) The expression E-cadherin and vimentin was analyzed by IF assay. (f-l) The expressions of E-cadherin, N-cadherin, vimentin, beta -catenin, snail, and slug were detected by qRT-PCR and Western blot. * P < 0.05 versus NC group, # P < 0.05 versus sh-MLLT10 group, & P < 0.05 versus sh-Lnc-S100B-2 group, and one-way ANOVA.
- Submitted by
- Invitrogen Antibodies (provider)
- Main image
- Experimental details
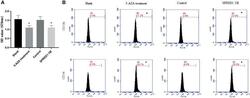
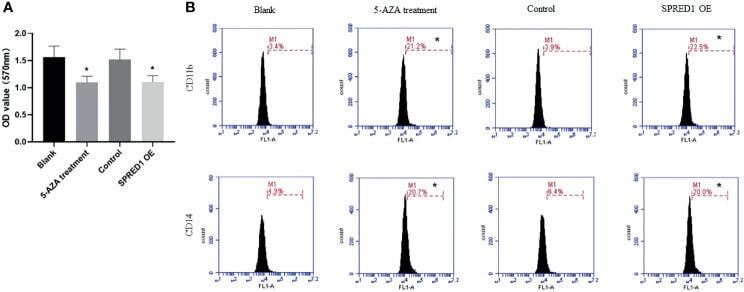
- Cell proliferation and differentiation of THP-1 after treatment with 5 muM of 5-AZA and lentivirus transfection. (A) The proliferative capacity of THP-1 after treatment with 5 muM of 5-AZA and lentivirus transfection by MTT assay (* p < 0.05). (B) CD11b and CD14 expressions of THP-1 after treatment with 5 muM of 5-AZA and lentivirus transfection by flow cytometry (* p < 0.05).
- Submitted by
- Invitrogen Antibodies (provider)
- Main image
- Experimental details
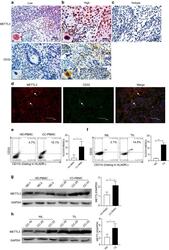
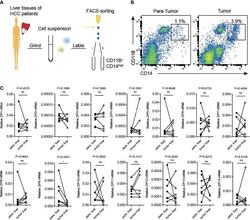
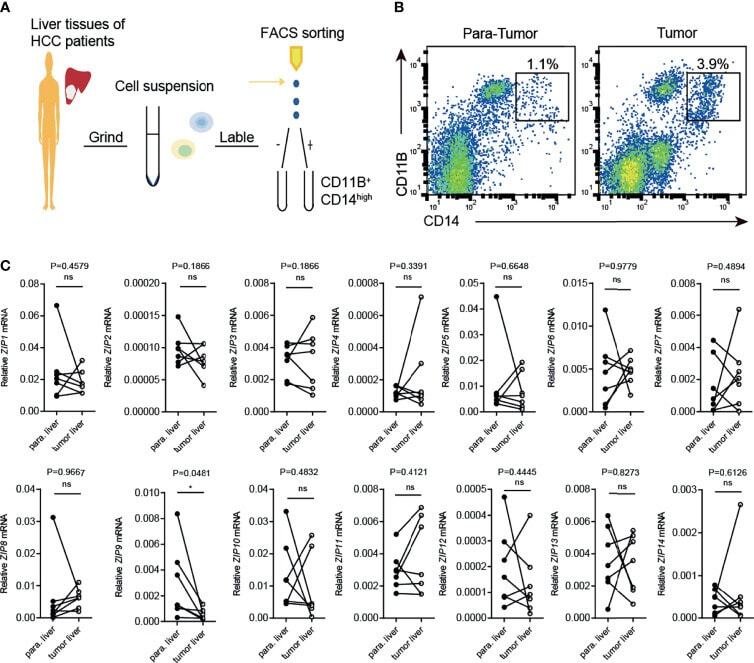
- Transcription of Zip9 is downregulated in HCC patients-derived TAMs. (A) FACS protocol was used for isolating HCC patients-derived TAMs. (B) Human liver cancer tissues and paracarcinoma liver tissues were digested, stained for CD14, CD11B and then analyzed by flow cytometry. (C) The mRNA levels of ZIPs in TAMs isolated from human liver cancer tissues and paracarcinoma liver tissues were detected by RT-PCR (n = 7). The black points represent the individual paracarcinoma liver tissue, and the black circles represent the liver cancer tissue. The expressed values were calculated by the 2 -DeltaCT method. *P < 0.05, ns, not significant. The representative data from at least three independent experiments are shown. Data were determined with 2-tailed unpaired Student's t test between 2 groups.
- Submitted by
- Invitrogen Antibodies (provider)
- Main image

- Experimental details
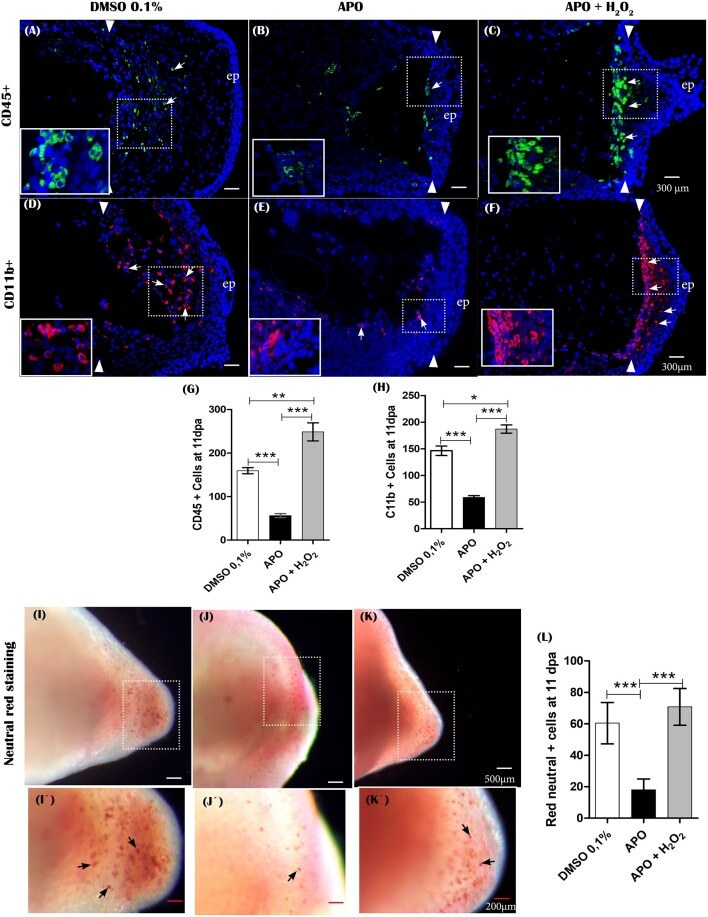
- FIGURE 9 The production of ROS generated post-amputation of the limb is necessary for the recruitment and phagocytic activity of inflammatory cells. (A-C) , Representative immunofluorescence images against the leukocyte pan marker CD45 at 11 dpa. Boxes in white dotted lines are shown at higher magnification in solid line boxes for each image. (A) CD45 + cells are predominantly located in the blastema region adjacent to the amputation plane. (B) A reduced number of CD45 + cells are observed near the amputation plane. (C) a notable increase of CD45 + cells are observed in the region of the blastema and the amputation plane. (D-F) , Representative immunofluorescence images against CD11b. A higher presence of CD11b + cells can be seen in the control group compared with the apocynin-treated group. Animals exposed to rescue treatment show a prominent accumulation of CD11b + cells in the blastema and amputation plane. (G,H) , quantification of CD45 and CD11b + positive cells, respectively. (I-K) , vital staining with neutral red at 11 dpa. Representative images of control animals in 0.1% DMSO, exposed to apocynin inhibitor (APO) and rescue assays. Boxes in dotted white lines are shown at higher magnification in (I',j',K') for each experimental group. (L) , quantification of cells positive for neutral red staining. Data are expressed as mean +- SEM. One-way ANOVA followed by Tukey's post hoc test was performed for comparisons between groups treated with apocynin, exogenous H 2 O 2 an
- Submitted by
- Invitrogen Antibodies (provider)
- Main image
- Experimental details
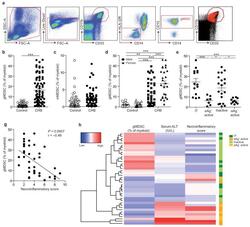
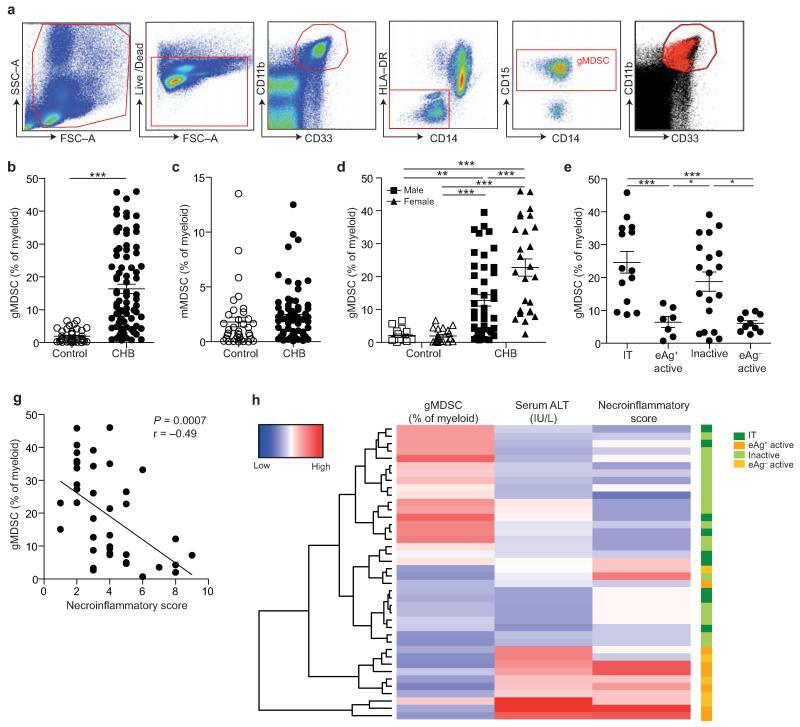
- Figure 1 gMDSC expand in subjects replicating HBV in the absence of immunopathology a ) Sequential gating strategy for gMDSC identification (CD11b high CD33 + HLA-DR - CD14 - CD15 + ) using 11-color flow cytometry from freshly isolated PBMC (doublet discrimination not shown). gMDSC population (superimposed in red) was calculated as a percentage of myeloid cells (CD11b high CD33 + ). Cumulative dot plots showing circulating b ) gMDSC and c ) mMDSC frequencies (n=44, healthy controls; n=84, CHB). d ) gMDSC frequencies analyzed by gender. e ) Summary plot of frequencies classified by disease phase using a subset of the cohort with clearly defined disease phases: 14 ""immunotolerants"" (HBeAg + , HBV DNA >10 7 IU/ml, ALT 5x10 5 IU/ml, ALT >60 IU/L), 21 ""inactive disease"" (HBeAg - , HBV DNA 60 IU/L). f ) gMDSC frequencies according to hepatic necroinflammatory score (n=42, CHB). g ) Unsupervised hierarchical clustering using Euclidean distance; dendrogram displaying similarity between clusters. Clinically assigned disease phase, shown adjacent to plot; immunotolerant: dark green, eAg + active disease: dark yellow, inactive disease: pale green, eAg - active disease: pale yellow (not used for analysis). Increasing color intensity (blue-red) corresponds to increasing gMDSC frequency, ALT (IU/L) or necroinflammatory score (n=42, CHB; maximum
- Submitted by
- Invitrogen Antibodies (provider)
- Main image
- Experimental details
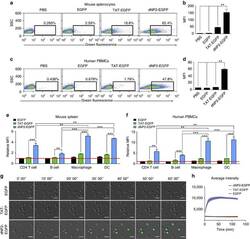
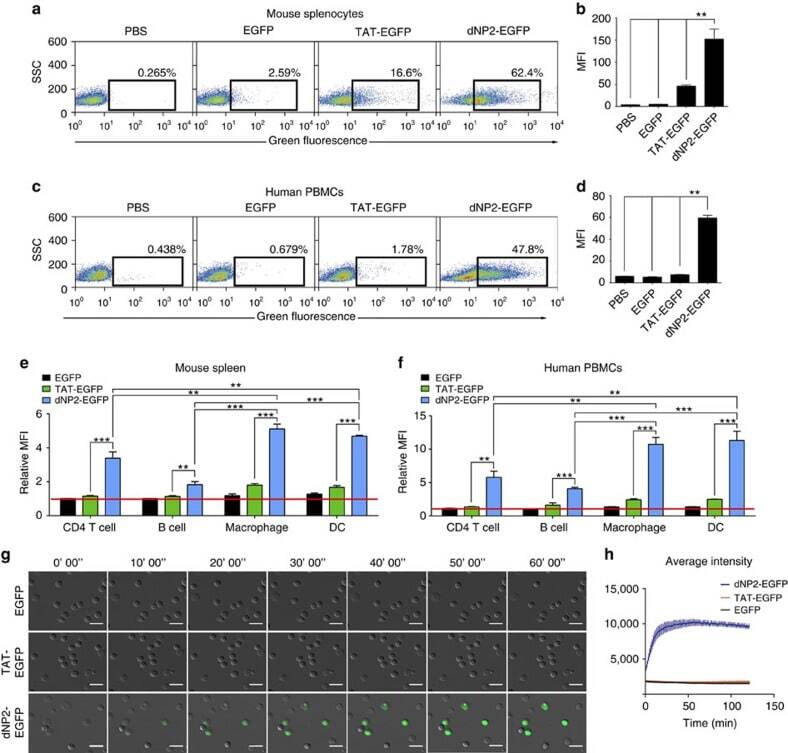
- Figure 2 Protein delivery efficiency of dNP2 in primary mouse and human immune cells. ( a , b ) Mouse primary splenocytes were isolated from 6-week-old female C57BL/6 mice and the cells were incubated with 5 muM EGFP, TAT- and dNP2-EGFP for 2 h. Intracellular fluorescence was analysed by flow cytometry and the data are represented as dot plots or mean fluorescence intensity (MFI) of the cells. ( c , d ) Human PBMCs were isolated from healthy donor blood and the cells were incubated with 5 muM EGFP, TAT-, dNP2-EGFP for 2 h. The data were analysed as described above. ( e ) Total splenocytes were incubated with 1 muM EGFP, TAT-, and dNP2-EGFP for 2 h. Cells were gated using markers specific for CD4 T cells (CD4 + ), B cells (CD19 + ), macrophages (CD11c lo CD11b hi F480 + ) and DCs (CD11c hi MHCII hi ). The EGFP signal in each cell population was then analysed by flow cytometric analysis. The relative MFI value was normalization to PBS treated cells. The red line indicates relative MFI of PBS-treated cells. ( f ) Total PBMCs were incubated with 1 muM EGFP, TAT-, and dNP2-EGFP for 2 h. Cells were gated with markers specific for CD4 T cells (CD4 + ), B cells (CD19 + ), macrophages (CD11b + ) and DCs (CD11c + ) and the data were then analysed as described above. ( g ) Time-lapse images of mouse CD4 T cells incubated with 1 muM EGFP, TAT- and dNP2-EGFP were acquired for 2 h (Scale bar, 15 mum) and ( h ) the average fluorescence intensities of 10 cells from each sample were calculate
- Submitted by
- Invitrogen Antibodies (provider)
- Main image
- Experimental details
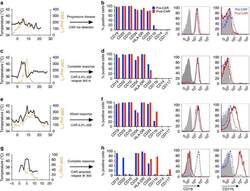
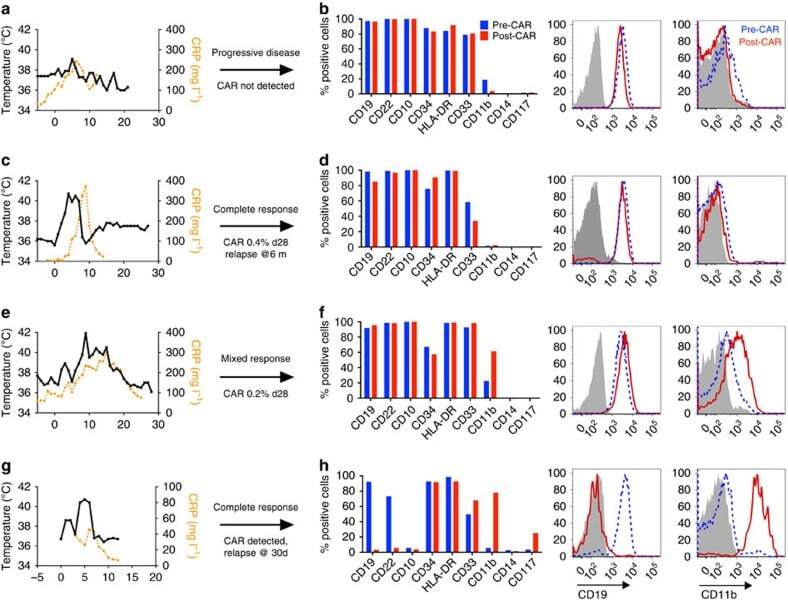
- Figure 1 Phenotypic alterations in clinical ALL samples following CD19 CAR. ( a , c , e , g ) Fever curves, CRP values and clinical response to CD19 CAR treatment. ( b , d , f , h ) Bar graph demonstrating percent of cells expressing cell surface markers by flow cytometry in the bone marrow, gated on leukaemic blasts, with representative flow cytometry histograms of CD19 and CD11b on the right (grey, control; blue, pre-CAR; red, post CAR). ( a , b ) Pre-CAR sample and day +30 post-CAR sample from a patient who did not experience CRS following CD19 CAR. ( c , d ) Pre-CAR and +180 days post-CAR samples from a patient with normal karyotype multiple relapsed ALL, who had a severe CRS followed by an MRD-negative complete response with CD19 CAR, with no CAR + cells persisting beyond 60 days. ( e , f ) Pre-CAR and day +30 post-CAR samples from a patient with normal karyotype ALL who experienced a mild CRS and CAR expansion, but had persistent disease. ( g , h ) Pre-CAR and post-CAR samples from an infant with MLL-rearranged ALL, treated with CD19-41BB-zeta CAR, who relapsed with myeloid blasts.
- Submitted by
- Invitrogen Antibodies (provider)
- Main image
- Experimental details
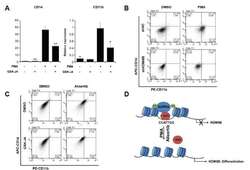
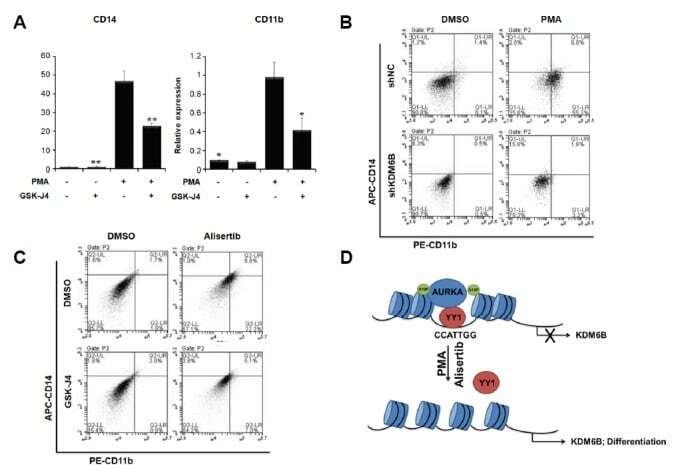
- Fig. 5 KDM6B promotes the differentiation of THP-1 cells (A) THP-1 cells were treated with 100 ng/ml PMA, 2 muM GSK-J4, or DMSO for 48 h. CD14 and CD11b expression levels were confirmed using qRT-PCR and normalized to GAPDH . Results are shown as mean +- SEM, n = 3; *p < 0.05, **p < 0.01. (B) We treated negative control (shNC)- and shKDM6B-transfected THP-1 cells with 100 ng/ml PMA for 48 h. The cells were stained with PE-CD11b and APC-CD14 antibodies. The percentage of cells in each quadrant is indicated in the figure. (C) We treated THP-1 cells with 2 muM GSK-J4 or 0.3 muM alisertib for 48 h. The cells were stained with PE-CD11b and APC-CD14 antibodies. The percentage of cells in each quadrant is indicated in the figure. (D) A model of AURKA regulating KDM6B expression in PMA-mediated THP-1 differentiation.
- Submitted by
- Invitrogen Antibodies (provider)
- Main image
- Experimental details
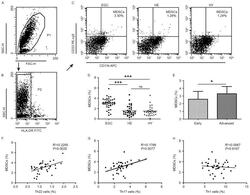
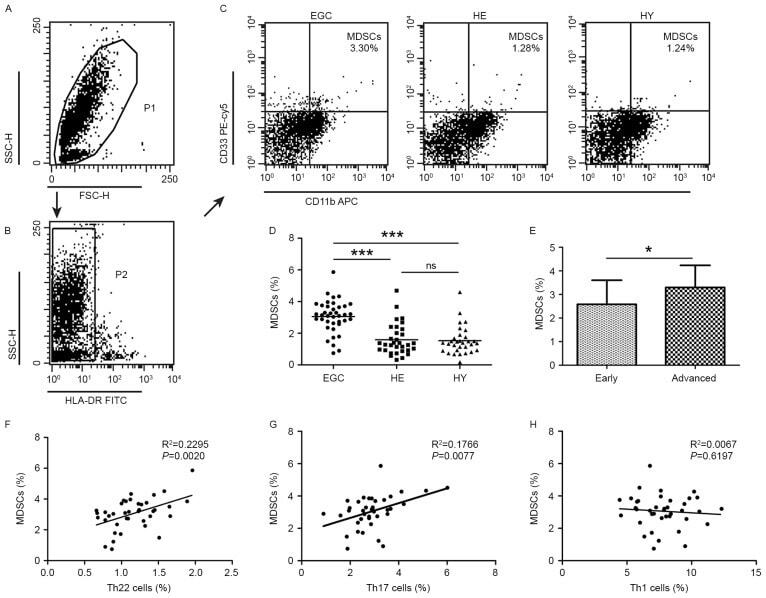
- Figure 2. Flow cytometric analysis of MDSCs in peripheral whole blood from EGC (n=39), HE (n=32) and HY (n=31). Gating routine in (A) P1 and (B) P2 successively for MDSCs (HLA-DR - CD33 + CD11b + ) subsets and (C) representative results of flow cytometric analyses for MDSCs in the three groups of subjects. The number of cells in EGC, HE and HY in P2 were 8,394, 8,004 and 8,224, respectively. (D) The proportion of MDSCs in the three groups of subjects. (E) The proportion of MDSCs in peripheral whole blood derived from patients with early (n=13) or advanced (n=26) gastric cancer. The association between the proportion of MDSCs and (F) Th22, (G) Th17 and (H) Th1 cells in peripheral whole blood of elderly patients with cancer. *P
- Submitted by
- Invitrogen Antibodies (provider)
- Main image
- Experimental details
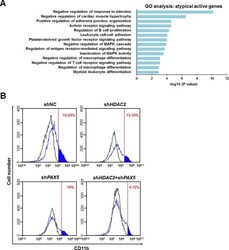
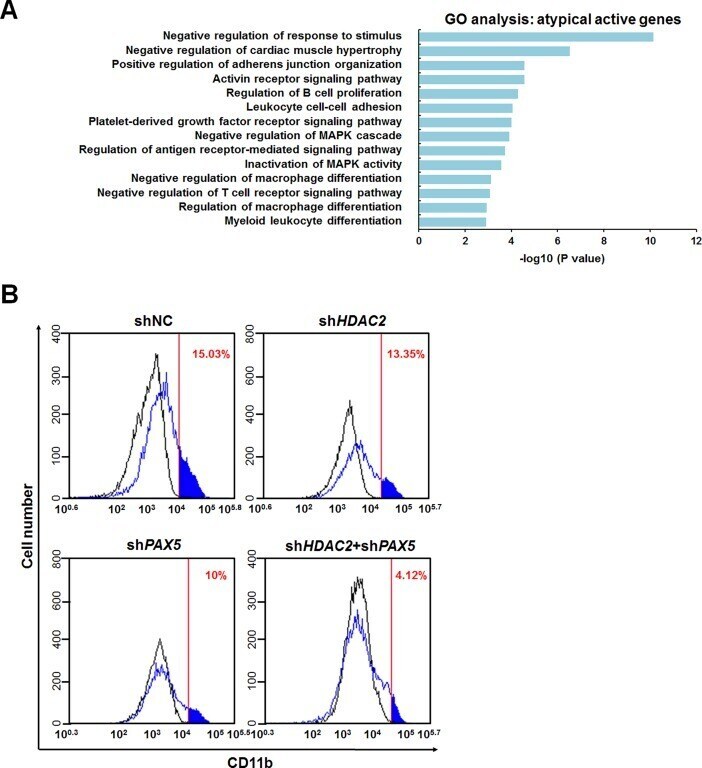
- Fig 5 Knockdown of HDAC2 in HL-60 cells caused differentiation inhibition when PAX5 was also depleted. (A) GO terms of atypically active genes regulated by HDAC2 were analyzed in gene ontology consortium. X-axis represents the adjusted P-value transformed by -log10, and Y-axis denotes the enriched GO terms. (B) HL-60 cell differentiation was measured in control and sh HDAC2 3''UTR and/or sh PAX5 3''UTR HL-60 cells by CD11b staining. Cells were stained with CD11b-PE for 1 hr, and analyzed by FACS.
- Submitted by
- Invitrogen Antibodies (provider)
- Main image
- Experimental details
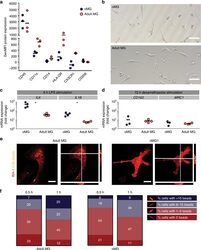
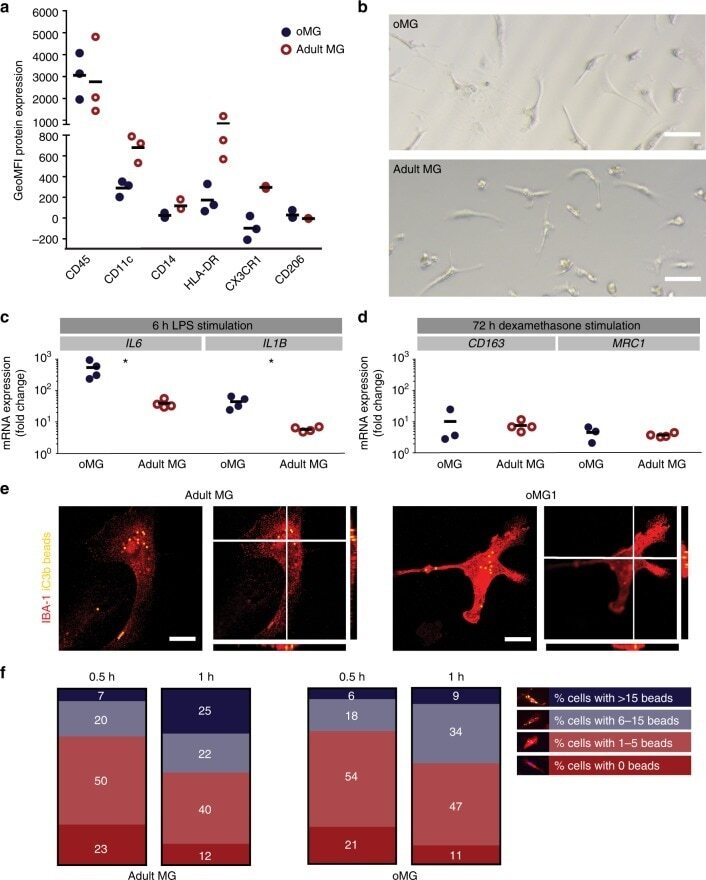
- Fig. 4 oMG expressed microglia-characteristic cell surface markers and showed similar functional immune and phagocytic properties as adult MG. a Flow cytometric analyses of the expression pattern of microglial extracellular markers on CD11b+-gated oMG (oMG 1, 3, and 5) compared to adult MG derived from three separate brain regions from adult MG1.1. (eight organoids were pooled per donor (oMG 1, 3, and 5) after 52 days in culture). b Morphology of magnetic automated cell sorted CD11b+ oMG 1 and adult MG in bright field microscope after 1 week in culture. Scale bar 40 mum. c mRNA expression, determined by qRT-PCR, of pro-inflammatory cytokines IL6 and IL1B after 6 h stimulation with LPS was significantly higher in oMG compared to adult MG (Mann-Whitney test IL6 and IL1B: U = 0, n = 4, p = 0.03). LPS-stimulated response relative to control condition without LPS. ( n = 4 experiments, eight organoids pooled per experiment; adult MG1.1) (* p < 0.05). d Anti-inflammatory response of oMG and adult MG was compared by qRT-PCR for expression of anti-inflammatory genes CD163 and MRC1 upon 72 h stimulation with dexamethasone. Dexamethasone-stimulated response relative to control condition without dexamethasone. (oMG, n = 3 separate experiments in which oMG were isolated from > 4 pooled cerebral organoids from iPSC 1 per experiment; adult MG, n = 4). e Phagocytosis capacity was tested oMG 1 and adult MG by performing a phagocytosis assay with iC3b-coated green-yellow
- Submitted by
- Invitrogen Antibodies (provider)
- Main image
- Experimental details
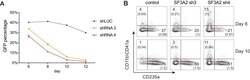
- Figure 6-figure supplement 1. Additional Analysis Showing SF3A2 is Required for Human Erythropoiesis. ( A ) shRNAs targeting SF3A2 co-expressing a reporter GFP gene was infected into human CD34 + cells and cultured in erythroid conditions. GFP expression at various time points from three independent experiments show that downregulation of SF3A2 results in reduced cell numbers. ( B ) Representative FACS plots of erythroid (CD235a) and non-erythroid cell surface markers (CD11b/CD41 a) and at various time points showing an increase in non-erythroid lineages upon SF3A2 downregulation. Cells were gated on the GFP positive population.

- Submitted by
- Invitrogen Antibodies (provider)
- Main image
- Experimental details
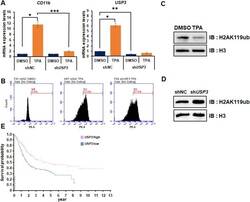
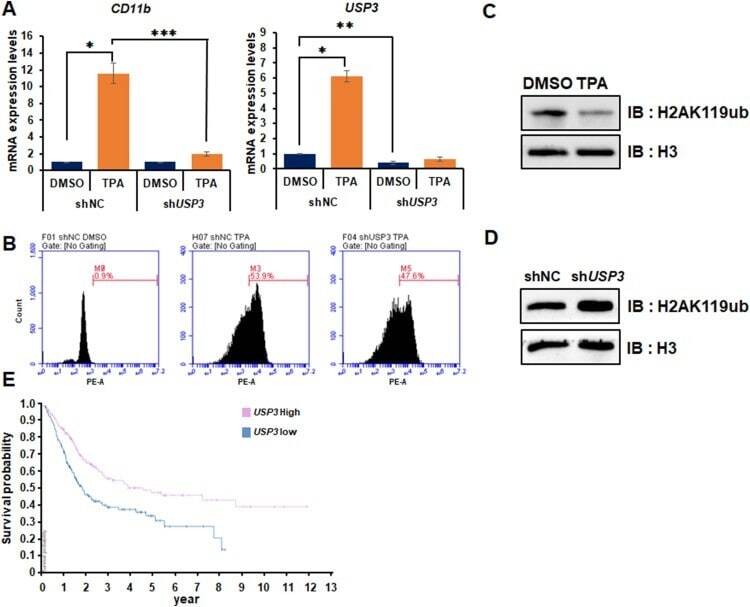
- Figure 4. Depletion of USP3 inhibited TPA-mediated HL-60 cell differentiation via regulating H2A119ub. (A) HL-60 cells are analyzed by RT-qPCR to examine the mRNA expression levels of CD11b and USP3 . Cells are treated with DMSO or TPA (32 nM) for 48 h. Results are represented as mean +- SEM; n = 3. * P < 0.05, ** P < 0.01, *** P < 0.001. (B) Differentiation of HL-60 cells (CD11b positive) are measured by FACS analysis performed in shNC DMSO, shNC TPA, and shUSP3 TPA. Cells are stained with CD11b-PE for 30 min and analyzed by FACS. (C,D) HL-60 cells are treated with DMSO or TPA for 48 h. Purified histones are resolved by SDS-PAGE and immunoblotted with anti-H3 or anti-H2AK119ub antibodies. (E) USP3 expression levels are showed in comparison with various types of leukemia via the Oncomine database. (F) The probability of survival in urothelial cancer patient is showed in comparison with the level of USP3 expression.
- Submitted by
- Invitrogen Antibodies (provider)
- Main image
- Experimental details
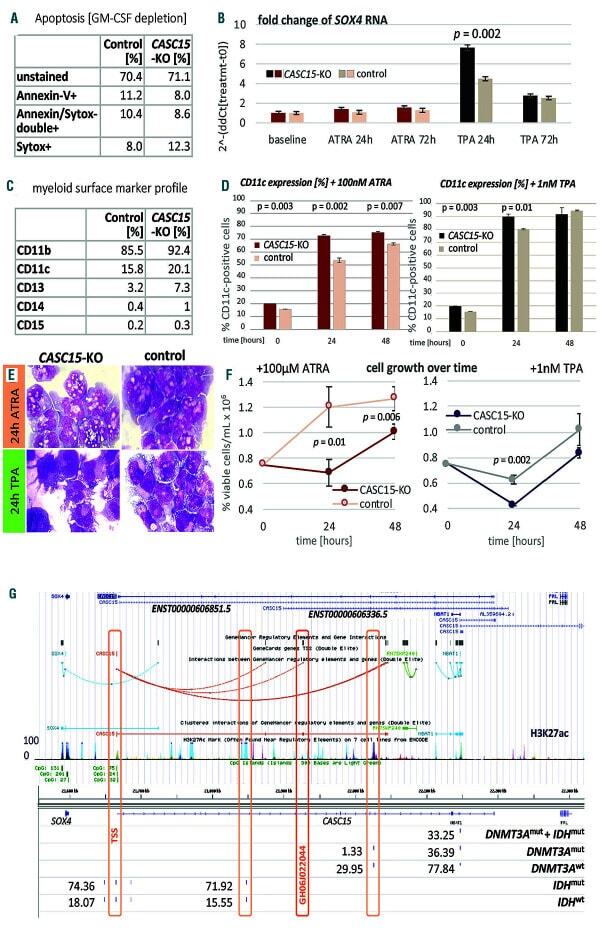
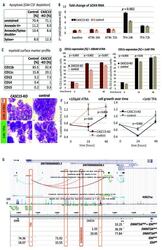
- Figure 1. CASC15 -KO promotes the differentiation of acute myeloid leukemia cells. (A) Apoptosis in CASC15 -KO and empty vector-transduced (control) OCI-AML5 cell lines after 24 h of depletion of granulocyte-macrophage colony-stimulating factor (annexin-FITC/Sytox blue flow cytometry). (B) Expression of SOX4 during in vitro differentiation of CASC15 -KO and control OCI-AML5 cell lines. All cells were treated with 0.1 mM all- trans retinoic acid (ATRA) and 1 nM 12-O-tetradecanoylphorbol-13-acetate (TPA) over 72 h in three independent experiments. Total RNA was extracted before, after 24 h and after 72 h of treatment, DNase-digested and transcribed to cDNA. A quantitative real-time polymerase chain reaction (qRT-PCR) was performed using SYBR green chemistry with subsequent melting curve analysis in technical triplicates. The 2-ddCt was calculated relative to the pre-determined housekeeping gene encoding succinate dehydrogenase complex subunit C ( SDHC ). (C) Baseline expression of the monocyte/macrophage markers CD11b (integrin subunit alpha M, ITGAM), CD11c (integrin subunit alpha X, ITGAX), and CD14, the granulocyte marker CD15 (fucosyltransferase 4, FUT4), and the general myeloid marker CD13 (aminopeptidase N, APN) in CASC15 -KO and control cells. The percentages of positive cells, quantified by flow cytometry after 72 h, are shown. (D-F) Growth rate and CD11c myeloid cell surface marker expression of CASC15 and control cell lines during drug-induced in vitro differentiation