Explore
 Validate
 Learn
LearnMA5-15810
antibody from Invitrogen Antibodies
Targeting: OLIG2
BHLHB1, bHLHe19, OLIGO2, PRKCBP2, RACK17
 Western blot
 ELISA
ELISA Immunocytochemistry
Antibody data
- Antibody Data
- Antigen structure
- References [3]
- Comments [0]
- Validations
- Immunocytochemistry [4]
- Immunohistochemistry [1]
- Other assay [2]
Submit
Validation data
Reference
Comment
Report error
- Product number
- MA5-15810 - Provider product page

- Provider
- Invitrogen Antibodies
- Product name
- OLIG2 Monoclonal Antibody (1G11)
- Antibody type
- Monoclonal
- Antigen
- Purifed from natural sources
- Description
- MA5-15810 targets OLIG2 in indirect ELISA, IF, IHC, and WB applications and shows reactivity with Human samples. The MA5-15810 immunogen is purified recombinant fragment of human OLIG2 expressed in E. Coli. MA5-15810 detects OLIG2 which has a predicted molecular weight of approximately 32kDa.
- Reactivity
- Human
- Host
- Mouse
- Isotype
- IgG
- Antibody clone number
- 1G11
- Vial size
- 100 μL
- Concentration
- Conc. not determined
- Storage
- Store at 4°C short term. For long term storage, store at -20°C, avoiding freeze/thaw cycles.
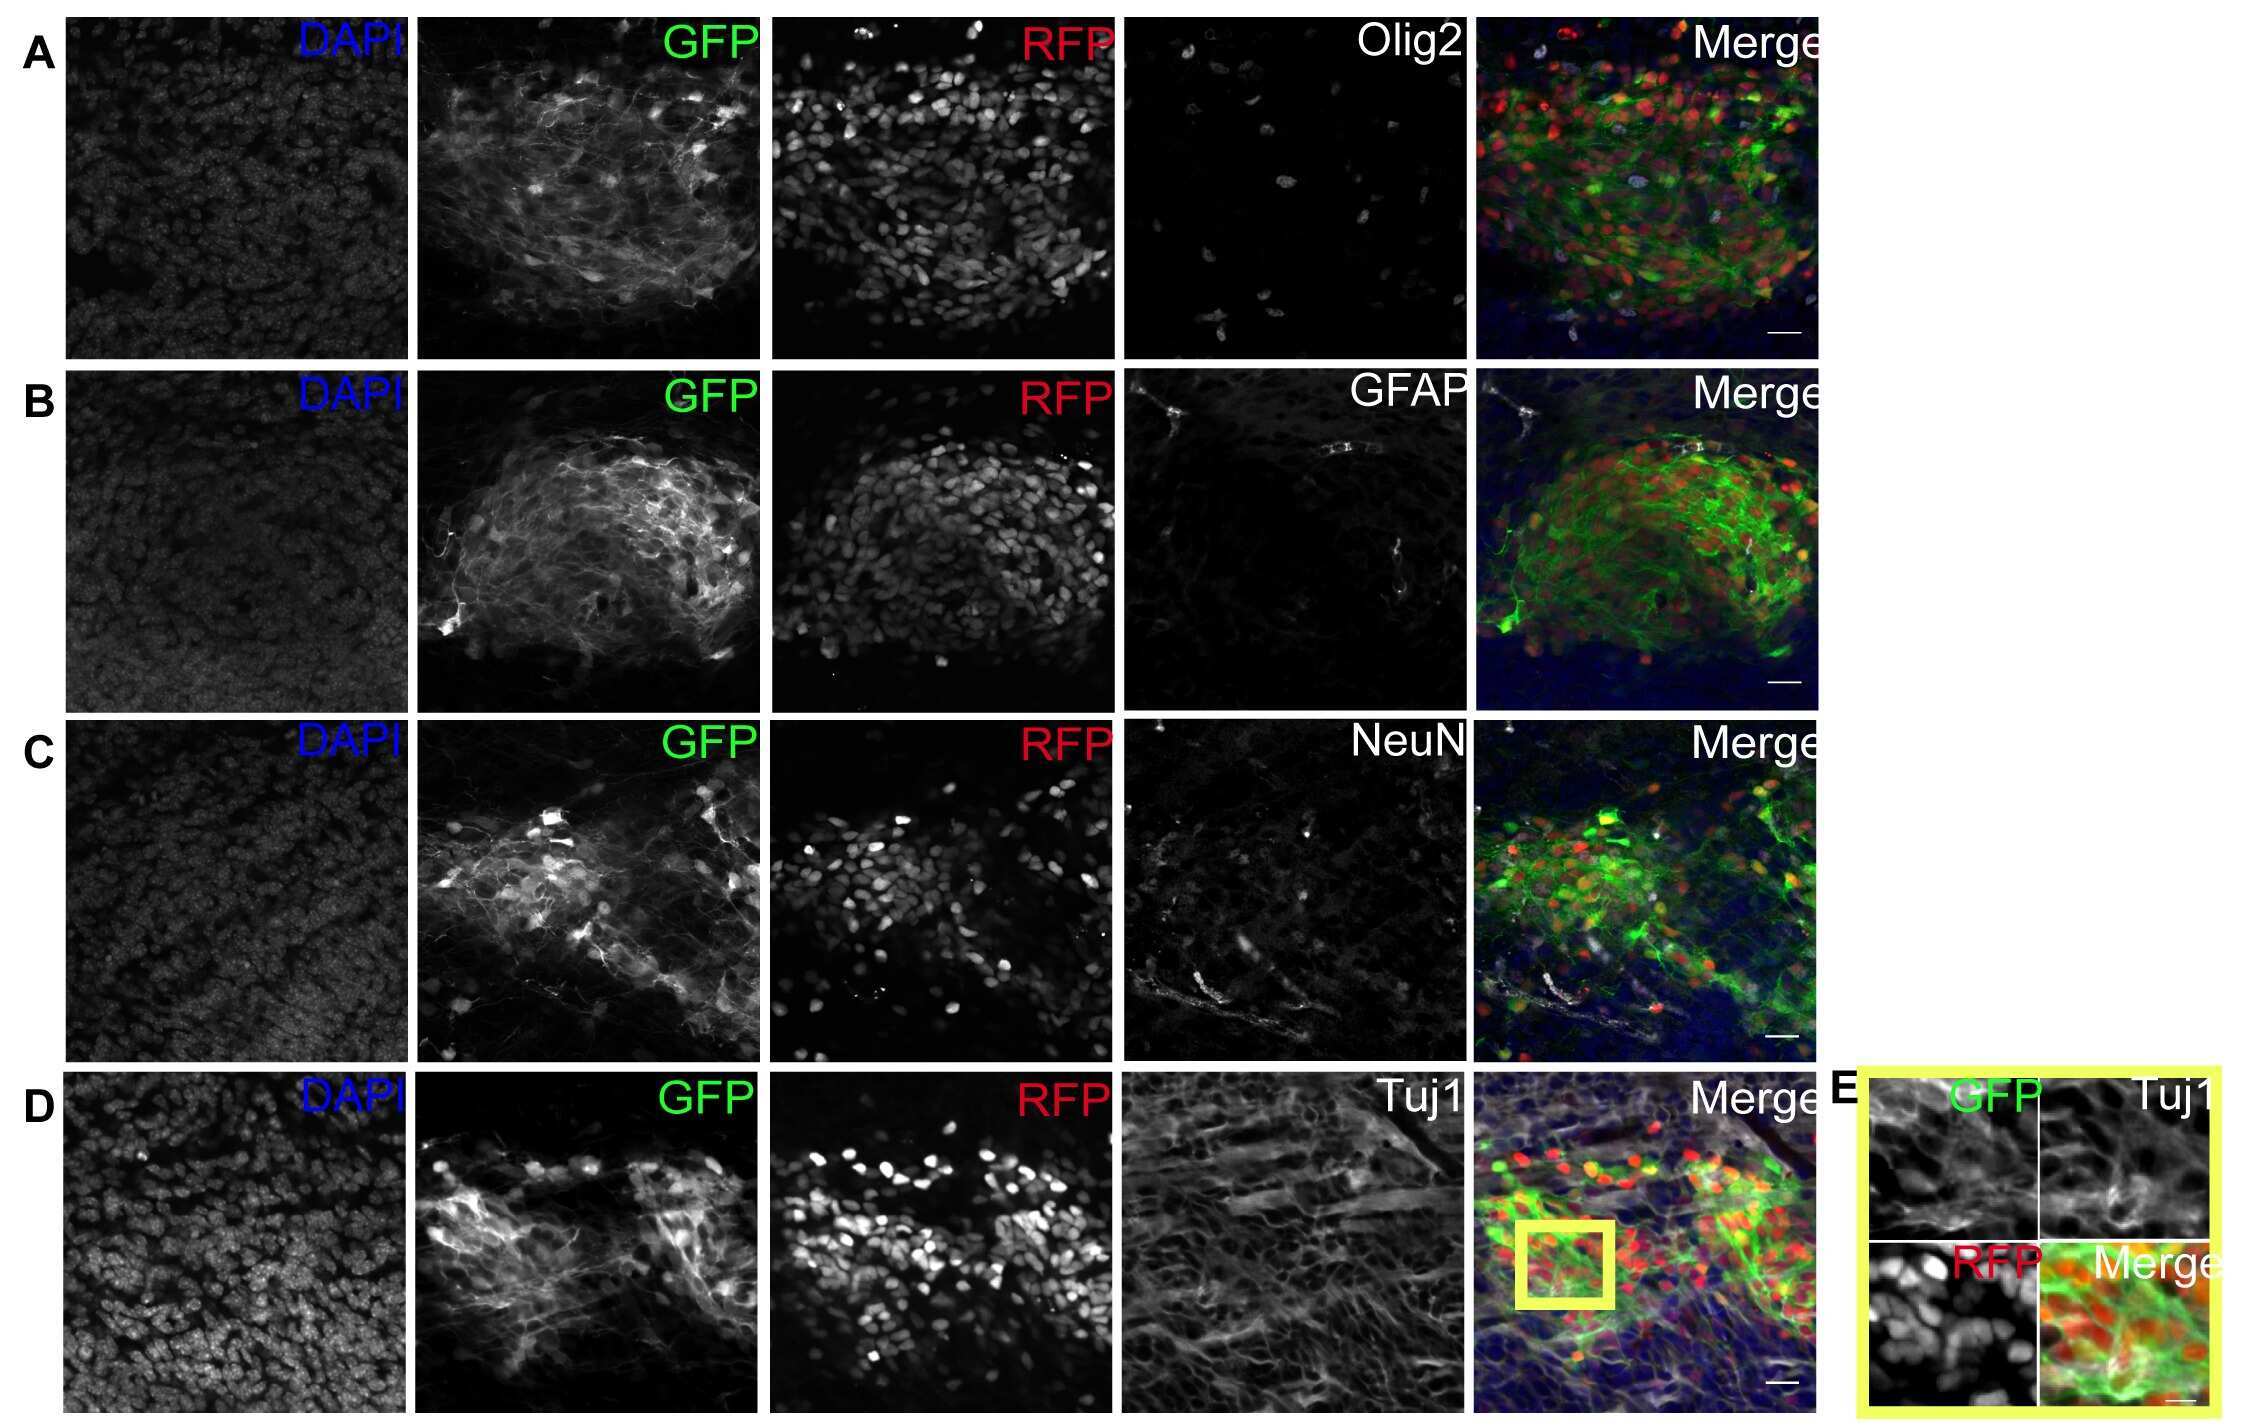
Submitted references Tissue Niche Miniature of Glioblastoma Patient Treated with Nano-Awakeners to Induce Suicide of Cancer Stem Cells.
In vitro human stem cell derived cultures to monitor calcium signaling in neuronal development and function.
Sustained Pax6 Expression Generates Primate-like Basal Radial Glia in Developing Mouse Neocortex.
Yoon SJ, Baek S, Yu SE, Jo E, Lee D, Shim JK, Choi RJ, Park J, Moon JH, Kim EH, Chang JH, Lee JB, Park JS, Sung HJ, Kang SG
Advanced healthcare materials 2022 Nov;11(21):e2201586
Advanced healthcare materials 2022 Nov;11(21):e2201586
In vitro human stem cell derived cultures to monitor calcium signaling in neuronal development and function.
Sharma Y, Saha S, Joseph A, Krishnan H, Raghu P
Wellcome open research 2020;5:16
Wellcome open research 2020;5:16
Sustained Pax6 Expression Generates Primate-like Basal Radial Glia in Developing Mouse Neocortex.
Wong FK, Fei JF, Mora-Bermúdez F, Taverna E, Haffner C, Fu J, Anastassiadis K, Stewart AF, Huttner WB
PLoS biology 2015 Aug;13(8):e1002217
PLoS biology 2015 Aug;13(8):e1002217
No comments: Submit comment
Supportive validation
- Submitted by
- Invitrogen Antibodies (provider)
- Main image

- Experimental details
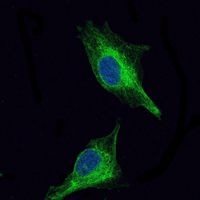
- Immunofluorescence analysis of U251 cells using OLIG2 monoclonal antibody (Product # MA5-15810) (Green). Blue: DRAQ5 fluorescent DNA dye.
- Submitted by
- Invitrogen Antibodies (provider)
- Main image

- Experimental details
- Immunofluorescence analysis of U251 cells using OLIG2 monoclonal antibody (Product # MA5-15810) (Green). Blue: DRAQ5 fluorescent DNA dye.

- Submitted by
- Invitrogen Antibodies (provider)
- Main image

- Experimental details
- Immunofluorescence analysis of U251 cells using OLIG2 monoclonal antibody (Product # MA5-15810) (Green). Blue: DRAQ5 fluorescent DNA dye.

- Submitted by
- Invitrogen Antibodies (provider)
- Main image

- Experimental details
- Immunofluorescence analysis of U251 cells using OLIG2 monoclonal antibody (Product # MA5-15810) (Green). Blue: DRAQ5 fluorescent DNA dye.

Supportive validation
- Submitted by
- Invitrogen Antibodies (provider)
- Main image

- Experimental details
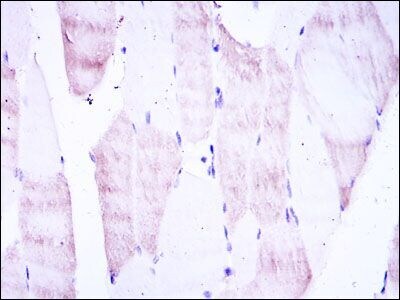
- Immunohistochemical analysis of paraffin-embedded muscle tissues using OLIG2 monoclonal antibody (Product # MA5-15810) followed with DAB staining.
Supportive validation
- Submitted by
- Invitrogen Antibodies (provider)
- Main image
- Experimental details
- NULL
- Submitted by
- Invitrogen Antibodies (provider)
- Main image
- Experimental details
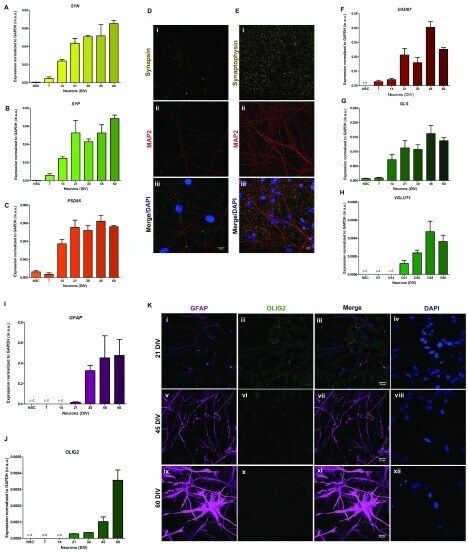
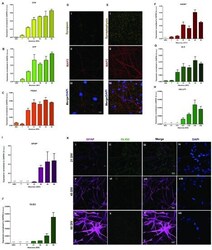
- Figure 5. Expression of synaptic and glial markers during in-vitro differentiation. ( A ) to ( C ) Relative mRNA expression levels of synaptic markers SYN , SYP and PSD95 at stages of neuronal differentiation obtained from quantitative real time PCR (qRT PCR). The expression levels have been normalized with GAPDH as endogenous control and the values represented in the terms of 2 -Ct- Y-axis, mean +- SEM. ( D ) Presence of presynaptic protein Synapsin 1 (yellow) and ( E ) synaptic vesicle protein Synaptophysin (yellow) in MAP2 (red) positive neuronal cells. The nuclei of the cells were observed by staining with DAPI (blue). ( F ) to ( H ) qRT PCR results of relative mRNA expression in GABAergic neuronal marker GAD67 , and glutamatergic neuronal markers GLS and VGLUT1 respectively. ( I ) and ( J ) Relative mRNA expression levels of astrocyte and oligodendrocyte markers GFAP and OLIG2 respectively at different stages of neuronal differentiation, as obtained from qRT PCR. The expression levels of all the genes have been normalized with GAPDH as endogenous control and the values represented in the terms of 2 -Ct , mean +- SEM. One-way ANOVA was used for statistical analysis, and p < 0.05 was considered significant. ( K ) Immunofluorescence images (maximum intensity projections) showing expression of GFAP (magenta) and OLIG2 (green) at stages of neuronal differentiation from neural stem cells. The cells were stained with astrocyte marker GFAP and oligodendrocyte marker OL