 Explore
 Validate
 Learn
Learn Western blot
Antibody data
- Antibody Data
- Antigen structure
- References [2]
- Comments [0]
- Validations
- Western blot [2]
- Immunocytochemistry [7]
- Flow cytometry [2]
- Other assay [3]
Submit
Validation data
Reference
Comment
Report error
- Product number
- MA5-32554 - Provider product page

- Provider
- Invitrogen Antibodies
- Product name
- MiTF Recombinant Rabbit Monoclonal Antibody (JF100-01)
- Antibody type
- Monoclonal
- Antigen
- Recombinant full-length protein
- Description
- Recombinant rabbit monoclonal antibodies are produced using in vitro expression systems. The expression systems are developed by cloning in the specific antibody DNA sequences from immunoreactive rabbits. Then, individual clones are screened to select the best candidates for production. The advantages of using recombinant rabbit monoclonal antibodies include: better specificity and sensitivity, lot-to-lot consistency, animal origin-free formulations, and broader immunoreactivity to diverse targets due to larger rabbit immune repertoire.
- Reactivity
- Human, Mouse, Rat
- Host
- Rabbit
- Isotype
- IgG
- Antibody clone number
- JF100-01
- Vial size
- 100 μL
- Concentration
- 1 mg/mL
- Storage
- Store at 4°C short term. For long term storage, store at -20°C, avoiding freeze/thaw cycles.
Submitted references Aberrant Retinal Pigment Epithelial Cells Derived from Induced Pluripotent Stem Cells of a Retinitis Pigmentosa Patient with the PRPF6 Mutation.
A prepared platelet-rich plasma extract, namely Self-Growth Colony, inhibits melanogenesis by down-regulating microphthalmia-associated transcription factor in skin melanocyte.
Liang Y, Tan F, Sun X, Cui Z, Gu J, Mao S, Chan HF, Tang S, Chen J
International journal of molecular sciences 2022 Aug 12;23(16)
International journal of molecular sciences 2022 Aug 12;23(16)
A prepared platelet-rich plasma extract, namely Self-Growth Colony, inhibits melanogenesis by down-regulating microphthalmia-associated transcription factor in skin melanocyte.
Guo MS, Wu Q, Lai QWS, Wang X, Bai P, Fung KWC, Dong TT, Tsim KWK
Journal of cosmetic dermatology 2021 Oct;20(10):3278-3288
Journal of cosmetic dermatology 2021 Oct;20(10):3278-3288
No comments: Submit comment
Supportive validation
- Submitted by
- Invitrogen Antibodies (provider)
- Main image
- Experimental details
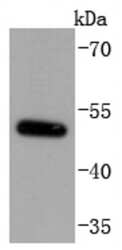
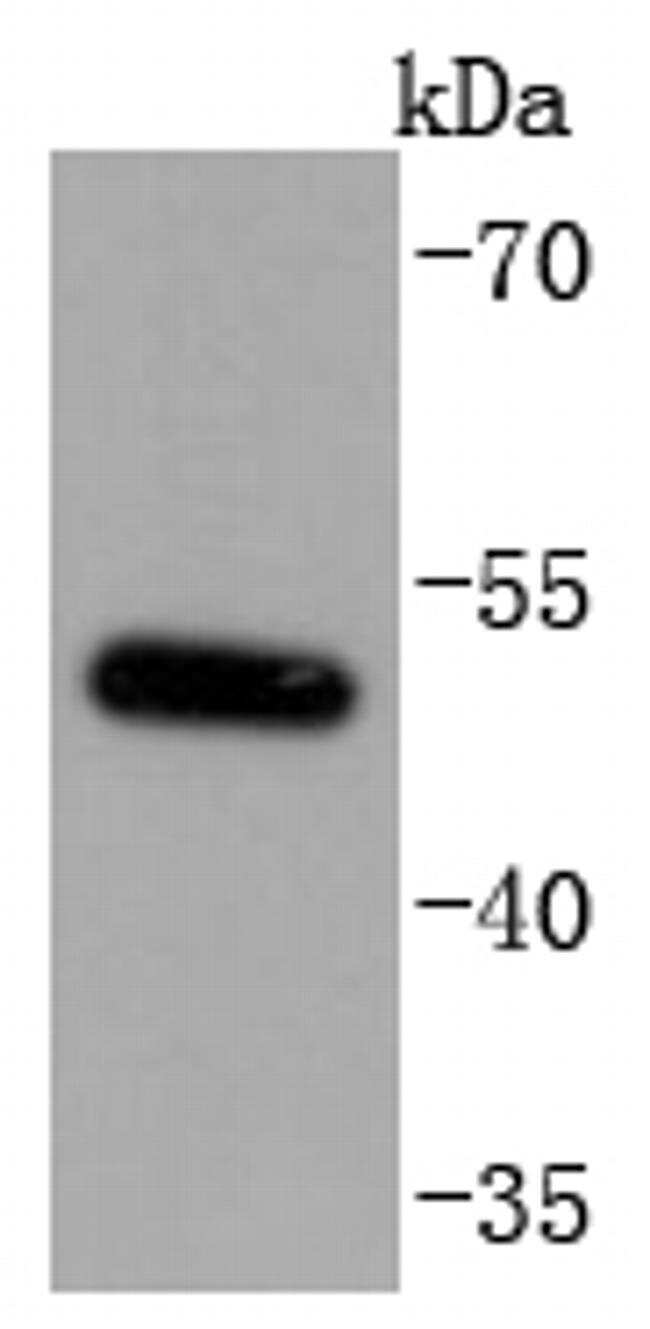
- Western blot analysis of MiTF in PC-12 cell lysate using a MiTF Monoclonal antibody (Product # MA5-32554) at a dilution of 1:1,000.
- Submitted by
- Invitrogen Antibodies (provider)
- Main image
- Experimental details
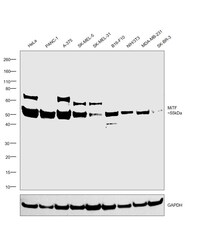
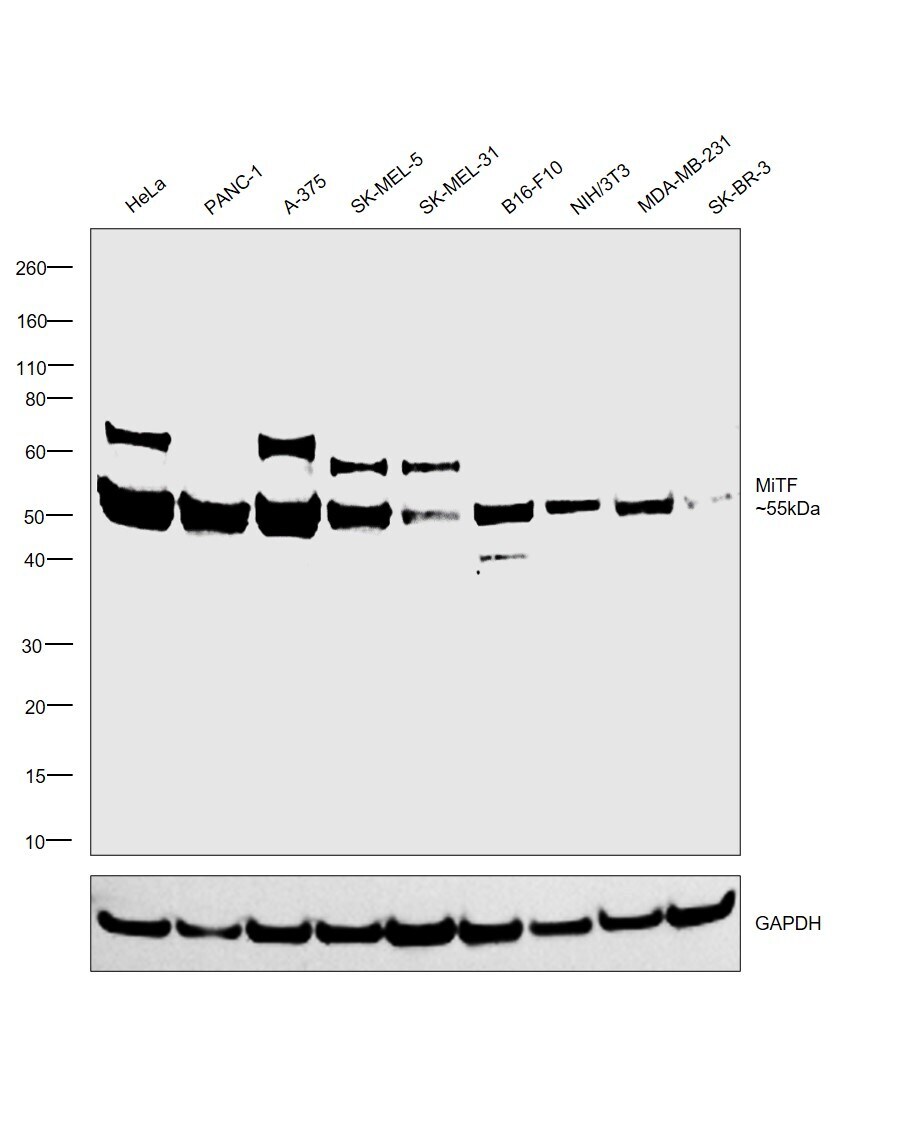
- Western blot was performed using Anti-MiTF Recombinant Rabbit Monoclonal Antibody (JF100-01) (Product # MA5-32554) and a 55kDa band corresponding to MiTF was observed across all cell lines tested. Nuclear enriched extracts (30 µg lysate) of HeLa (Lane 1), PANC-1 (Lane 2), A-375 (Lane 3), SK-MEL-5 (Lane 4), SK-MEL-31 (Lane 5), B16-F10 (Lane 6), NIH/3T3 (Lane 7), MDA-MB-231 (Lane 8) and SK-BR-3 (Lane 9) were electrophoresed using NuPAGE™ 4-12% Bis-Tris Protein Gel (Product # NP0321BOX). Resolved proteins were then transferred onto a Nitrocellulose membrane (Product # IB23001) by iBlot® 2 Dry Blotting System (Product # IB21001). The blot was probed with the primary antibody (1:1000 dilution) and detected by chemiluminescence with Goat anti-Rabbit IgG (Heavy Chain) Superclonal™ Recombinant Secondary Antibody, HRP (Product # A27036, 1:4000 dilution) using the iBright FL 1000 (Product # A32752). Chemiluminescent detection was performed using Novex® ECL Chemiluminescent Substrate Reagent Kit (Product # WP20005).
Supportive validation
- Submitted by
- Invitrogen Antibodies (provider)
- Main image

- Experimental details
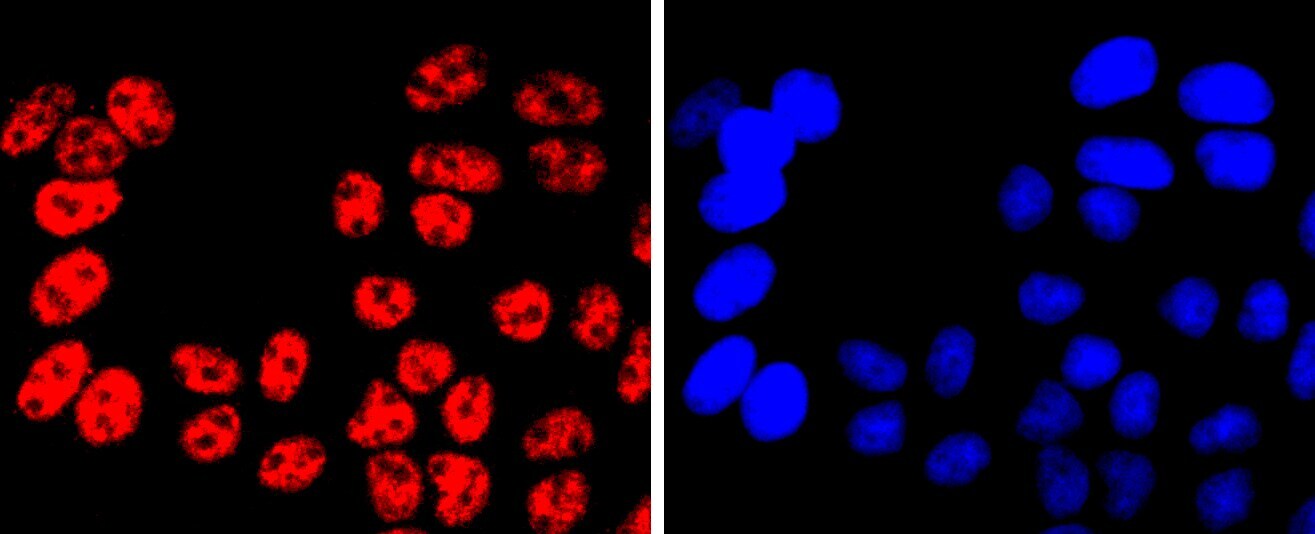
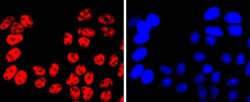
- Immunocytochemical analysis of MiTF in Hela cells using a MiTF Monoclonal antibody (Product # MA5-32554) as seen in red. The nuclear counter stain is DAPI (blue). Cells were fixed in paraformaldehyde, permeabilised with 0.25% Triton X100/PBS.
- Submitted by
- Invitrogen Antibodies (provider)
- Main image

- Experimental details
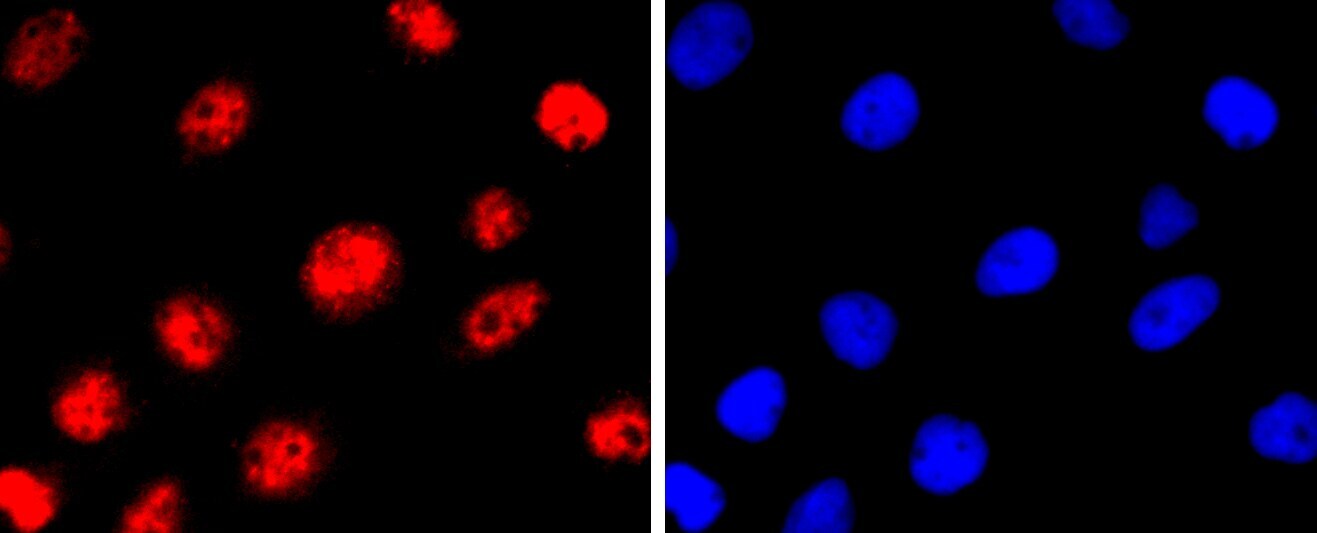
- Immunocytochemical analysis of MiTF in A431 cells using a MiTF Monoclonal antibody (Product # MA5-32554) as seen in red. The nuclear counter stain is DAPI (blue). Cells were fixed in paraformaldehyde, permeabilised with 0.25% Triton X100/PBS.
- Submitted by
- Invitrogen Antibodies (provider)
- Main image
- Experimental details
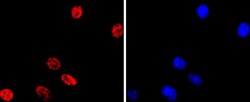
- Immunocytochemical analysis of MiTF in NIH/3T3 cells using a MiTF Monoclonal antibody (Product # MA5-32554) as seen in red. The nuclear counter stain is DAPI (blue). Cells were fixed in paraformaldehyde, permeabilised with 0.25% Triton X100/PBS.

- Submitted by
- Invitrogen Antibodies (provider)
- Main image
- Experimental details
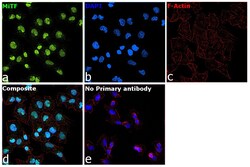
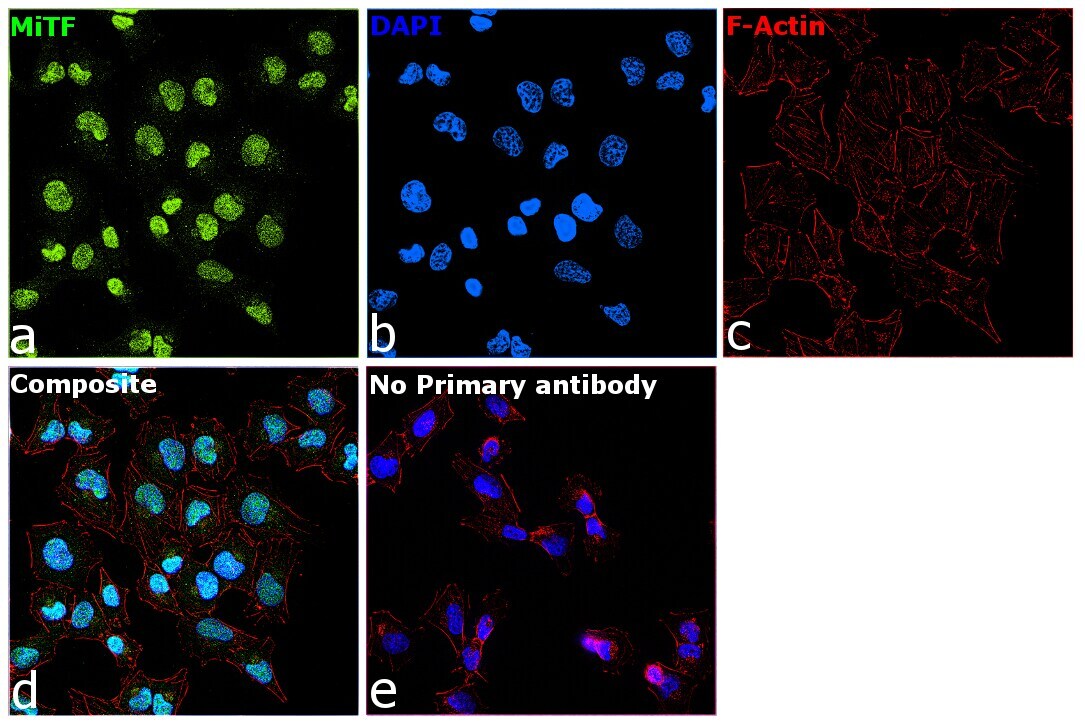
- Immunofluorescence analysis of MiTF was performed using 70% confluent log phase A-375 cells. The cells were fixed with 4% paraformaldehyde for 10 minutes, permeabilized with 0.1% Triton™ X-100 for 15 minutes, and blocked with 2% BSA for 45 minutes at room temperature. The cells were labeled with MiTF Recombinant Rabbit Monoclonal Antibody (JF100-01) (Product # MA5-32554) at 1:100 dilution in 0.1% BSA, incubated at 4 degree celsius overnight and then labeled with Donkey anti-Rabbit IgG (H+L) Highly Cross-Adsorbed Secondary Antibody, Alexa Fluor Plus 488 (Product # A32790), (1:2000 dilution), for 45 minutes at room temperature (Panel a: Green). Nuclei (Panel b:Blue) were stained with ProLong™ Diamond Antifade Mountant with DAPI (Product # P36962). F-actin (Panel c: Red) was stained with Rhodamine Phalloidin (Product # R415, 1:300). Panel d represents the merged image showing predominantly nuclear localization. Panel e represents control cells with no primary antibody to assess background. The images were captured at 60x magnification.
- Submitted by
- Invitrogen Antibodies (provider)
- Main image

- Experimental details
- Immunofluorescence analysis of MiTF was performed using 70% confluent log phase A-375 cells. The cells were fixed with 4% paraformaldehyde for 10 minutes, permeabilized with 0.1% Triton™ X-100 for 15 minutes, and blocked with 2% BSA for 45 minutes at room temperature. The cells were labeled with MiTF Recombinant Rabbit Monoclonal Antibody (JF100-01) (Product # MA5-32554) at 1:100 dilution in 0.1% BSA, incubated at 4 degree celsius overnight and then labeled with Donkey anti-Rabbit IgG (H+L) Highly Cross-Adsorbed Secondary Antibody, Alexa Fluor Plus 488 (Product # A32790), (1:2000 dilution), for 45 minutes at room temperature (Panel a: Green). Nuclei (Panel b:Blue) were stained with ProLong™ Diamond Antifade Mountant with DAPI (Product # P36962). F-actin (Panel c: Red) was stained with Rhodamine Phalloidin (Product # R415, 1:300). Panel d represents the merged image showing predominantly nuclear localization. Panel e represents control cells with no primary antibody to assess background. The images were captured at 60x magnification.

- Submitted by
- Invitrogen Antibodies (provider)
- Main image

- Experimental details
- Immunocytochemical analysis of MiTF in A431 cells using a MiTF Monoclonal antibody (Product # MA5-32554) as seen in red. The nuclear counter stain is DAPI (blue). Cells were fixed in paraformaldehyde, permeabilised with 0.25% Triton X100/PBS.

- Submitted by
- Invitrogen Antibodies (provider)
- Main image
- Experimental details
- Immunocytochemical analysis of MiTF in Hela cells using a MiTF Monoclonal antibody (Product # MA5-32554) as seen in red. The nuclear counter stain is DAPI (blue). Cells were fixed in paraformaldehyde, permeabilised with 0.25% Triton X100/PBS.

Supportive validation
- Submitted by
- Invitrogen Antibodies (provider)
- Main image
- Experimental details
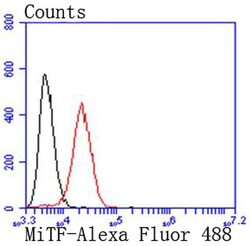
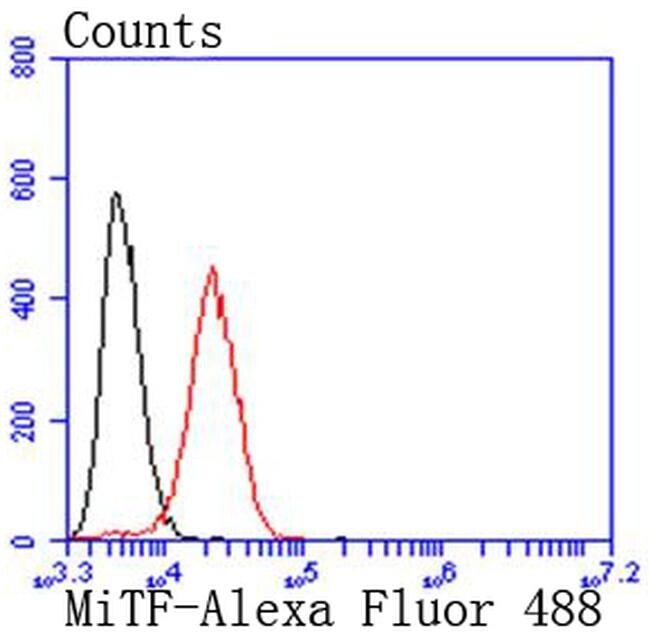
- Flow Cytometric analysis of MiTF in SW480 cells using a MiTF Monoclonal Antibody (Product # MA5-32554) at a dilution of 1:50, as seen in red compared with an unlabelled control (cells without incubation with primary antibody; black). Alexa Fluor 488-conjugated goat anti rabbit IgG was used as the secondary antibody.
- Submitted by
- Invitrogen Antibodies (provider)
- Main image

- Experimental details
- Flow Cytometric analysis of MiTF in SW480 cells using a MiTF Monoclonal Antibody (Product # MA5-32554) at a dilution of 1:50, as seen in red compared with an unlabelled control (cells without incubation with primary antibody; black). Alexa Fluor 488-conjugated goat anti rabbit IgG was used as the secondary antibody.

Supportive validation
- Submitted by
- Invitrogen Antibodies (provider)
- Main image

- Experimental details
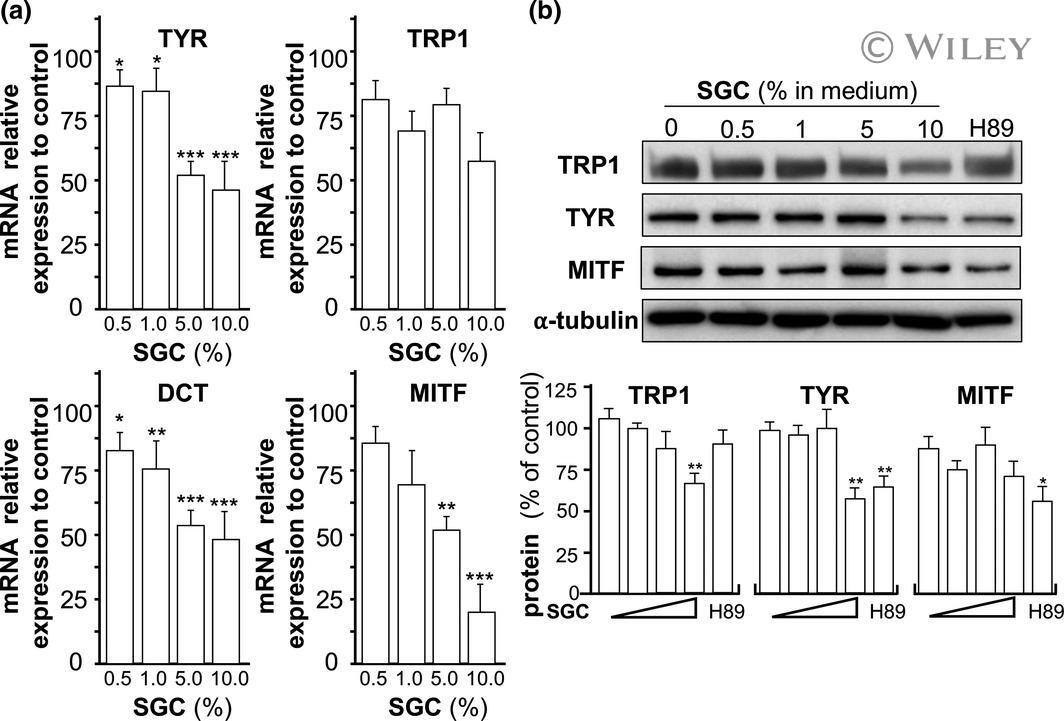
- 2 FIGURE SGC suppresses expressions of melanogenic enzymes and MITF. Melan-A cells were seeded onto 6-well plates in a density of 1.5 x 10 5 cells/ml. Cells were treated with SGC in different concentration (v/v) for 24 h. (A) Real-time PCR was performed on extracted RNA to measure the transcripts encoding TYR, TRP1, DCT, MITF, and GAPDH. (B) Western blotting was performed on isolated protein extracts to quantify expression of TRP1 (~61 kDa), TYR (~128 kDa), MITF (~59 kDa), and alpha-tubulin (~55 kDa). SGC (v/v) was at 0.5, 1, 5, and 10%, as indicated. H89 (10 muM) served as a positive control. Blotted band intensity was quantified with ImageJ software and compared. Values are expressed as relative mRNA expression level to the control (no treatment), or the protein expression percentage of the control (no treatment) in compensation to GAPDH or a-tubulin, in Mean +- SD, where n = 5, each in triplicate. Statistical significance was analyzed by one-way ANOVA, * p < 0.05; ** p < 0.01; *** p < 0.001 vs the control.
- Submitted by
- Invitrogen Antibodies (provider)
- Main image

- Experimental details
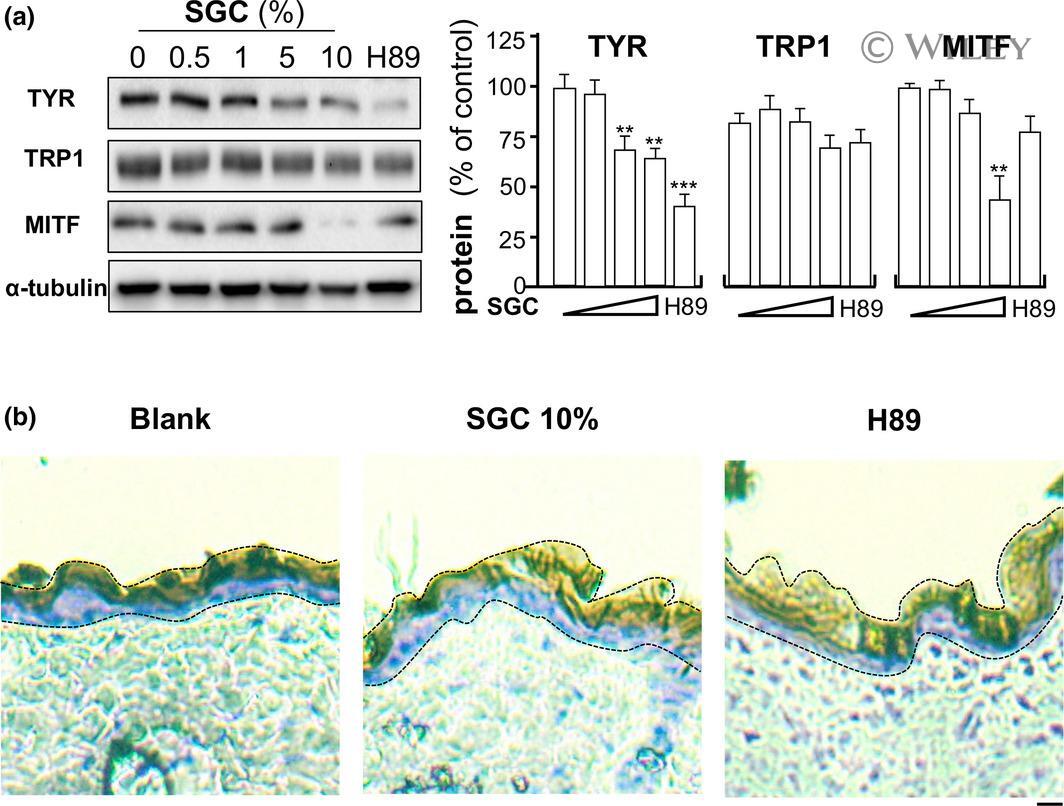
- 5 FIGURE SGC prevents UV-induced expression of melanogenic enzymes and MITF in ex vivo mouse dermal culture. Dorsal skin in 0.5 cm x 0.5 cm was excised from mice and cultured in DMEM medium supplemented with 10% FBS and 1% P/S. SGC extract in different concentration, as indicated, was applied to the cultures. H89 (10 muM) served as a positive control. (A) Total protein of each culture was extracted, and Western blotting was performed to quantify expression of melanogenic enzymes, that is, TYR, TRP1, and MITF. Band intensity was quantified with ImageJ software. Values were expressed as the percentage of the control (no treatment) in compensation to alpha-tubulin, in Mean +- SD, where n = 3, each in triplicate. Statistical significance was analyzed by one-way ANOVA, * p < 0.05; ** p < 0.01; *** p < 0.001 vs the control. (B) Fontana-Masson stain was done on fixed (4% PFA) frozen sections. Sections were counter-stained with H&E staining. Melanin (black) and nucleic acid (purple) were shown. Epidermis was marked with dotted lines. Representative section was shown, n = 3. Scale bar: 10 mum.
- Submitted by
- Invitrogen Antibodies (provider)
- Main image
- Experimental details
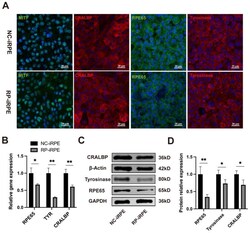
- Characterization of RPE-specific gene and protein expression. ( A ) Immunofluorescence staining of MITF, CRALBP, RPE65 and tyrosinase in the NC-iRPE and RP-iRPE groups. Scale bar 20 mum. ( B ) Quantitative real-time polymerase chain reaction (PCR) results of mRNA expression for RPE65 , TYR and CRALBP . ( C , D ) Western blotting analysis of RPE65, tyrosinase and CRALBP expression in both groups. GAPDH and beta-Actin were set as the loading control, respectively. Mean +- SD (* p < 0.05; ** p < 0.01; n = 3~6).
