Explore
 Validate
 Learn
Learn Western blot
 Immunocytochemistry
Antibody data
- Antibody Data
- Antigen structure
- References [4]
- Comments [0]
- Validations
- Immunocytochemistry [2]
- Immunohistochemistry [2]
- Flow cytometry [1]
- Other assay [2]
Submit
Validation data
Reference
Comment
Report error
- Product number
- 42-1400 - Provider product page

- Provider
- Invitrogen Antibodies
- Product name
- alpha Actinin 4 Polyclonal Antibody
- Antibody type
- Polyclonal
- Antigen
- Synthetic peptide
- Reactivity
- Human, Mouse, Rat
- Host
- Rabbit
- Isotype
- IgG
- Vial size
- 100 μg
- Concentration
- 0.25 mg/mL
- Storage
- -20°C
Submitted references Increased tissue stiffness triggers contractile dysfunction and telomere shortening in dystrophic cardiomyocytes.
N-sulfation of heparan sulfate is critical for syndecan-4-mediated podocyte cell-matrix interactions.
Podocytes require the engagement of cell surface heparan sulfate proteoglycans for adhesion to extracellular matrices.
Interaction of zonula occludens-1 (ZO-1) with alpha-actinin-4: application of functional proteomics for identification of PDZ domain-associated proteins.
Chang ACY, Pardon G, Chang ACH, Wu H, Ong SG, Eguchi A, Ancel S, Holbrook C, Ramunas J, Ribeiro AJS, LaGory EL, Wang H, Koleckar K, Giaccia A, Mack DL, Childers MK, Denning C, Day JW, Wu JC, Pruitt BL, Blau HM
Stem cell reports 2021 Sep 14;16(9):2169-2181
Stem cell reports 2021 Sep 14;16(9):2169-2181
N-sulfation of heparan sulfate is critical for syndecan-4-mediated podocyte cell-matrix interactions.
Sugar T, Wassenhove-McCarthy DJ, Orr AW, Green J, van Kuppevelt TH, McCarthy KJ
American journal of physiology. Renal physiology 2016 May 15;310(10):F1123-35
American journal of physiology. Renal physiology 2016 May 15;310(10):F1123-35
Podocytes require the engagement of cell surface heparan sulfate proteoglycans for adhesion to extracellular matrices.
Chen S, Wassenhove-McCarthy D, Yamaguchi Y, Holzman L, van Kuppevelt TH, Orr AW, Funk S, Woods A, McCarthy K
Kidney international 2010 Dec;78(11):1088-99
Kidney international 2010 Dec;78(11):1088-99
Interaction of zonula occludens-1 (ZO-1) with alpha-actinin-4: application of functional proteomics for identification of PDZ domain-associated proteins.
Chen VC, Li X, Perreault H, Nagy JI
Journal of proteome research 2006 Sep;5(9):2123-34
Journal of proteome research 2006 Sep;5(9):2123-34
No comments: Submit comment
Supportive validation
- Submitted by
- Invitrogen Antibodies (provider)
- Main image

- Experimental details
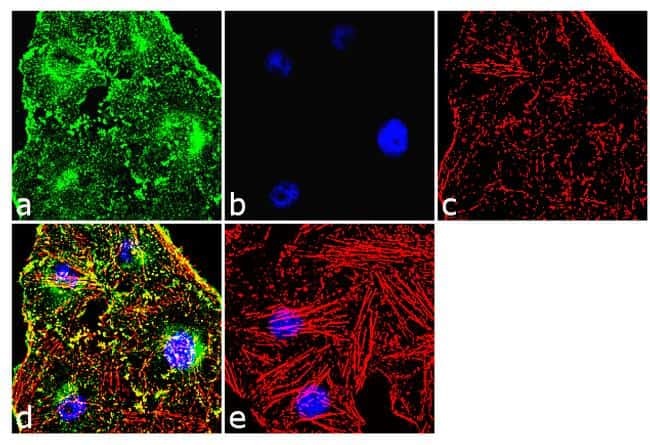
- Immunofluorescence analysis of alpha Actinin 4 was done on 70% confluent log phase HeLa cells. The cells were fixed with 4% paraformaldehyde for 10 minutes, permeabilized with 0.1% Triton™ X-100 for 10 minutes, and blocked with 1% BSA for 1 hour at room temperature. The cells were labeled with alpha Actinin 4 Rabbit Polyclonal Antibody (Product # 42-1400) at 2 µg/mL in 0.1% BSA and incubated for 3 hours at room temperature and then labeled with Goat anti-Rabbit IgG (H+L) Superclonal™ Secondary Antibody, Alexa Fluor® 488 conjugate (Product # A27034) at a dilution of 1:2000 for 45 minutes at room temperature (Panel a: green). Nuclei (Panel b: blue) were stained with SlowFade® Gold Antifade Mountant with DAPI (Product # S36938). F-actin (Panel c: red) was stained with Alexa Fluor® 555 Rhodamine Phalloidin (Product # R415, 1:300). Panel d is a merged image showing punctuated cytoplasmic localization. Panel e is a no primary antibody control. The images were captured at 60X magnification.
- Submitted by
- Invitrogen Antibodies (provider)
- Main image

- Experimental details
- Immunofluorescence analysis of alpha Actinin 4 was done on 70% confluent log phase HeLa cells. The cells were fixed with 4% paraformaldehyde for 10 minutes, permeabilized with 0.1% Triton™ X-100 for 10 minutes, and blocked with 1% BSA for 1 hour at room temperature. The cells were labeled with alpha Actinin 4 Rabbit Polyclonal Antibody (Product # 42-1400) at 2 µg/mL in 0.1% BSA and incubated for 3 hours at room temperature and then labeled with Goat anti-Rabbit IgG (Heavy Chain) Superclonal™ Secondary Antibody, Alexa Fluor® 488 conjugate (Product # A27034) at a dilution of 1:2000 for 45 minutes at room temperature (Panel a: green). Nuclei (Panel b: blue) were stained with SlowFade® Gold Antifade Mountant with DAPI (Product # S36938). F-actin (Panel c: red) was stained with Alexa Fluor® 555 Rhodamine Phalloidin (Product # R415, 1:300). Panel d is a merged image showing punctuated cytoplasmic localization. Panel e is a no primary antibody control. The images were captured at 60X magnification.

Supportive validation
- Submitted by
- Invitrogen Antibodies (provider)
- Main image
- Experimental details
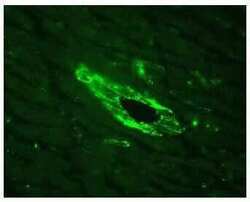
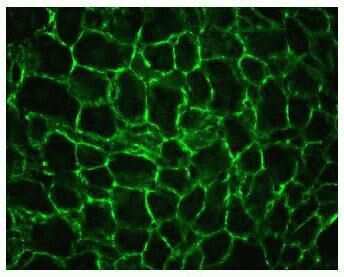
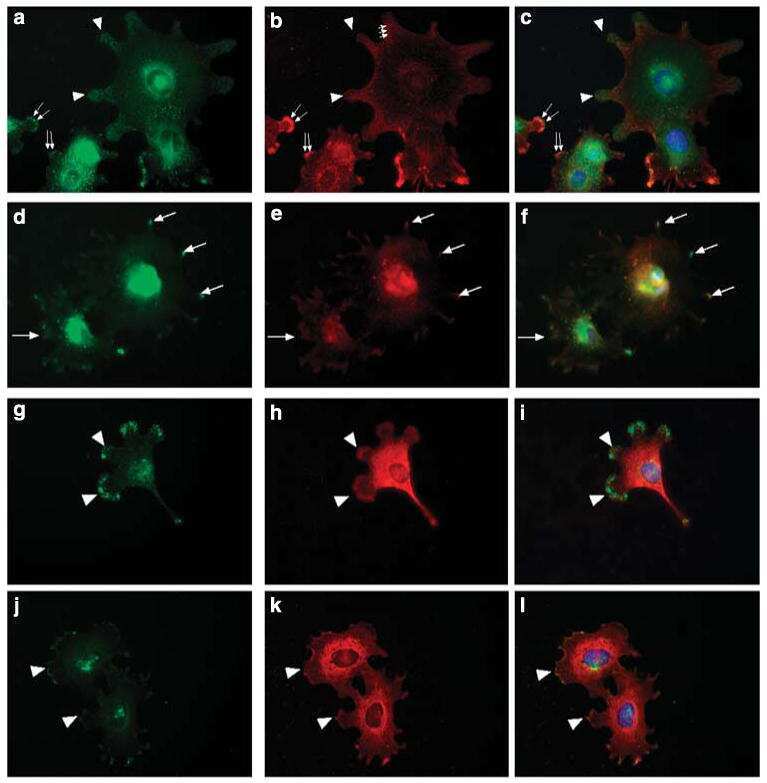
- Indirect immunofluorescence staining of mouse heart vessel using Zymed Rb anti-alpha-Actinin-4 (N-term) (Product # 42-1400). Image provided by Dr. James I. Nagy, Ph.D., University of Manitoba, Canada.

- Submitted by
- Invitrogen Antibodies (provider)
- Main image
- Experimental details
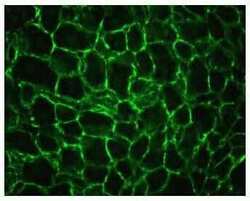
- Indirect immunofluorescence staining of mouse liver using Zymed Rb anti-alpha-Actinin-4 (N-term) (Product # 42-1400). Image provided by Dr. James I. Nagy, Ph.D., University of Manitoba, Canada.
Supportive validation
- Submitted by
- Invitrogen Antibodies (provider)
- Main image
- Experimental details
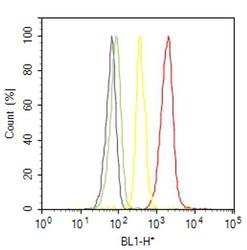
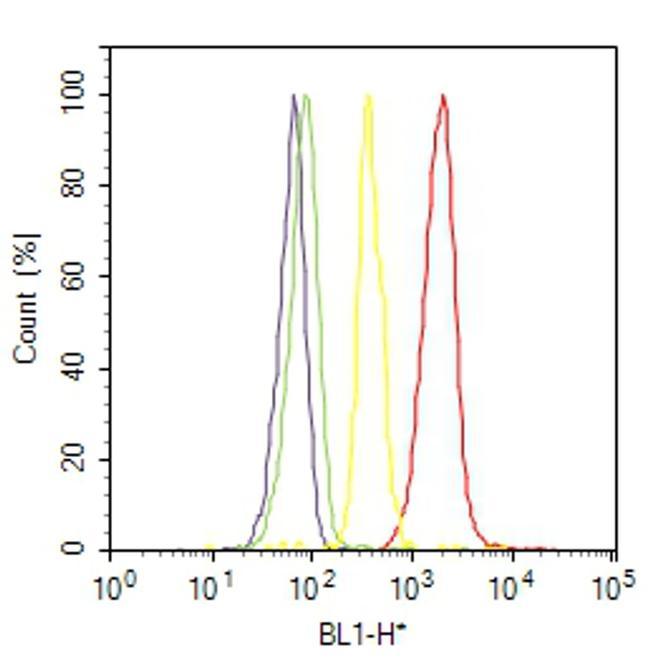
- Flow cytometry analysis of alpha Actinin 4 was done on C2C12 cells. Cells were fixed with 70% ethanol for 10 minutes, permeabilized with 0.25% Triton™ X-100 for 20 minutes, and blocked with 5% BSA for 30 minutes at room temperature. Cells were labeled with alpha Actinin 4 Rabbit Polyclonal Antibody (421400, red histogram) or with rabbit isotype control (yellow histogram) at 3-5 ug/million cells in 2.5% BSA. After incubation at room temperature for 2 hours, the cells were labeled with Alexa Fluor® 488 Goat Anti-Rabbit Secondary Antibody (A11008) at a dilution of 1:400 for 30 minutes at room temperature. The representative 10,000 cells were acquired and analyzed for each sample using an Attune® Acoustic Focusing Cytometer. The purple histogram represents unstained control cells and the green histogram represents no-primary-antibody control..
Supportive validation
- Submitted by
- Invitrogen Antibodies (provider)
- Main image
- Experimental details
- NULL
- Submitted by
- Invitrogen Antibodies (provider)
- Main image
- Experimental details
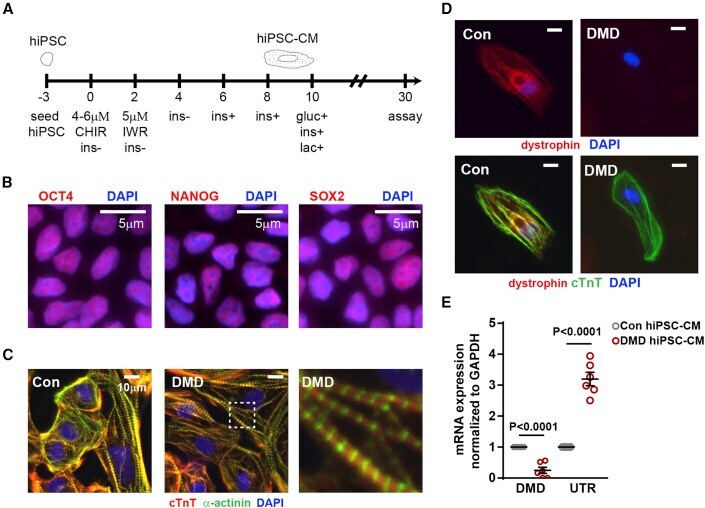
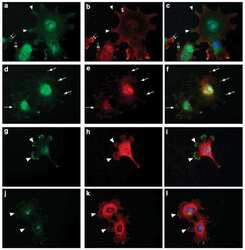
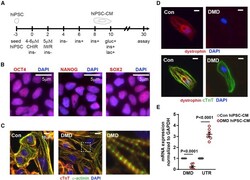
- Figure 1 Generation of DMD hiPSC-CMs (A) hiPSC differentiation protocol for the generation of hiPSC-CMs. CHIR, CHIR-99021; IWR, IWR-1; ins, insulin; gluc, glucose; lac, lactate. hiPSCs were differentiated in medium supplemented with B27 minus insulin (ins). On day 6, the medium was supplemented with B27, including insulin. On day 10, hiPSC-CMs were cultured in medium without glucose supplemented with B27 and lactate. (B) Representative micrograph in which hiPSCs were stained with pluripotent stem cell markers OCT4, NANOG, and SOX2. (C) Representative micrograph in which hiPSC-CMs were stained with cardiac troponin T, alpha-actinin, and DAPI. (D) Representative micrograph in which healthy and DMD hiPSC-CMs were stained with dystrophin, cardiac troponin T, and DAPI. (E) Endogenous dystrophin (DMD) and utrophin (UTR) expression levels were determined by qRT-PCR in hiPSC-CMs (n = 6 independent experiments). Data shown as the mean +- SEM. Student's t test was used to calculate significance.