 Explore
 Validate
 Learn
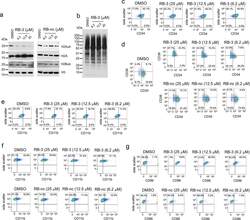
Learn Flow cytometry
Antibody data
- Antibody Data
- Antigen structure
- References [5]
- Comments [0]
- Validations
- Flow cytometry [1]
- Other assay [5]
Submit
Validation data
Reference
Comment
Report error
- Product number
- 46-0388-41 - Provider product page

- Provider
- Invitrogen Antibodies
- Product name
- CD38 Monoclonal Antibody (HB7), PerCP-eFluor™ 710, eBioscience™
- Antibody type
- Monoclonal
- Antigen
- Other
- Description
- Description: The HB7 monoclonal antibody reacts with the human CD38 molecule, an approximately 45 kDa type II transmembrane protein. CD38 is an ectoenzyme which catalyses NAD into nicotinic acid adenine dinucleotide phosphate (NAADP) and cyclic ADP-ribose (cADPR), both of which are secondary messengers. Expression of CD38 is bimodal during B cell development, modulating from high in immature cells to low in intermediate ones and back to high on mature B cells. Additionally CD38 is found in a variety of tissues and other hematopoietic cells (e.g. T cells, NK cells and monocytes) and can be used to phenotype leukemias and monitor HIV-1 progression. The CD34+CD38- population of hematopoietic stems cells is thought to define the most pluripotent cells (e.g. blast colony forming cells). In addition to surface expression, CD38 has recently been found in the nucleus where it may play a role in monitoring calcium levels. Applications Reported: This HB7 antibody has been reported for use in flow cytometric analysis. Applications Tested: This HB7 antibody has been pre-titrated and tested by flow cytometric analysis of normal human peripheral blood cells. This can be used at 5 µL (0.06 µg) per test. A test is defined as the amount (µg) of antibody that will stain a cell sample in a final volume of 100 µL. Cell number should be determined empirically but can range from 10^5 to 10^8 cells/test. PerCP-eFluor® 710 emits at 710 nm and is excited with the blue laser (488 nm); it can be used in place of PerCP-Cyanine5.5. We recommend using a 710/50 bandpass filter, however, the 695/40 bandpass filter is an acceptable alternative. Please make sure that your instrument is capable of detecting this fluorochrome. Fixation: Samples can be stored in IC Fixation Buffer (Product # 00-822-49) (100 µL cell sample + 100 µL IC Fixation Buffer) or 1-step Fix/Lyse Solution (Product # 00-5333-54) for up to 3 days in the dark at 4°C with minimal impact on brightness and FRET efficiency/compensation. Some generalizations regarding fluorophore performance after fixation can be made, but clone specific performance should be determined empirically. Excitation: 488 nm; Emission: 710 nm; Laser: Blue Laser. Filtration: 0.2 µm post-manufacturing filtered.
- Reactivity
- Human
- Host
- Mouse
- Isotype
- IgG
- Antibody clone number
- HB7
- Vial size
- 25 Tests
- Concentration
- 5 µL/Test
- Storage
- 4° C, store in dark, DO NOT FREEZE!
Submitted references Small-molecule inhibitors targeting Polycomb repressive complex 1 RING domain.
NKG2C(pos) NK Cells Regulate the Expansion of Cytomegalovirus-Specific CD8 T Cells.
Genetic modification of primary human B cells to model high-grade lymphoma.
Frequencies of Circulating MAIT Cells Are Diminished in Chronic HCV, HIV and HCV/HIV Co-Infection and Do Not Recover during Therapy.
B cells from African American lupus patients exhibit an activated phenotype.
Shukla S, Ying W, Gray F, Yao Y, Simes ML, Zhao Q, Miao H, Cho HJ, González-Alonso P, Winkler A, Lund G, Purohit T, Kim E, Zhang X, Ray JM, He S, Nikolaidis C, Ndoj J, Wang J, Jaremko Ł, Jaremko M, Ryan RJH, Guzman ML, Grembecka J, Cierpicki T
Nature chemical biology 2021 Jul;17(7):784-793
Nature chemical biology 2021 Jul;17(7):784-793
NKG2C(pos) NK Cells Regulate the Expansion of Cytomegalovirus-Specific CD8 T Cells.
Grutza R, Moskorz W, Senff T, Bäcker E, Lindemann M, Zimmermann A, Uhrberg M, Lang PA, Timm J, Cosmovici C
Journal of immunology (Baltimore, Md. : 1950) 2020 Jun 1;204(11):2910-2917
Journal of immunology (Baltimore, Md. : 1950) 2020 Jun 1;204(11):2910-2917
Genetic modification of primary human B cells to model high-grade lymphoma.
Caeser R, Di Re M, Krupka JA, Gao J, Lara-Chica M, Dias JML, Cooke SL, Fenner R, Usheva Z, Runge HFP, Beer PA, Eldaly H, Pak HK, Park CS, Vassiliou GS, Huntly BJP, Mupo A, Bashford-Rogers RJM, Hodson DJ
Nature communications 2019 Oct 4;10(1):4543
Nature communications 2019 Oct 4;10(1):4543
Frequencies of Circulating MAIT Cells Are Diminished in Chronic HCV, HIV and HCV/HIV Co-Infection and Do Not Recover during Therapy.
Spaan M, Hullegie SJ, Beudeker BJ, Kreefft K, van Oord GW, Groothuismink ZM, van Tilborg M, Rijnders B, de Knegt RJ, Claassen MA, Boonstra A
PloS one 2016;11(7):e0159243
PloS one 2016;11(7):e0159243
B cells from African American lupus patients exhibit an activated phenotype.
Menard LC, Habte S, Gonsiorek W, Lee D, Banas D, Holloway DA, Manjarrez-Orduno N, Cunningham M, Stetsko D, Casano F, Kansal S, Davis PM, Carman J, Zhang CK, Abidi F, Furie R, Nadler SG, Suchard SJ
JCI insight 2016 Jun 16;1(9):e87310
JCI insight 2016 Jun 16;1(9):e87310
No comments: Submit comment
Supportive validation
- Submitted by
- Invitrogen Antibodies (provider)
- Main image

- Experimental details
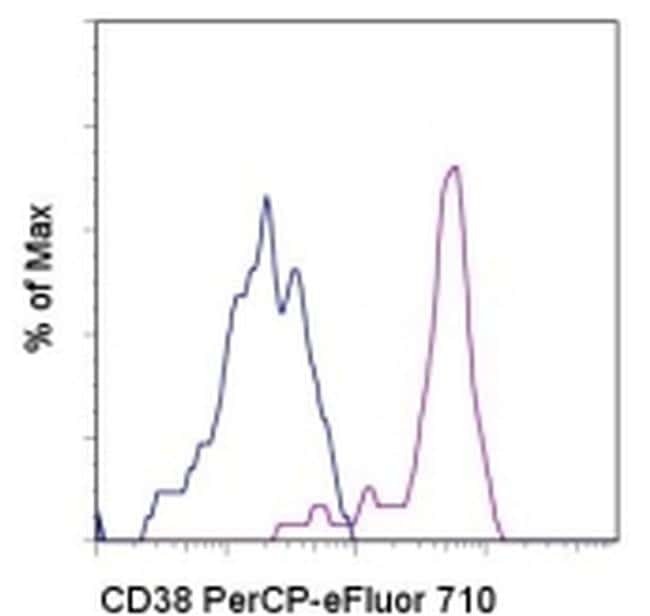
- Staining of normal human peripheral blood cells with Mouse IgG1 K Isotype Control PerCP-eFluor® 710 (Product # 46-4714-82) (blue histogram) or Anti-Human CD38 PerCP-eFluor® 710 (purple histogram). Cells in the monocyte gate were used for analysis.
Supportive validation
- Submitted by
- Invitrogen Antibodies (provider)
- Main image
- Experimental details
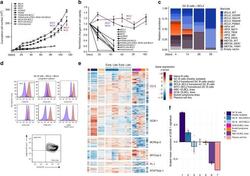
- Fig. 2 Long-term expansion of human germinal center B cells ex vivo. a Primary human GC B cells were transduced with the indicated oncogenes and oncogene combinations and cultured separately for up to 120 days. Graph shows calculated theoretical absolute cell numbers (+-s.e.m., n = 3). Viable cells were assessed by trypan blue exclusion. Source data are provided as a Source Data file. b Primary human GC B cells were transduced with different oncogenes and oncogene combinations and monitored by flow cytometry. Graph shows the change in cell viability assessed by scatter characteristic by flow cytometry ( +- s.e.m., n = 3). Source data are provided as a Source Data file. c Primary human GC B cells were transduced with BCL2 in combination with other transcription factors in a pooled, competitive culture. Graph shows relative abundance of transcription factors or their mutant versions over four different timepoints ( n = 3). d Primary human GC B cells were transduced with the oncogenic cocktail BCL2 and BCL6 and cultured to day 73. Representative flow cytometry analysis ( n = 3) for the expression of the GC B cell markers CD38, CD20, CD19, CD80, CD22, CD95, CXCR4, and CD86. Red histograms show GC B cells compared to primary human naive B cells (blue). e Heat map of gene expression of freshly isolated GC B cells ( n = 3), transduced GC B cells ( BCL2-BCL6, BCL2-MYC ) cultured ex vivo for 5 or 73 days ( n = 3), plasma cell line ( n = 1), naive B cells ( n = 1), and lymphoma cell li

- Submitted by
- Invitrogen Antibodies (provider)
- Main image

- Experimental details
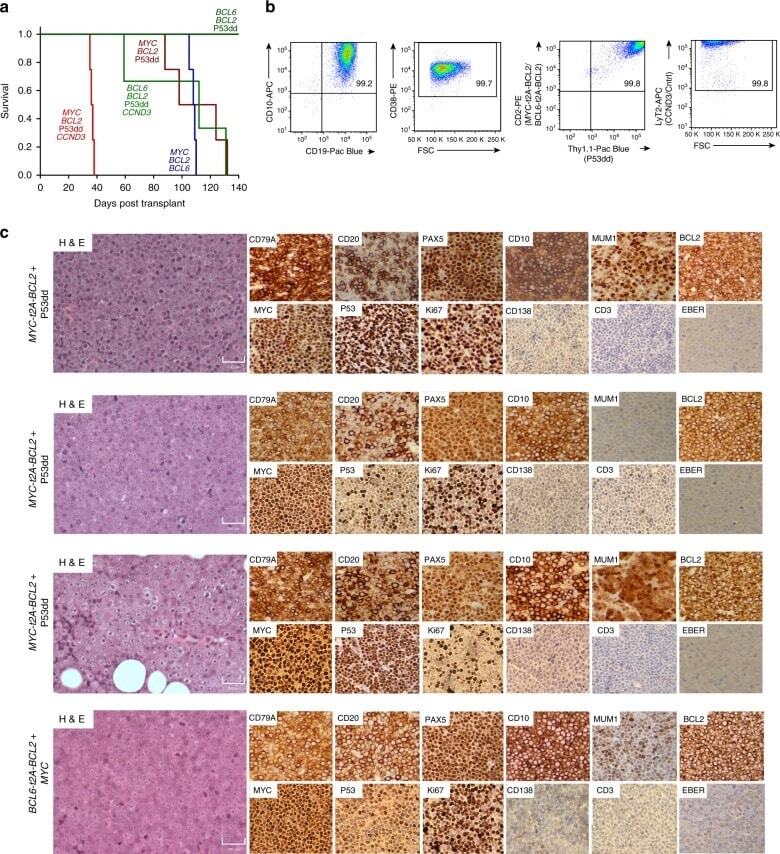
- Fig. 5 Mutation-directed, in vivo models of human lymphoma. a Primary human GC B cells (as well as YK6-CD40lg-IL21 cells) transduced with the indicated oncogene cocktails were injected subcutaneously into NOD/SCID/gamma mice ( n = 3-4 per cohort) and monitored for palpable tumors. Mice were culled when tumors reached 12 mm in size. Survival of the recipient mice is plotted as a Kaplan-Meier curve. Source data are provided as a Source Data file. b Cells isolated from tumors were stained for the viral transduction markers CD2 ( MYC-t2A-BCL2 or BCL6-t2A-BCL2 ), Thy1.1 (P53dd), LyT2 ( CCND3 /Cntrl), and B cell markers CD19, CD10, and CD38 and were analyzed by flow cytometry. A representative example is shown. FSC forward scatter. c H&E and immunohistochemistry images for the indicated proteins are shown (magnification x20). Scale bar, 100 muM. Four representative tumors from mice described in a are shown
- Submitted by
- Invitrogen Antibodies (provider)
- Main image
- Experimental details
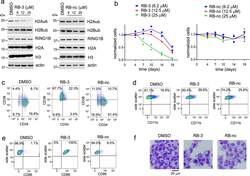
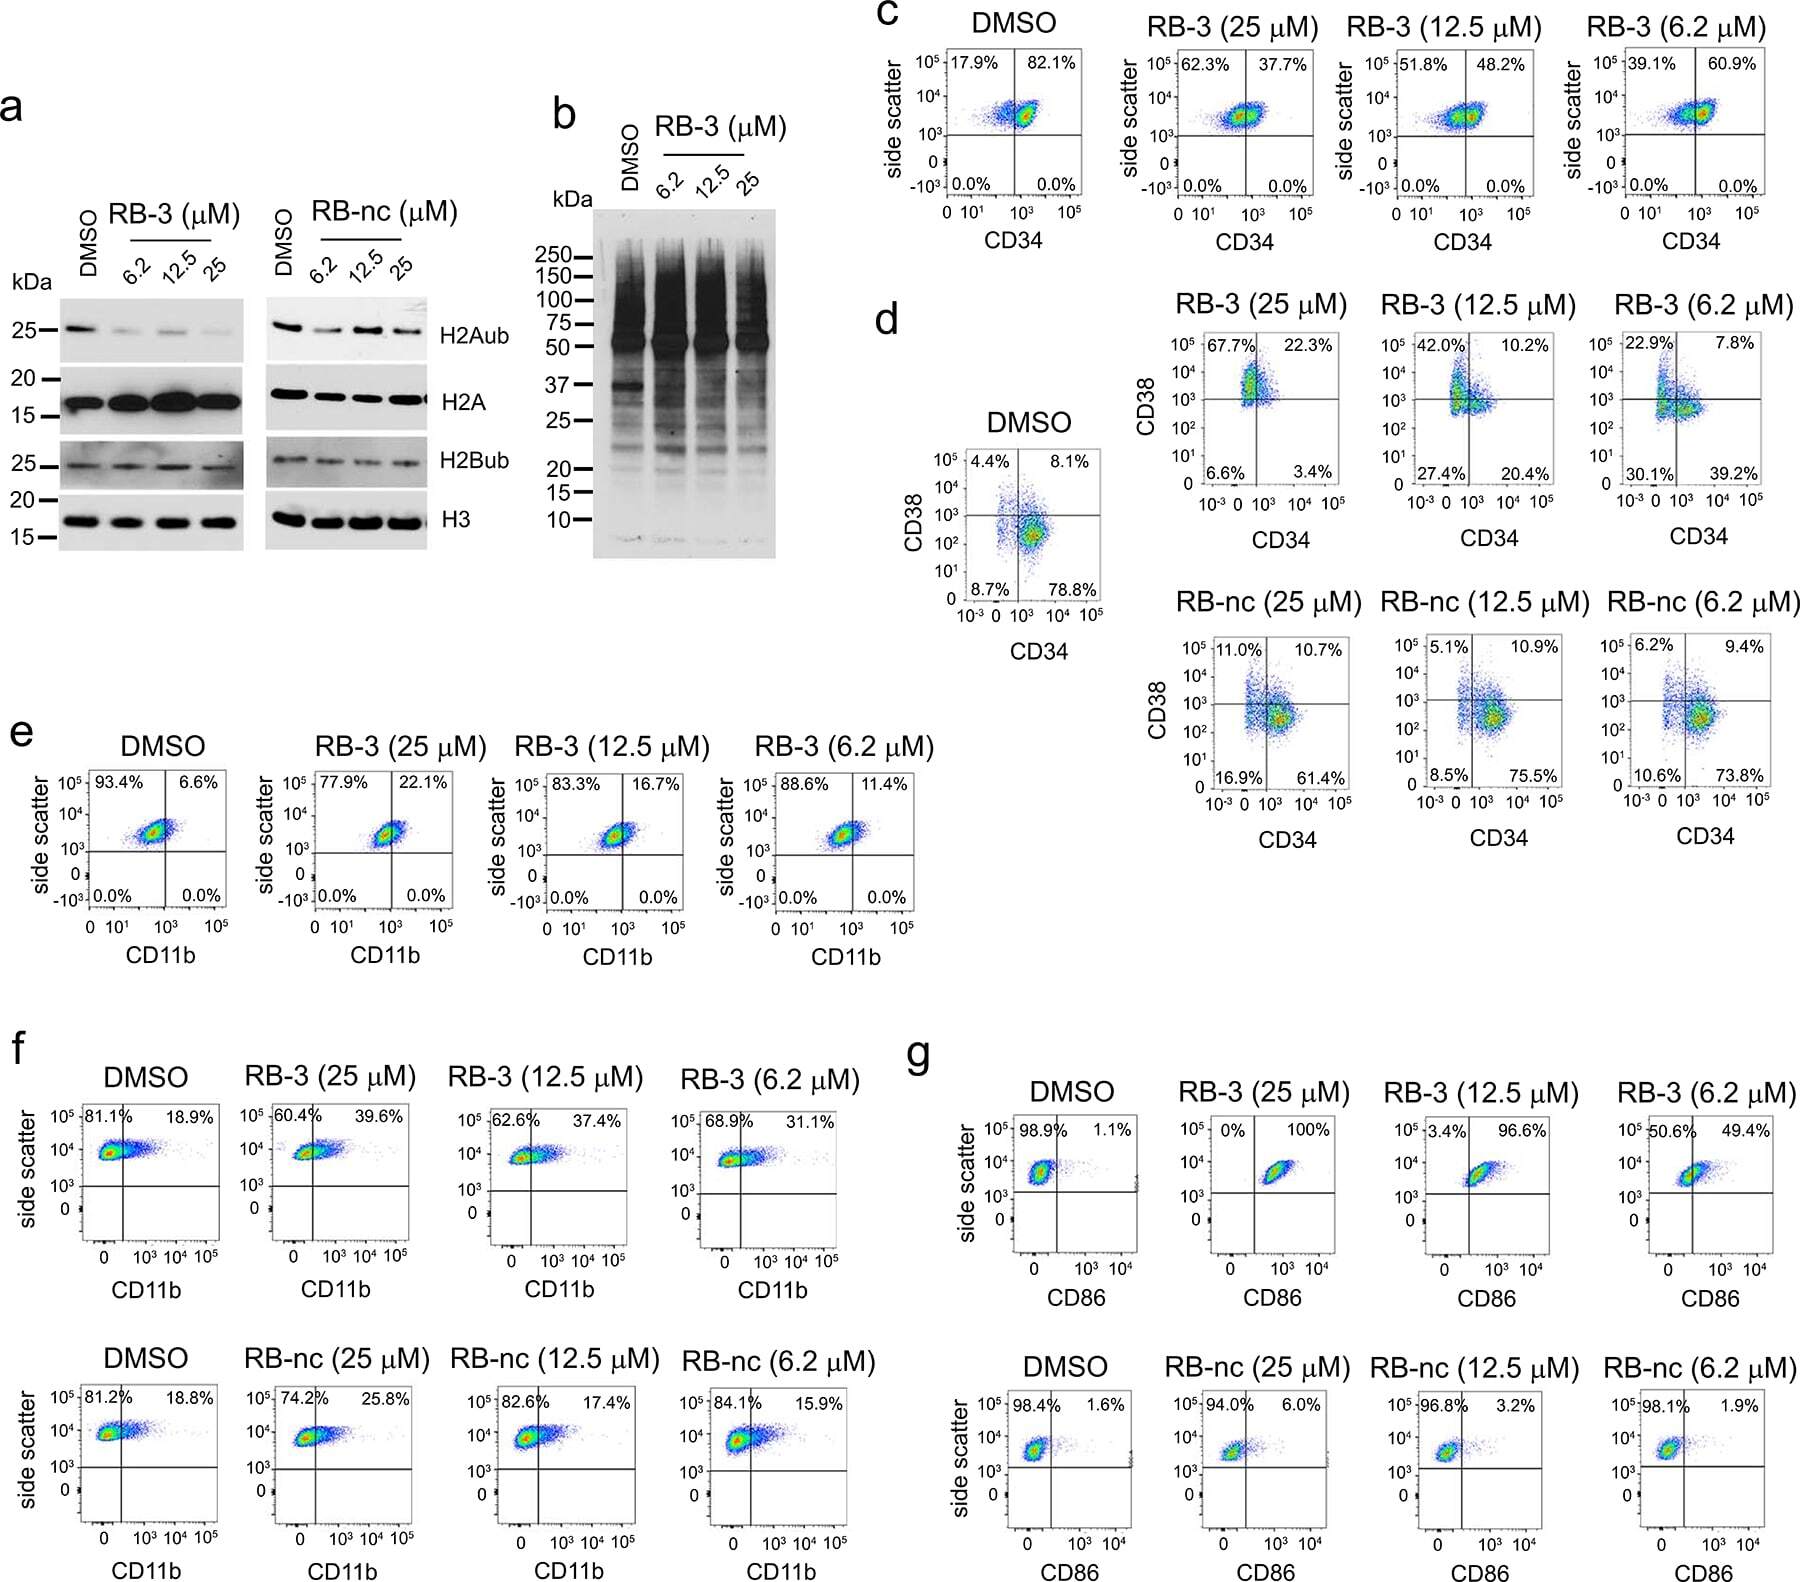
- Figure 3. Treatment with RB-3 leads to reduction in H2Aub and differentiation in TEX cells. a , Assessment of H2Aub, H2Bub, H3 and total H2A in TEX cells treated with RB-3 (left) or RB-nc (right) for 4 days. Representative gel of three independent experiments. b , Effect of RING1B inhibition on the growth of TEX cells treated with RB-3 and RB-nc. Representative data from two independent experiments. c, d, e, Flow-cytometry analysis of CD34 and CD38 ( c ), CD11b ( d ) and CD86 ( e ) expression in TEX cells treated with 25 muM RB-3 and 25 muM RB-nc for 21 days. Representative histograms of two independent experiments. f, Cell morphology of TEX cells after 21 days of treatment with 25 muM RB-3, 25 muM RB-nc or DMSO analyzed by Wright Giemsa staining. Representative slides are shown from two independent experiments.

- Submitted by
- Invitrogen Antibodies (provider)
- Main image
- Experimental details
- Extended Data Fig. 6 Long-term effect of treatment of TEX cells with RB-3. a ) Western blot detection of H2Aub in TEX cells treated with increasing doses of RB-3 and RB-nc for 21 days. Representative blot out of two replicates. b ) Western blot detection of total cellular ubiquitination levels using ubiquitin specific antibody in TEX cells treated with RB-3 for 21 days. Representative blot out of three replicates. c ) Flow cytometry analysis of CD34 in TEX cells treated with RB-3 for 7 days. On day 7, cells were stained with APC/CY7-conjugated human anti-CD34 antibody and analyzed by FACS. Representative histograms of two independent experiments. d ) Flow cytometry analysis of CD34 and CD38 in TEX cells treated with RB-3 (top panel) and RB-nc (bottom panel) for 21 days. On day 21, cells were stained with APC/CY7-conjugated human CD34 and PE-conjugated CD38 antibodies and analyzed by FACS. Representative histograms of two independent experiments. e,f ) Flow cytometry analysis of myeloid differentiation marker CD11b/ ITGAM in TEX cells treated with RB-3 for 7 days ( e ) and with RB-3 ( f , top panel) and RB-nc ( f , bottom panel) for 21 days. Cells were stained with Pacific Blue human CD11b antibody and analyzed by FACS. Representative histograms of two independent experiments. g ) Flow cytometry analysis of dendritic cells differentiation marker CD86/B7-2 in TEX cells treated with RB-3 (top panel) and RB-nc (bottom panel) for 21 days. On day 21, cells were stained with Super B
- Submitted by
- Invitrogen Antibodies (provider)
- Main image

- Experimental details
- Extended Data Fig. 9 RB-3 has no effect on normal CD34 + cells. a ) Quantitation of colony numbers (CFU) upon treatment of cord blood CD34 + cells from healthy donors with RB-3. Experiments were performed two times and representative data are mean +- s.d. and analyzed by two-tailed t-test; ns - not significant. b ) Population of CD34 + cells upon treatment with RB-3. Experiments were performed two times and representative data are mean +- s.d. and analyzed by two-tailed t-test; ns - not significant. c ) Flow-cytometry analysis of CD34 and CD38. Representative histograms of two independent experiments. d ) Effect of RB-3 on various populations of mature cells with representative colony pictures. CFU-GM, granulocyte-macrophage progenitors; CFU-GEMM, oligopotential progenitors; BFU-E, burst-forming unit-erythroid cells; CFU-E, colony-forming unit-erythroid cells. Experiments were performed two times and representative data are mean +- s.d. and analyzed by two-tailed t-test; ns - not significant. e ) Cell morphology of CD34 + cells treated with RB-3 analyzed by Wright Giemsa staining. Representative slides are shown from two independent experiments.
